Forest and environment
Yves Zanatta, Eero Mikkola, Markus Engels
Statistics
in focus
AGRICULTURE AND
FISHERIES
THEME 5-17/2000
AGRICULTURE
Contents
1 Today's
forest
in
the
European Union
1
1.1 Forest and other wooded landi 1.2 Changes in Forest (F) area....2
1.3 Forest ownership 3
1.4 Growth of timber 3
2 EU forests and their benefits
to the environment
4
2.1 Supply on timber 4
2.2 Carbon sequestration 4 2.3 Strictly protected forests 4
2.4 Soil protection 4
2.5 Recreation 6
3 State of Forests in the EU
6
3.1 Defoliation 6
3.2 Forest fires 7
Storm damages 7
For methodological hints see text boxes
Wh
eurostat
Manuscript completed on: 30.06.2000 ISSN 15621340
Catalogue number: CANNOO017ENC Price in Luxembourg per single copy (excl. VAT): EUR 6
© European Communities, 2000
The forests of the European Union vary widely in the structure of their
biological and economic resources and in the functions they are expected to
serve. Figures available today are suitable only for overall descriptions of the
environmental aspects of forests. They might show (or hide) problems that do
not play a role (or that could be essential) on the local level.
The importance of forests differs depending on which of their numerous
functions are taken into consideration.
Environmental and other benefits of forests are potentially endangered by
both natural and man made damage. Although the consequences of the
damage may be of minor consequence at the global level at the moment, they
are certainly serious in the affected regions. They will become perceptible
also at national or European levels if the frequency and strength of damage
events continue to develop.
The main source of data used is TBFRA 2000 (Temperate and Boreal Forest Resource Assessment) compiled by UNECE/FAO.
Data on defoliation originates from the ICP (International Cooperative Programme on the Assessment and Monitoring of Air Pollution Effects on Forests). Data on forest fires are collected by the Directorate General of Agriculture of the European Commission.
The source of the data on strictly protected forests is the COST 4 project of the EL).
1
Today's forest in the European Union
1.1
Forest and other wooded land
Tree covered ground exists in a variety of formations, closed
{Forests
(F) as
such) and others with lower density of the canopy (socalled
Other wooded
land
(OWL)).
Forest and other wooded land
(FOWL) plays a big role in terms of land cover.
With more than 40 % of the total area, it matches the agricultural area in the
EU15.
On the other hand, the share of the Gross Value Added (sum of all Member
States for which data was available) contributed by forestry to the
corresponding sum of Gross Domestic Products in 1997 was 0.17 % and is
thus negligible in discussions at the overall level.
Graph 1: Land use in Europe
ι
I
Ifllfljnjf
Β DK D
S o u r c e : T B F R A 2000 (UNECE); Reference period: 1990 1999
UK NL A Ρ FIN S
■ Other areas
D Utilised agricultural area D F o r e s t and o t h e r w o o d e d land
EU15 Belgium Denmark Germany Greece Spain France Ireland Italy Luxembourg Netherlands Austria Portugal Finland Sweden United Kingdom
FOWL 1000ha
136204 672 538 10740 6513 25984 16989 591 10842 89 339 3924 3467 22768 30259 2489
F
%
83 96 83 100 52 52 89 100 91 97 100
98
98 96 90 99
OWL
%
17 4 17
0 48 48 11 0 9 3 0 2 2 4 10
1 Table 1: Proportions of Forest and Other wooded land in the EU (TBFRA 2000)
Large parts of the
Wooded area
(FOWL) of the EU are located in
Scandinavia and in the Medi
terranean region. In general, FOWL
of Scandinavia and the central EU
countries contains a higher share of
closed Forest (F) than that of the
Mediterranean
countries.
Taking
only the area of Forest land (F),
Sweden and Finland lead with a
joint share of 43 % of the EU. Spain
and Greece have a significant
(nearly 50 %) proportion of other
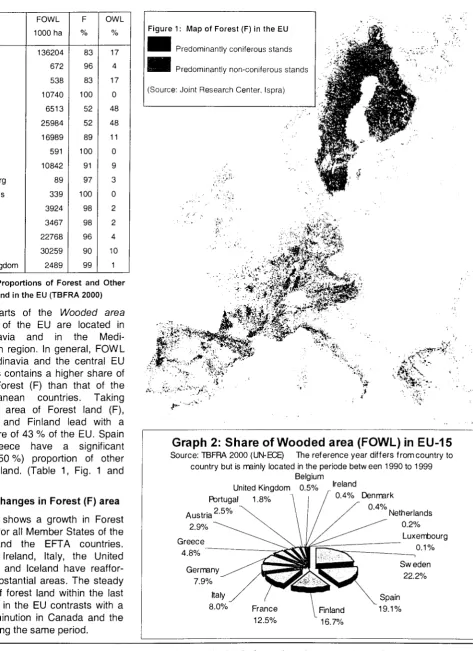
wooded land. (Table 1, Fig. 1 and
Graph 2)
1.2
Changes in Forest (F) area
Graph 3 shows a growth in Forest
(F) land for ail Member States of the
Union and the EFTA countries.
Greece, Ireland, Italy, the United
Kingdom and Iceland have reaffor
ested substantial areas. The steady
growth of forest land within the last
50 years in the EU contrasts with a
clear diminution in Canada and the
USA during the same period.
Figure 1 : Map of Forest (F) in the EU I Predominantly coniferous stands
W3B Predominantly nonconiferous stands (Source: Joint Research Center, Ispra)
■
:-m
;m.
'w**
.· ■*'.'?> ■·■'' 'iL'r.'
m * W-m,
!
-'.r"'Vïi.
«fe ν
Graph 2: Share of Wooded area (FOWL) in EU15
Source: TBFRA 2000 (UNECE) The reference year differs from country to country but is mainly located in the periode between 1990 to 1999
Belgium United Kingdom 0.5% Portugal 1.8%
Ireland
Denmark
Netherlands 0.2%
Luxembourg 0.1% Sw eden
22.2%
France 12.5%
Finland 16.7%
Spain 19.1%
Forest is defined as land with tree crown cover (or equivalent stocking level) of more than 10 percent and area of more than 0.5 ha. The trees should be able to reach a minimum height of 5 m at maturity in situ. It may consist either of closed forest formations or of open forest formations with a continuous vegetation cover in which tree crown cover exceeds 10 percent. Young natural stands and all plantations established for forestry purposes which have yet to reach a crown density of 10 percent or tree height of 5 m are included under forest.
Other wooded land is land either with a tree crown cover (or equivalent stocking level) of 510 percent of trees able to reach a height of 5 m at maturity in situ; or a crown cover (or equivalent stocking level) of more than 10 percent of trees not able to reach a height of 5 m at maturity in situ (e.g. dwarf or stunted trees) and shrub or bush cover.
S t a t i s t i c s in f o c u s — Theme 5 — 17/2000
[image:2.595.84.558.48.700.2] [image:2.595.37.221.60.328.2]Graph 3: Evaluation of c h a n g e in forest area
The reference periods of the countries may differ up to 5 years from the presented years
% (1950=100)
Source: UNECE; extracted from EFIDAS
250
200
150
100
50
664
□ 1950 D1960 H1995
1500
ULM
EU Β DK D EL E F IRL I L NL A Ρ FIN S UK
15
IS NO CH CA USA
1.3
Forest ownership
Data
on
forest
ownership
is
important in determining the way
forests are managed and used.
Private
forests
owners
have
emphasised
generally
economic
objectives e.g. income from timber
sales, but environmental factors play
a more important role for private
forest owners today. In addition to
economic
and
environmental
objectives public owned forests are
of special interest for their greater
availability for recreational and other
purposes of public interest. In EU15
about 40.6 million ha (30%) of
wooded area (FOWL) are owned by
public owners, 95.6 million ha
(70 %) by private persons.
1.4
Timber growth
The
Growing
stock
gives
an
overview on what the forests provide
in environmental and economic
benefits linked to the growth of
timber. Sweden, France, Germany
and Finland are the four countries
with the largest Growing stocks
corresponding to their substantial
areas of forest land (F). With their
better growing conditions however
Germany, France Italy and Austria
have significantly higher rankings
than in the distribution of Forest
land. On the contrary, rankings for
Spain, Greece and Portugal are
Graph 4: Ownership of Forest and other wooded land
Reference period 1987 to1995 Source: TBFRA 2000 (UNECE)
100%
80%
60% f
40%
20%
0%
Π In private ow nership El In public ow nership
(1000 nf overbark) 3500000
Graph 5: Growing stock
Fieference period 1990 to 1999 Source: TBFFÌA 2000 (UNECE)
S F D FIN I A E UK Ρ EL Β DK NL IRL L Ν CH
lower compared to those of Forest
(F) land. The development of the
Growing stock is a result of the
accumulation of the
Net annual
increment
in forests and of the
Removals
of harvested timber. The
increment is particularly influenced
by the composition of tree species,
the length of the average rotation
period, soil and climatic conditions
as well as age class distributions.
The variation of the Net annual
increment between the countries is
more
influenced
by
growing
conditions than is the Growing stock
(see
Graph
6).
The
growing
conditions can be quantified by the
Net annual increment per hectare of
forest land. For this parameter, the
central EU countries lead, while
Scandinavian and Mediterranean
countries do not reach half of their
productivity.
2
EU forests and their benefits to the environment
2.1
Supply of timber
Wood is a raw material that is
normally produced without input of
external
energy
or
substances
except harvesting. Wood growth in
forests is quantified by the Net
Annual Increment. Annual Fellings
(of which ca. 90 % are Annual
Removals) give an idea on the
amount of wood that is cut per year.
Removals show the volume actually
removed from the forest (Graph 6).
At the global level the sustainability
of
the
exploitation
of
wood
resources can be shown by the ratio
of Fellings to Increment (average
values over at least five years
should be used). Values below
100% thereby mean sustainability
in wood production. The average for
EU15 is about 65%. For no
Member State is the percentage
over 90 % and for 11 of them it is
Today, there is a public interest
in indicators on biodiversity. For
the global forest figures of this
chapter, differences might be
expected between the north
and the south of Europe in
structure and composition ot
forest stands. But none of the
available global figures can
reliably
detect
qualities
of
biodiversity and there are no
comparable methods for direct
measurement
at
the inter
national level.
lower than 70 %. Following this
indicator, it can be said, that in EU
15 forests are managed in a
sustainable way.
2.2
Carbon sequestration
In the context of the global climate
change the danger of excessive
C0
2emissions
has
become
Growing stock is the living tree component of the standing volume of all trees.
Net annual increment is defined as average annual volume over the given reference period of gross increment less that of natural losses on all trees to a minimum diameter of 0 cm (d.b.h. =diameter at breast height; definition of TBFRA 2000).
Annual fellings are the average annual standing volume of all trees, living or dead, measured overbark to a minimum diameter of 0 cm (d.b.h.), that are felled during the given reference period, including the volume of trees or parts of trees that are not removed from the forest, other wooded land or other felling site. It includes silvicultural and precommercial thinnings and cleanings left in the forest and trees killed or damaged by natural causes, e.g. fire, windblow, insects and diseases (natural losses) that are recovered (harvested).
Annual removals are the average annual volume of those fellings that are removed from the forest, other wooded land or other felling site during the given reference period. It includes removals during the given reference period of trees felled during an earlier period and natural losses. (Generally, Removals are measured in m3 under bark).
(1000 m3 overbark)
100000
Graph 6: Net annual increment, Fellings and Removals
Reference period 1990 to 1999 Source: TBFRA 2000 (UNECE)
90000 80000 70000 60000 50000 40000 30000 20000 10000 0
D Net annual increment π Annual fellings
Ξ Annual removals
\t
iJjJ
ΓΠΒ π
m
π - τ η - »
F D S FIN E A UK Ρ Β EL IRL DK NL L Ν CH
S t a t i s t i c s in f o c u s — Theme 5 — 17/2000 ■
ΈΔ
increasingly evident. Forests are
able to bind C 0
2emitted by
industries and households within the
increment of wood. A part of this
increment that is accumulated in the
growing stock is harvested and
removed from the forests each year.
The carbon of these removals will of
course also be contained in all
products which are produced from it,
e. g. in sawnwood and wood-based
panels.
A high degree of sawnwood and
wood-based panels is used for
permanent
constructions,
which
means that the carbon persists over
a long period of time bound in these
materials.
The
other
wooden
products (e.g. fuelwood and paper)
and also that part of the increment
of the forests that is not harvested
will be decomposed or burned
sooner or later and return to the
atmosphere.
In natural forests where removals
have never taken place the balance
of
C0
2exchanged
with
the
atmosphere usually is zero in the
long run.
Therefore, the only possibility to
enhance carbon sequestration using
forests is to remove harvested
timber (provided that it is used for
permanent
construction)
or
by
afforestation and improvement of
low-stocked wooded areas.
Graph 7 shows that in the most
cases the annual emissions exceed
the amount of C0
2that is rebound
by the forests by increment of wood
(less than 50 % in most of the
Member States; 1 2 % in EU-15).
The exceptions are Sweden and
Finland were C 0
2equivalents of
increment are higher than C0
2-emissions.
The
figures
were
converted
to
C 0
2equivalents
following their carbon content (1m
3of pure wood corresponds to 0.92 t
C0
2).
These figures show that it is
impossible to combat the increase of
C0
2in the atmosphere by forestry
alone, even if the existing effects
cannot be neglected and they might
be reinforced by more extensive use
of wood for all type of constructions
in combination with other measures.
2.3
Strictly protected forests
There
are
nearly
90
different
categories
of
protected
forests
ranging from national parks to
"aesthetic" forests. In terms of
"natural"
the
most
interesting
category of forests in Europe are the
strictly protected forests, which are
left to develop freely in a state which
is as original as possible. Due to the
historically
continuous
use
of
forests, there are few
original
untouched natural forests remaining
in Europe. The total area of strictly
protected forest for the EU countries
is estimated at nearly 2 million
hectares, almost 1.6 % of the total
forest area. The number of
strict
forest reserves in the EU is over
2800. The aims and degree of forest
protection vary widely
amongst
European countries. In Northern
Europe the primary goal of forest
protection during the last 10-20
years has been the preservation of
the old remnants. In the central EU
countries
however,
forests
are
rather protected as a part of the
landscape, as a cultural feature or
as specimens of original forests.
Graph 7: CO2 -equivalents of Increment, Removals and Wood-based products
compared to total CO2-emissions
(Reference perbd 1990 to 1999 Totals of national CC^-emisstons correspond to 100% Source: TBFPA 2000 (UN-ECE), Eurostat)
145 B I O 4 I I 4
30
20
10
-Ξ Net annual increment
Π Removals
□ Saw nw ood and w ood based-panels
__L_
-_iJkln.lkiKli
,l~u, i-i-,, I n ,1-u,
ΠΝ EU-15 IRL DK UK NL
Strict forest reserves: areas in which no silvicultural operations, or any other human impacts are allowed. They occur, where feasible, in Europe under very different forms of protection status: small isolated areas and/or core areas within larger protection categories such as national parks, nature parks, or biosphere reserves. "Strict" may include activities related to hunting, rare species protection, scientific work, etc.
2.4
Soil protection
Soil protection is one of the most
important
of
the
environmental
protection
functions
of
forests.
Whereas it is of no or minor
significance in northern and central
EU
countries,
it
has
to
be
emphasised for the countries in the
far south and of course for countries
with steeply sloping areas, such as
throughout the Alpine range. In
Spain 22.13 million ha of FOWL are
primarily
managed
for
soil
protection,
6.47
million
ha
in
Greece, 0.84 million ha in Austria,
0.48 million in Germany and 0.43
million in Italy.
2.5
Recreation
Forests play a considerable role for
the individual recreation of the
inhabitants of the Member States.
The availability per inhabitant of
FOWL (wooded area) is presented
in Table 2. These figures are, of
course, averages for the country as
a whole and do not provide any
information on regional or local
aspects. However, they give a first
impression on the global situation.
The range amongst the Member
States is remarkable.
E U 1 5
F i n l a n d S w e d e n S pain G r e e c e A u s t r i a Ρ o r t u g a l F r a n c e L u x e m b o u r g Italy
Ireland G erm any D en m ark Β e l g i u m U n i t e d K i n g d o m Ν e t h e r l a n d s
Ν o r w a y Ic e l a n d L i e c h t e n s t e i n S w i t z e r l a n d
C a n a d a
R u s s i a n F e d e r a t i o n U n i t e d S t a t e s
F O W L ( h a / h e a d )
0,36
4 , 4 2 3,41 0,66 0,61 0,48 0,35 0,29 0,21 0,19 0,16 0,13 0,10 0,07 0,04 0,02
2 , 7 2 0,47 0,23 0,17
1 3 , 6 6 6,01 1 ,09
T a b l e 2 : F O W L p e r I n h a b i t a n t
3
State of Forests in the Ell
3.1
Defoliation
As it is impossible to describe forest
condition taking into consideration
the state of all of its components,
some key parameters are used. One
of the most common for this purpose
is the crown condition. As the crown
condition
is
an
nonspecific
symptom, which reacts to many
different stress factors, defoliation
values of one year contain only
limited information on the influence
of
single
factors.
Only
the
development of defoliation over time
may give evidence of continuously
acting
stress factors such as air
pollution. Regarding the develop
ment of six main tree species (Scots
pine, Norway spruce, European oak,
Common beech, Maritime pine and
Holm oak) in Europe since 1989, the
overall deteriorating trend becomes
Graph 8: Defoliation of broadleaves
(defoliation classes 24), 19891998
SOLT ce ICP Forests
1989 1990 1991 1992 1993 1994 1995 1996 1997 1998
Data on defoliation are based on the joint publication on monitoring of forest condition by the European Commission and the UN Economic Commission for Europe carried out in the framework of the ICP (see page 1). The sample survey for 1998 is done for about 371 000 sample trees on 17 861 sample plots (Reference: Forest Condition in Europe: 1999 Report. UNECE and European Commission. Geneva and Brussels,1999).
Defoliation is defined as the percentage of the lack of foliage in relation to a fully foliated tree, which would score 0 % defoliation, while a fully defoliated tree indicates 100 % defoliation. The survey results are presented in terms of percentages of the tree sample falling into five defoliation classes:
Class 0 Needle/leaf loss (%): up to 10
Class 1 Needle/leaf loss (%): >10 25
Class 2 Needle/leaf loss (%): >25 60
Degree: none Degree : slight Degree : moderate
Class 3 Needle/leaf loss (%): >60 <100
Class 4 Needle/leaf loss (%): 100
Degree : severe Degree :dead
Classes 2 to 4 represent trees of considerable defoliation and are thus referred to as 'damaged'.
S t a t i s t i c s i n f o c u s — Theme 5 — 17/2000 ■
m
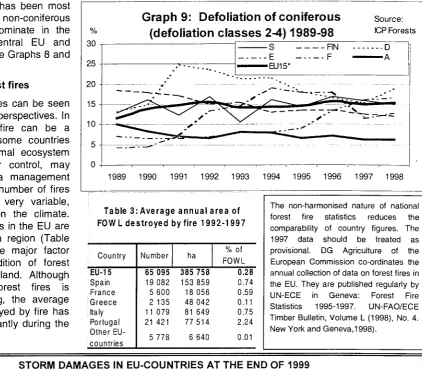
obvious. This trend has been most
pronounced
for
non-coniferous
species which predominate in the
countries of the central EU and
Southern Europe (see Graphs 8 and
9).
3.2
Forest fires
The role of forest fires can be seen
from many different perspectives. In
plantation forestry, fire can be a
major problem. In some countries
fire is seen as normal ecosystem
process and, under control, may
even be used as a management
tool. In Europe, the number of fires
and their extent is very variable,
depending mostly on the climate.
91 % of all forest fires in the EU are
in the Mediterranean region (Table
3), where fire is the major factor
influencing the condition of forest
and other wooded land. Although
the number
of forest fires is
constantly increasing, the average
area annually destroyed by fire has
not changed significantly during the
periodi 992-1997.
%
30
25 20 15
10 5
Graph 9: Defoliation of coniferous
(defoliation classes 2-4) 1989-98
Source: ICP Forests
• D
■A
1989 1990 1991 1992 1993 1994 1995 1996 1997 1998
Table 3: Average a n n u a l area of FOW L d e s t r o y e d by fire 1992-1997 Country
EU-15 Spain France ^Greece
Italy Portugal Other EU-countries
Number 65 095 19 082 5 600 2 135 11 079 21 421 5 778
ha 385 758
153 859 18 056 48 042 81 649 77 514 6 640
% of FOWL
0.28
0.74 0.59 0.11 0.75 2.24 0.01
The non-harmonised nature of national forest fire statistics reduces the comparability of country figures. The 1997 data should be treated as provisional. DG Agriculture of the European Commission co-ordinates the annual collection of data on forest fires in the EU. They are published regularly by UN-ECE in Geneva: Forest Fire Statistics 1995-1997. UN-FAO/ECE Timber Bulletin, Volume L (1998), No. 4. New York and Geneva, 1998).
STORM DAMAGES IN EU-COUNTRIES AT THE END OF 1999
Fortunately, Europe is not very exposed for disastrous storms, even if every year local storms cause damage to
some forest holdings. But, in December 1999 there were three strong storms, and countries sustained damage
to their forests, which in terms of volume of wood blown down is the highest in Europe since the disastrous
storms of 1990. Actually, the estimate of the total volume of blown wood was nearly 180 million m
3in the EU,
almost 70 % of the normal volume of the annual harvest. France was the country most affected, with an
estimated total of 140 million m
3, followed by Germany with 30 million m
3and, outside the EU, Switzerland with
12 million m
3, which is about three times the annual harvest in Switzerland. The fallen timber is only 0.6 % of
the wood in Europe's forests
In the affected countries wind blown wood has significant consequences at the local level. The unexpected
over-supply of roundwood has caused troubles in the roundwood market. Despite the increased costs of
harvesting windblown trees, wood prices have dropped sharply, and caused major economic damage to forest
owners - both public and private. Programmes and strategies have been developed and applied, in
consultation with all market partners, to minimise this damage. In addition to immediate economic damage the
windblown wood presents ideal circumstances for insect outbreaks and, when it dries, for forest fires, thus
threatening forests not affected by the storms themselves. This makes it urgent to clear the wood as fast as
possible. There will also be some long term positive consequences of the storm. The new export markets and
outlets could be valuable to the sector. Promotion of wood energy, which is renewable and may not raise the
level of C0
2in the atmosphere, could have long term value.
Windthrown Timber in December 1999 (million m3) (')
Removals in 1999 (million m3)
Windthrown timber of removals in 1999
(%)
EU-15 178.7 264.2 68
Β minor
4.4
-DK 3.7 1.5 242
D 30 40 75
E minor
14.9
-F 139.6
43.3 322
L minor
0.3
-A 0.4 14.1
3
S 5 58.7
9
CH 12.1
4 303 (')Source: UN-ECE Timber Committee, June 2000 (http://www.unece.org/trade/timber)
HZ
'Δ
[image:7.595.138.561.64.434.2]Further information:
> Reference publications
Title Forestry Statistics 19951998
Catalogue No KS27006133AC Price EUR20.50
> Databases
New Cronos, Theme 5, Forest
To obtain information or to order publications, databases and special sets of data, please contact the Data Shop network:
B E L G I Q U E J B E L G I Ë
Euroslat Data Shop Bruxelles/Brussel Pianista! Belgique 124 Rue du Commerce Handelsstraat 124
B1000 BRUXELLES / BRUSSEL
Tel. (32-2) 234 67 50
Fax (322) 234 67 51 EMail: [email protected]
D A N M A R K D E U T S C H L A N D E S P A N A F R A N C E I T A L I A R o m a
DANMARKS STATISTIK Bibliotek og Information Eurostat Data Shop Sejrogade 11 DK2100 KØBENHAVN O Tel. (4539)17 3030 Fax (4539) 17 30 03 EMail: [email protected]
STATISTISCHES BUNDESAMT Eurostat Data Shop Berlin OttoBraunStraße 7072 D10178 BERLIN Tel. (4930) 23 24 64 27/28 Fax (4930) 23 24 64 30 EMail:
datashop@statistikbund.de
INE Eurostat Data Shop Paseo de la Castellana, 163 Oficina 009
Entrada por Estébanez Calderón E28046 MADRID Tel. (3491) 583 91 67 Fax (3491) 579 71 20 EMail: [email protected]
INSEE Info Service Eurostat Data Shop 195. rue de Bercy Tour Gamma A F755B2 PARIS CEDEX 12 Tel. (331)53 17 88 44 Fax (331) 53 17 88 22 EMail: [email protected]
ISTAT
Centro di Informazione Statistica Sede di Roma, Eurostat Data Shop ViaCesareBalbo.11a IO0184 ROMA Tel. (3906) 46 73 31 02/06 Fax (3906) 46 73 31 01/07 EMail: [email protected]
I T A L I A M i l a n o LUXEMBOURG NEDERLAND NORGE PORTUGAL S C H W E I Z y S U I S S E / S V I Z Z E R A
ISTAT
Ufficio Regionale per la Lombardia Eurostat Data Shop
Via Fieno 3 120123 MILANO Tel. (3902) 8061 32460 Fax (3902) B061 32304 Email: [email protected]
Eurostat Data Shop Luxembourg BP453
L2014 LUXEMBOURG 4. rue Α. Wecker L2721 LUXEMBOURG Tel.(352)43 35 22 51 Fax (352) 43 35 22 221 EMail: [email protected]. lu
STATISTICS NETHERLANDS Eurostat Data ShopVoorburg po 00x4000
2270 JM VOORBURG Nederland Tel. (3170)337 49 00 Fax (3170) 337 59 84 EMail: [email protected]
Statistics Norway Library and Information Centre Eurostat Data Shop Kongens gale 6 P. b. 8131, dep. Ν0033 OSLO Tel. (4722) 86 46 43 Fax (4722) 86 45 04 EMail: [email protected]
Eurostat Data Shop Lisboa INE/Serviço de Difusão Av. António José de Almeida. 2 P1000043 LISBOA Tel. (35121)842 6100 Fax (35121) 842 63 64 EMail: [email protected]
Statistisches Amt des Kantons Zürich, Eurostat Data Shop Bleicherweg 5
CH8090 Zürich Tel. (411) 225 12 12 Fax (411) 225 12 99 EMail: [email protected] Internetadresse: http://www.zh.ch/statistik
S U O M I / F I N L A N D S V E R I G E U N I T E D K I N G D O M U N I T E D K I N G D O M U N I T E D S T A T E S O F A M E R I C A
Eurostat Data Shop Helsinki Tilastokirjasto
Postiosoite: PL 2B
Käyntiosoite: Tyõpajakatu 13 Β 2 krs FIN00022 Tilastokeskus Tel. (3589)17 34 22 21 Fax (3589) 17 34 22 79
Sposli dalashop tilaslokesku3@ttlastokeskijs li Inlemeladresse
Mlpy/www tilastokeskus fiUAk/dalashop himl
STATISTICS SWEDEN Information service Eurostat Data Shop Karlavägen 100 Box 24 300 S104 51 STOCKHOLM Tel. (468)50 69 4801 Fax (468) 50 69 48 99 EMail: [email protected] URL: http://www.scb.se/info/datashop/ eudatashop.asp
Eurostat Data Shop Enquiries & advice and publications
Office for National Statistics Customers & Electronic Services Unit 1 Drummond Gale B1/05 UKLONDON SW1V2QQ Tel. (44207)533 5676 Fax (441633) 812 762 EMail [email protected]
Eurostat Data Shop Electronic Data Extractions, Enquiries & advice R.CADE Unit 1L Mountjoy Research Centre University of Durham UK DURHAM DH13SW Tel: (44191) 374 7350 Fax: (44191) 384 4971 EMail: rcadeig? dur ac.uk URL: http://wwwrcade.dur.ac.uk
HAVER ANALYTICS Eurostat Data Shop 60 East 42nd Street Suite 3310
USANEW YORK. NY 10165 Tel. (1212) 986 93 00 Fax (1212) 986 69 81 EMail: [email protected]
Media Support Eurostat (for professional journalists only).
Bech Building Office A3/48 · L2920 Luxembourg · Tel. (352) 4301 33408 ; Fax (352) 4301 32649 · email: euroslal[email protected]
For information on methodology
Yves Zanatta, Eurostat/F1, L2920 Luxembourg, Tel. (352) 4301 33405, Fax (352) 4301 3 7 3 1 7 , Email: [email protected] Eero Mikkola, Eurostat/F1, L2920 Luxembourg, Tel. (352) 4301 37313, Fax (352) 4301 37317, Email: [email protected] ORIGINAL: English
Please visit our web site at www.europa.eu.int/comm/eurostat/ for further information!
A list of worldwide sales outlets is available at the Office for Official Publications of the European Communities.
2 rue Mercier L2985 Luxembourg Tel. (352) 2929 42118 Fax (352) 2929 42709 Internet Address htlpy'europ.eu.int'ir.'qenerat'sad.hlm email: into into @cec.eu.ini
BELGIQUE/BELGIÉ DANMARK DEUTSCHLAND GREECE/ELLADA ESPANA FRANCE IRELAND ITALIA LUXEMBOURG NEDERLAND ÖSTERREICH PORTUGAL SUOMI/FINLAND SVERIGE UNITED KINGDOM ISLAND NORGE SCHWEIZ/SUISSE/SVIZZERA BALGARIJA CESKÁ REPUBLIKA CYPRUS EESTI HRVATSKA MAGYARORSZÂG MALTA POLSKA ROMANIA RUSSIA SLOVAKIA SLOVENIA TÜRKIYE AUSTRALIA CANADA EGYPT INDIA ISRAEL JAPAN MALAYSIA PHILIPPINES SOUTH KOREA THAILAND UNITED STATES OF AMERICA
Order form
-X
I would like to subscribe to Statistics in focus (from 1.1.2000 to 31.12.2000): (for the Data Shop and sales office addresses see above)
□ Formula 1: All 9 themes (approximately 140 issues) □ Paper: EUR 360
□ PDF: EUR 264
Π Paper + PDF: EUR 432
Language required: □ DE LTP EN Π FR □ Formula 2: One or more of the following seven themes:
□ Theme 1 'General statistics'
□ Paper: EUR 42 Π PDF: EUR 30 □ Combined: EUR 54 □ Theme 2 'Economy and finance'
□ Theme 3 'Population and social conditions' □ Theme 4 'Industry, trade and services
Π Theme 5 'Agriculture and fisheries' □ Theme 6 'External trade'
Π Theme 8 'Environment and energy
□ Paper: EUR 84 Π PDF: EUR 60 Π Combined: EUR 114 Language required: Π DE Π EN Π FR
Please send me a free copy of 'Eurostat MiniGuide' (catalogue containing a selection of Eurostat products and services) Language required: D DE Π EN □ FR
I would like a free subscription to 'Statistical References', the information letter on Eurostat products and services
Language required: □ DE □ EN Π FR
□ Ms
Π Mr Π Mrs
(Please use block capitals)
Surname: Company: Function: Address: Post code: Country: Tel.: Email: Forename: Department: Town:
Fax:
Payment on receipt of invoice, preferably by: □ Bank transfer
□ Visa □ Eurocard
Card No: Expires on:
Please confirm your ¡ntraCommunity VAT number:
If no number is entered, VAT will be automatically applied. Subsequent reimbursement will not be possible.