Evaluating Web Search Result Summaries
Shao Fen Liang, Siobhan Devlin and John Tait
The University of Sunderland School of Computing and Technology Sunderland SR6 0DD, UK,
{ShaoFen.Liang, Siobhan.Devlin, John.Tait}@sunderland.ac.uk
Abstract. The aim of our research is to produce and assess short summaries to aid users’ relevance judgements, for example for a search engine result page. In this paper we present our new metric for measuring summary quality based on representativeness and judgeability, and compare the summary quality of our system to that of Google. We discuss the basis for constructing our evaluation methodology in contrast to previous relevant open evaluations, arguing that the elements which make up an evaluation methodology: the tasks, data and metrics, are interdependent and the way in which they are combined is critical to the effectiveness of the methodology. The paper discusses the relationship between these three factors as implemented in our own work, as well as in SUMMAC/MUC/DUC.
1 Introduction
Interest in the difficult topic of evaluation of automatic summarisation has been long standing [3]. The difficulties exist because evaluation procedures may depend on many variables such as intended purpose of the summaries, maximum acceptable length, type of texts being summarised and objective of the evaluation: in other words the data, task and metrics under consideration. Any changes in these variables can affect the outcome of the evaluation.
In this research, we have constructed a new methodology for evaluating web search result summaries. We consider that the manner of construction affects the whole evaluation process because of the interdependence of data, task and metrics. The metrics we employ are representativeness and judgeability, and we combine these measures to arrive at a third metric: summary quality. The related work of Berger and Mittal [2] states that query relevant summaries should include fidelity and relevance. It is important to note, however, that while our notion of representativeness equates to fidelity, we do not measure relevance but rather the user’s ability to judge relevance or irrelevance.
turn can be the subject of intrinsic and extrinsic evaluation [12]. In the case of our system, our representativeness score provides an intrinsic measurement of a summary’s fidelity to an original source document, while the users’ ability to judge relevance provides an extrinsic view of the system’s fitness for purpose. Together these two factors determine our overarching extrinsic evaluation of the system’s quality.
As it has proven especially difficult to find system based metrics for summarisation which genuinely reflect users’ perceptions of search engine effectiveness, we decided to incorporate human judgement into our evaluation methodology and used Google to generate comparative baseline summaries. The paper examines how this decision affected the subsequent choice of data and metrics.
2 Relation to Earlier Work
The inter-relationship of the three factors pertinent to evaluation methodology construction: data, task and metrics, is key to our work and has also been apparent in recent related literature.
Of the early literature on automatic summarisation evaluation, the 1991 Message Understanding Conference (MUC-3) is important for its inclusion of evaluation methodology. The MUC-3 task was to extract data about terrorist incidents from newswire articles. These articles were analysed to create a standard template, which contained 18 slots for participant systems to fill in. Answer keys were generated by humans for scoring purposes [4]. Finally, recall, precision, overgeneration and fallout were used as evaluation metrics [5].
In 1998, the U.S. government completed the first large-scale, developer-independent evaluation of automatic text summarisation systems: TIPSTER SUMMAC [13]. Three tasks were set in SUMMAC: 1. An ad hoc task to summarise a document as a topic description in for subjects to make relevance judgements; 2. A categorisation task: could subjects correctly categorise texts on the basis of the summary; 3. A question answering task which measured whether the summaries contained the answers to questions. News stories from newspaper sources were selected as data. The evaluation metrics of task 1 and 2 were based on precision, recall and Fscore. Task 3 was measured according to Answer Recall Average [9].
The Document Understanding Conference (DUC)1 originated in 2001 and focuses on automatic summarisation. In 2004, the DUC competition had five tasks: 1. Very short single document summaries; 2. Short multi-document summaries; 3. Very short cross-lingual single-document summaries; 4. Short cross-lingual multi-document summaries, and 5. Short summaries focused by questions. Data used in Tasks 1 and 2 was English Newswire, in 3 and 4 Arabic document clusters and in 5 TREC English document clusters. These five tasks were evaluated using the ROUGE metric [8].
Most recent studies have focussed on news articles, perhaps driven by the available test data. MUC-3 restricted the data to terrorist stories from nine countries. The
narrow range of documents allowed standard summary templates to be used, and the recall and precision metrics to be used to measure the match between system generated summaries and a human produced gold standard answer keys. SUMMAC, while still dealing only with news stories, dealt with more genres than MUC-3, making a template approach infeasible. Consequently using answer keys as the method of evaluation was not possible. The change in data collection led to SUMMAC setting different summarisation tasks and evaluation metrics. This varied approach was continued in DUC 2004 and DUC 2005.
In addition to the theoretical concerns behind this experimental methodology, namely the consideration of intrinsic and extrinsic motivation, we also took into account practical issues, so that rather than limiting the data to domain or genre independent data as did SUMMAC/MUC/DUC, we chose to use unrestricted English web pages. In this way we avoided the artificiality of the former tasks as well as word overlap issues. Of course the problem with using human based evaluations is that they are expensive in terms of time and sometimes in terms of the requirement for human expertise also. But while evaluations such as SUMMAC/MUC/DUC employ human expertise for producing the reference summaries, our methodology does not incur such an outlay as we simply require the human user to make a judgement.
3 Evaluation Method
The evaluation methodology was developed as part of a project to identify ways of improving internet search engine effectiveness from a searcher’s point of view, and in particular to improve their ability to judge the relevance of pages by more effective presentation of search results, namely the presented page summaries. Our discussion focuses on the evaluation of our new summarisation algorithm, called Query Terms Order (QTO) [7], but the conclusions are generalisable.
We wished to answer two initial questions from our experimental evaluation: 1. How well do our summaries represent their corresponding page contents (Representativeness)? 2. To what extent do the summaries help users judge the relevance of the original web page (Judgeability)? Having answered these questions we wished to determine a third aspect of the summaries: the Quality.
3.1 Data
The data for the task in hand was summaries of English language web documents. Summary length was set at a standardised 160 characters as this number is an average length derived from 1,000 Google returned summaries. We assume summary length is related to speed of relevance judgement but we are not investigating that here. We decided to work with TREC queries as they have standard descriptions of what constitutes a relevant page, which we hoped would help improve the constancy of inter subject relevance judgements [14]. Twelve TREC92 web track queries were
selected and numbered Q1 to Q12. We arrived at this number because should the number be too small then we may not be able to get a significant result, while too large a figure might affect the quality of the test result. Twelve was deemed manageable in terms of how much a user could process without becoming tired of the tasks. The actual queries chosen were those from which both QTO and Google could produce useful summary data without producing error pages. Both Google and the QTO system produced 10 summaries from each of the twelve queries.
3.2 Task
Having produced single short summaries for each page in the result set, our task was to evaluate them using the following criteria: the degree to which the summary represented its original page (Representativeness), and the degree to which a user is able to judge a summary relevant to the input query (Judgeability). Furthermore, we wished to derive a measure of Summary Quality by averaging Representativeness and Judgeability. We designed a user experiment to gather this data, and this is discussed below.
Subjects. To do a blind test between the baseline (ie. Google) and QTO systems, we required two groups of people, five in each, who fulfilled the following requirements. They should be:
− mature;
− native English speakers in order to reduce the difficulty of understanding summaries as much as possible;
− regular search engine users so that they all had an equal familiarity with search engine results;
− in a close range of English language proficiency (i.e. PhD students in a university computing school).
The sex of the participants was not considered relevant.
Test Sheets. The test was paper based in order to avoid possible confounding effects from the computer user interface. Two test sheets were required for the following tests:
− Representativeness
− Judgeability
Ten summaries were printed on a single sheet, and each of them was followed by three check boxes denoting Relevant, Irrelevant and Unknown for the subject’s judgement. On the top of the sheet the related query and its narrative from TREC was printed. Subjects were asked to read each summary and check the related query then select a judgement of Relevant, Irrelevant or Unknown on the summary judgeability test sheets.
Test Procedure. The whole test was performed in four days: days 1 and 2 forming cycle 1 for Q1 to Q6, and days 3 and 4 forming cycle 2 for Q7 to Q12. Ten subjects were split equally into groups A and B. The Representativeness task was done in the first day, and the Judgeability task in the second day of each cycle. On each day, group A took the Google system and group B took QTO in the morning and they swapped their systems in the afternoon (see Table 1).
Table 1. Task timetable
Morning Afternoon
Day 1 (Q1-Q6)
( Representativeness ) A -- Google B -- QTO B -- Google A -- QTO
Day 2 (Q1-Q6)
( Judgeability ) A -- Google B -- QTO B -- Google A -- QTO Day 3 (Q7-Q12)
( Representativeness ) A -- Google B -- QTO B -- Google A -- QTO Day 4 (Q7-Q12)
( Judgeability ) A -- Google B -- QTO B -- Google A -- QTO
Although each query in the Judgeability test took 5 minutes, the Representativeness test lasted 20 minutes. This was the justification for splitting the test into morning and afternoon sessions in order to ensure the maximum testing time did not exceed two hours. We used blind testing so that the subjects did not know which system they were assessing, and the test had no time restriction so that subjects did not feel pressured.
3.3 Metrics
Representativeness Score. The formula (1) is used to calculate the summary representativeness score of each query and focuses on finding each subject’s reaction to the summaries. The consistency of a subject while they are making the judgements is difficult to determine [6]. Therefore the variable of consistency is not taken into account in the formula.
R
=S
n
:n
n
)
/
5
(
1
∑
0
<
R
≤
1
.(1)
Where
R
represents the mean value among subjects’ summary representativeness scores and is normalised to between 0 and 1, Sn represents each summary’s representativeness score determined by a subject, n represents the number of retrieved links and the number 5 is used to normalise the result to between 0 to 1 because each representativeness score can be marked from 1 to 5.Judgeability Score. The summary judgeability score is calculated according to the number of Unknown summaries. The more Unknown summaries the lower the summary judgeability score is.
J
=Tj
Uj
Tj
−
:
0
≤
J
≤
1
.(2)
Where represents each subject’s judgeability score, and the value of J is between 0 and 1, Tj represents the total number of judgements (including Relevant, Irrelevant and Unknown) and Uj represents the number of Unknown judgements.
J
Summary Quality Score. High representativeness or judgeability alone will not always mean positive searcher perception. We need to balance both scores from representativeness and judgeability in order to arrive a fair summary quality score. This is also the reason for setting both R and J to between 0 and 1. Therefore, the summary’s quality-SQ is averaged as formula (3) by the sum of formula (1) and formula (2).
SQ
=(R
+J
)/2.
(3)4 Results
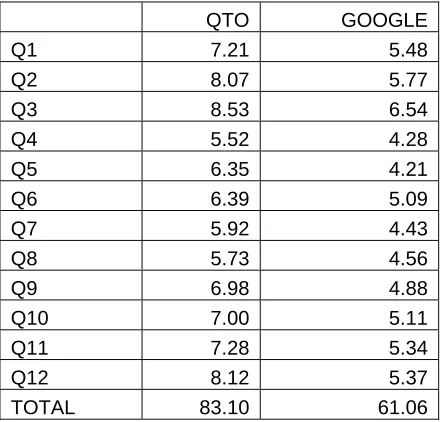
Table 2. Representativeness task results
QTO GOOGLE
Q1 7.21 5.48
Q2 8.07 5.77
Q3 8.53 6.54
Q4 5.52 4.28
Q5 6.35 4.21
Q6 6.39 5.09
Q7 5.92 4.43
Q8 5.73 4.56
Q9 6.98 4.88
Q10 7.00 5.11
Q11 7.28 5.34
Q12 8.12 5.37
[image:7.595.132.463.409.651.2]TOTAL 83.10 61.06
Table 3. Subjects’ judgements of judgeability task
QTO GOOGLE
R IR UN R IR UN
Q1 43 32 25 19 36 45
Q2 44 41 15 18 44 36
Q3 64 23 13 35 23 42
Q4 39 47 14 29 25 46
Q5 36 40 24 24 24 52
Q6 48 35 17 29 30 41
Q7 50 27 23 22 23 55
Q8 43 45 12 26 30 44
Q9 50 35 15 29 28 43
Q10 59 28 13 26 36 38
Q11 72 22 8 29 25 46
Q12 69 21 10 32 33 35
TOTAL 617 396 189 318 357 523
as 1. For example, the 100 judgements of Query1 from the 10 subjects are 43 of Relevant, 32 of Irrelevant and 25 of Unknown for the QTO system. QTO produced a total of 617, 396 and 189, Google produced 318, 357 and 523 Relevant, Irrelevant and Unknown judgements respectively.
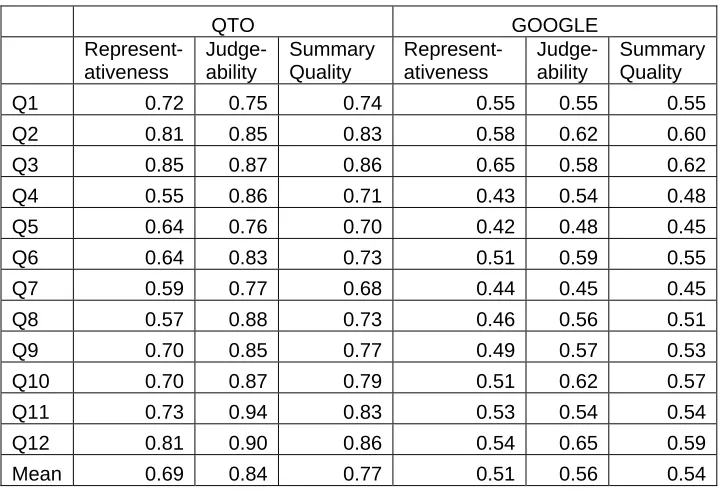
[image:8.595.124.488.311.558.2]Table 4 shows the summary quality results of the QTO and Google systems, where R represents the Representativeness score, J represents the Judgeability score and SQ represents the Summary Quality score. We used the data from Table 2 to convert the values in columns J by applying Formula (2). The values in R are also converted by using data in Table 1 and divided by 10 subjects. Finally, the values in SQ columns are derived from Formula (3). Both QTO’s Representativeness and Judgeability scores are higher than Google’s, therefore the Summary Quality score of the QTO system is demonstrably higher than Google’s.
Table 4. Both systems’ summary quality results.
QTO GOOGLE
Represent-ativeness
Judge-ability
Summary Quality
Represent-ativeness
Judge-ability
Summary Quality
Q1 0.72 0.75 0.74 0.55 0.55 0.55
Q2 0.81 0.85 0.83 0.58 0.62 0.60
Q3 0.85 0.87 0.86 0.65 0.58 0.62
Q4 0.55 0.86 0.71 0.43 0.54 0.48
Q5 0.64 0.76 0.70 0.42 0.48 0.45
Q6 0.64 0.83 0.73 0.51 0.59 0.55
Q7 0.59 0.77 0.68 0.44 0.45 0.45
Q8 0.57 0.88 0.73 0.46 0.56 0.51
Q9 0.70 0.85 0.77 0.49 0.57 0.53
Q10 0.70 0.87 0.79 0.51 0.62 0.57
Q11 0.73 0.94 0.83 0.53 0.54 0.54
Q12 0.81 0.90 0.86 0.54 0.65 0.59
Mean 0.69 0.84 0.77 0.51 0.56 0.54
5 Discussion
Representativeness Result
0.00 1.00 2.00 3.00 4.00 5.00 6.00 7.00 8.00 9.00
Q1 Q2 Q3 Q4 Q5 Q6 Q7 Q8 Q9 Q10 Q11 Q12
Queries
Sc
o
re
s
[image:9.595.165.431.150.348.2]QTO GOOGLE
Fig. 1. Representativeness result
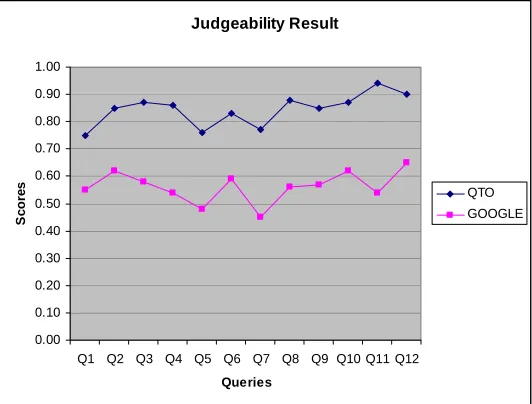
Judgeability Result
0.00 0.10 0.20 0.30 0.40 0.50 0.60 0.70 0.80 0.90 1.00
Q1 Q2 Q3 Q4 Q5 Q6 Q7 Q8 Q9 Q10 Q11 Q12
Queries
Sc
o
re
s
QTO GOOGLE
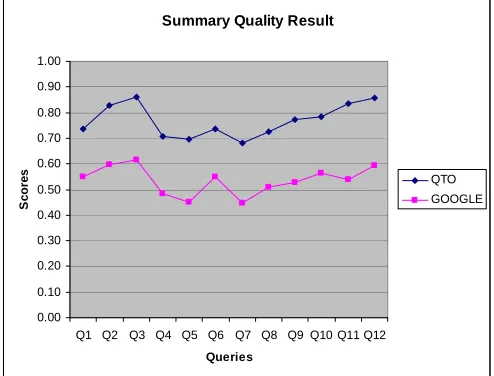
[image:9.595.165.431.417.619.2]Figure 3 shows QTO and Google’s summary quality. Evidently QTO produced approximately 20% better summary quality than Google in our experiment. To determine if the result is significant we used a paired-samples t-test analysis [11] to compare representativeness, judgeability and summary quality respectively and obtained significant results in each case (df=11 p<0.05). We also determined that the correlation of the Representativeness results is .894, of the Judgeability results is .567, and of the Summary Quality is .880, therefore they are significant. We suggest that this high correlation indicates a predictability in QTO’s summary quality performance over that of Google.
Summary Quality Result
0.00 0.10 0.20 0.30 0.40 0.50 0.60 0.70 0.80 0.90 1.00
Q1 Q2 Q3 Q4 Q5 Q6 Q7 Q8 Q9 Q10 Q11 Q12
Queries
Sc
o
re
s
QTO GOOGLE
Fig. 3. Summary quality results
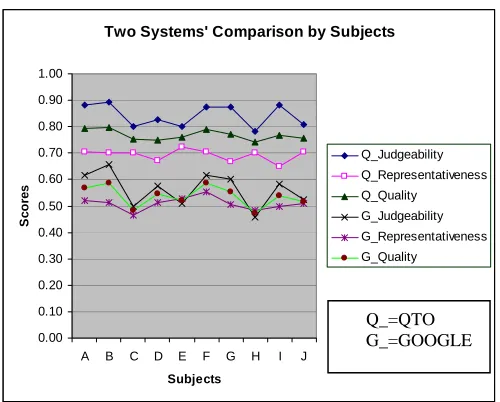
Two Systems' Comparison by Subjects
0.00 0.10 0.20 0.30 0.40 0.50 0.60 0.70 0.80 0.90 1.00
A B C D E F G H I J
Subjects
Sc
o
re
s
Q_Judgeability Q_Representativeness Q_Quality
G_Judgeability G_Representativeness G_Quality
[image:11.595.173.423.145.346.2]Q_=QTO G_=GOOGLE
Fig. 4. Summary quality comparison by subjects
6 Conclusion
Automatic Summarisation evaluation is problematic due to the variety of factors that can be considered in any methodology and the interplay between these factors. In this paper we have discussed the factors that we believe influence the construction of an automatic summarisation evaluation methodology and referred to three salient works in the literature: namely SUMMAC, MUC and DUC. We have also presented our own evaluation methodology, which considers our end purpose i.e. why we are interested in producing summaries, the data we chose to use in response to the task, and the metric we have developed for evaluation purposes.
The experimental set up is the key point of this paper. Our evaluation methodology is not only task oriented but is also affected by end user considerations, namely: what is the system’s role and who is it aimed at? The exponential rise in the numbers of people spending increasing amounts of time searching for information means that the problem ceases to be one just of the system efficiency and instead becomes one of enhancing the user experience. Therefore, real users’ involvement is essential to ensure our summariser will help to reduce the people’s search time. Also, by using real users in the evaluation procedure makes the test more realistic. Although we realise that encapsulating human judgement is expensive and time consuming, users’ perception cannot be ignored.
methodology can be constructed is variable, it is not possible to ignore the impact that task, data and metric have on each other.
References
1. Afantenos, S., Karkaletsis, V. and Stamatopoulos, P.: Summarization from medical documents: a survey. Artificial Intelligence in Medicine, 33, 2, February (2005), 157-177. 2. Berger, A. and Mittal, V.O.: Query-Relevant summarisation using FAQs. ACL (2000)
294-301.
3. Borko, H. and Bernier, C.L.: Abstracting concepts and methods. Academic Press, San Diego, Ca., USA (1975)
4. Chinchor, N. Hirschman, L. and Lewis, D.D.: Evaluating message understanding systems: An analysis of the third message understanding conference. Association for Computation Linguistics, 19, 3, (1993) 409-449.
5. Chinchor, N.: MUC-3 Evaluation metrics. Proceedings of third message understanding conference (1991) 17-24.
6. Harman, D. and Over P.: The effects of human variation in DUC summarisation evaluation. Proceedings of the ACL-04 Workshop in Text Summarization Branches Out (Barcelona, Spain, July, (2004) 10-17.
7. Liang, S.F., Devlin, S. and Tait, J.: Poster: Using query term order for result summarisation. SIGIR’05, Brazil (2005) 629-630.
8. Lin, C.Y.: ROUGE: a Package for Automatic Evaluation of Summaries. Proceedings of the Workshop on Text Summarization Branches Out, Barcelona, Spain, (2004) 25-26, July.
9. Mani, I., Firmin, T. and Sundheim, B.: The TIPSTER SUMMAC text summarisation evaluation. Proceedings of the ninth conference on European chapter of the Association ofr Computational Linguistics, Bergen, Norway (1999) 77-85.
10.Mani, I.: Automatic Summarization. John Benjamins, Amsterdam (2001).
11.Pagano, R.R.: Understanding statistics in the behavioural sciences. Wadsworth/Thomson Learning, USA (2001).
12.Sparck Jones, C. and Galliers, J.R.: Evaluating natural language processing systems: an analysis and review. Springer, New York (1996).
13.Tipster text phase III 18-month workshop notes, (1998), May, (1998) Fairfax, VA. 14.Voorhees, E.M.: Variations in Relevance Judgements and the Measurement of Retrieval