Studies on interactions of milk proteins with flavour compounds : a thesis presented in partial fulfilment of the requirements for the degree of Doctor of Philosophy in Food Technology at Massey University, Palmerston North, New Zealand
230
0
0
Full text
(2) Studies on Interactions of Milk Proteins with Flavour Compounds. A thesis presented in partial fulfilment of the requirements for the degree of. Doctor of Philosophy in Food Technology at Massey University, Palmerston North, New Zealand.. Janina Kuhn 2007. Massey University. RIDDEI CENiRE , . . .ADVANCING KNOWLEDGE IN FOODS AND BIOLOGICALS.
(3) Abstract. ABSTRACT Milk proteins are known to bind volatile flavour compounds to varying extents, depending on the nature of the protein and flavour compound. Processing conditions, such as temperature and pH, are also known to have an influence on the interactions between milk proteins and flavour compounds. These interactions cause a great challenge for flavour scientists because they influence the perceived aroma profile of food products significantly, in particular in low fat food products. The objectives of this research were to develop a headspace solid-phase microextraction ( SPME) method followed by gas chromatography with flame ionisation detection (GC-FID) for the investigation of protein-flavour interactions, and to determine binding parameters of the hydrophobic flavour compound, 2-nonanone, to individual milk proteins - namely, �-lactoglobulin (p- Ig), a-lactalbumin (a- la), bovine serum albumin (BSA), asl -casein, and �-casein -, whey protein isolate (WPI), and sodium caseinate. Secondly, it was the aim to compare the binding of the structurally similar flavour compounds - 2-nonanone, I -nonanal, and trans-2-nonenal - to WPI in aqueous solution, and to investigate the effect of heat and high pressure treatment, and p H on the extent of protein-flavour binding. The final objective was to investigate the in vivo release of the reversibly bound flavour compound, 2-nonanone, from WPI and sodium caseinate using proton-transfer-reaction mass spectrometry (PTR-MS), and to understand the effect of viscosity on flavour release in v ivo . The binding of the model flavour compound 2-nonanone to individual milk proteins, WPI, and sodium caseinate in aqueous so lutions was investigated, using headspace SPME fo llowed by GC-FID. The 2-nonanone binding capacities decreased in the order: BSA > �-Ig > a- la > asl -casein > �-casein, and the binding to WPI was stronger than the binding to sodium caseinate. All proteins appeared to have one binding site for 2-nonanone, except for BSA which possessed two classes of binding sites. The influence of heat treatment, high pressure processing and pH of the protein so lutions on the binding of 2-nonanone, I -nonanal, and trans-2-nonenal to WPI was determined. The binding of these compounds to WPI decreased in the order: trans-2-nonenal > I -nonanal > 2-nonanone. The binding of 2-nonanone appears to involve hydrophobic interactions only, whereas the aldehydes, in particular trans-2-nonenal, also react through covalent binding. Upon both heat and high pressure denaturation, the binding of 2-nonanone to WPI decreased, the binding of I -nonanal remained unchanged, while the binding of trans-2-nonenal.
(4) 11. Abstract. increased. The binding affinity of the flavour compounds and WP I increased with increasing pH, which is likely to result from pH dependent conformational c hanges of whey proteins. The in vivo flavour (2-nonanone) release from solutions of WPI and sodium caseinate was investigated. using. proton-transfer-reaction. mass. spectrometry.. During. consumption,. 2-nonanone was partly released from WP I , whereas there was no significant release from sodium caseinate. Even after swallowing of the samples, a substantial amount of flavour was detected in the breath, suggesting that the milk proteins interact with the mucosa in the mouth and throat, resulting in a further release o f flavour from mucosa-bound proteins. An increase in viscosity of the protein so lutions by the addition of carboxymethylcellulose enhanced the release of 2-nonanone from WPI , and resulted in 2-nonanone release from sodium caseinate. This may be due to a thicker coating of the mucosa with the sample solution after swallowing due to the higher viscosity, resulting in additional release of protein-bound flavour. These findings contribute to the knowledge of the interactions that occur between flavour compounds and proteins, which is required to improve food flavouring and to make protein based foods, e.g., low-fat dairy products, sensorily more acceptable to the consumer. The results also emphasize a careful cho ice of food processing conditions, such as temperature, high pressure or pH to obtain a desirable flavour profile..
(5) Acknowledgements. III. ACKNOWLEDGEMENTS Firstly, I wish to thank my supervisors, Professor Harjinder Singh and Dr Therese Considine. This thesis would not appear in its present form without their expert assistance, support, ideas, and criticism. I would also like to thank Massey University for the award of the Doctoral Scho larship during three years of my research, and the Riddet Centre for additional funding and several travel grants. A big thank you to Dr Conor Delahunty for very helpful advice and discussions towards and during my flavour release study at the University of Otago. I would also like to thank the Sensory Sc ience Department at the University of Otago for the great working atmosphere. Special thanks to Sam Heenan for his expertise in PTR-MS. I am very grateful to Fonterra Co-operative Group Ltd. for temporarily providing a GC-FID to carry out my research, and to Dr Owen Mills and Andrew Broome for their advice and assistance on GC analysis. I also wish to thank Dr Xiang-Qian (Peter) Zhu for his assistance during the initial stages of my research and for several valuable discussions, Dr Skelte Anema (Fonterra) for the high pressure treatments, and for encouraging me to do a PhD in the fIrst place, Dr John Flanagan for help with the purifIcation of case ins, and Michelle Tamehana and Steve Glasgow for being great lab managers. Amino ac id analyses were carried out by Leiza Turnbull. Thank you also to the following people who have been supportive as friends, colleagues, or otherwise: Linda and Brian, Nigel, Sarah, Janiene, Thanuja, Jiahong, Thurid, Tamara, Mischa, and Ngaio . Final ly, and most importantly, my love and thanks to my partner, Leyton, who went with me through the successful but also discouraging times, and always helped me to keep thinking positive, my parents, Carl-Ludwig and Irmgard, and my brother, Alexander, who have been encouraging, supportive and loving not only during my academic studies. To them I dedicate this thesis..
(6) Table o f Contents. IV. TABLE OF CONTENTS ABSTRACT. .................................................................................................................. 1. ACKNOWLEDGEMENTS ......................................................................................... III. TABLE OF CONTENTS ............................................................................................ IV. LIST OF FIGURES ..................................................................................................... X. LIST OF TABLES................................................................................................... XVII. LIST OF ABBREVIATIONS ....................................................................................XIX. CHAPTER ONE: INTRODUCTION. ................................................... CHAPTER TWO: LITERATURE REVIEW. 2. 1. Types of Interactions .. .. . .. 2.2. Flavou r Binding by Proteins .. ... ... .. .... .. ............................. .. .......... .. .. .. . ... . . .. .. ....................... .. ..... ... ......... .. .. ... ......... .. ... .. ... .. ... 1. .. .... 3. ................... .. ...... .. .. ... ..... .......................... ..... 3. .. ............ 4. .. ....... .. ........... ... ...... .. .. ...... .. ... .. .. .... Analysis of Flavour Binding by Proteins . . . . . . . . . . . . . . . . . . . . . . . . . . . . . . . . . . . . . . . . . . . . . . . . . . . . . . . . . . . . . 4. 2 .2. 1 2.2. 1 . 1. Static (Equilibrium) Methods . . . . . . . . . . . . . . . . . . . . . . . . . . . . . . . . . . . . . . . . . . . . . . . . . . . . . . . . . . . . . . . . . . . . . . . . . . 4. 2.2. 1 .2. Dynamic Methods . . . . . . . . . . . . . . . . . . . . . . . . . . . . . . . . . . . . . . . . . . . . . . . . . . . . . . . . . . . . . . . . . . . . . . . . . . . . . . . . . . . . . . . . . . . 7. 2.2. 1 .3. Spectroscopic Methods . . . . . . . . . . . . . . . . . . . . . . . . . . . . . . . . . . . . . . . . . . . . . . . . . . . . . . . . . . . . . . . . . . . . . . . . . . . . . . . . . . . 8. 2.2. 1 .4. Sensory Methods . . . . . . . . . . . . . . . . . . . . . . . . . . . . . . . . . . . . . . . . . . . . . . . . . . . . . . . . . . . . . . . . . . . . . . . . . . . . . . . . . . . . . . . . . . 9. 2.2. 1 . 5. Determination of Binding Parameters . . . . . . . . . . . . . . . . . . . . . . . . . . . . . . . . . . . . . . . . . . . . . . . . . . . . . . . . . . . . . 9. .. .. 2.2. 1 . 5. 1. Scatchard Plot . . . . . . . . . . . . . . . . . . . . . . . . . . . . . . . . . . . . . . . . . . . . . . . . . . . . . . . . . . . . . . . . . . . . . . . . . . . . . . . . . . . . . . . 1 0. 2.2. 1 . 5 . 2. Klotz Plot . . . . . . . . . . . . . . . . . . . . . . . . . . . . . . . . . . . . . . . . . . . . . . . . . . . . . . . . . . . . . . . . . . . . . . . . . . . . . . . . . . . . . . . . . . . . . . 1 0. 2.2. 1 .5.3. H ill P lot . . . . . . . . . . . . . . . . . . . . . . . . . . . . . . . . . . . . . . . . . . . . . . . . . . . . . . . . . . . .. 2 .2.2. .. . .. . .. . . . . . . .. . . ................. 1 1 . . .. . .. Flavour Compounds . . . . . . . . . . . . . . . . . . . . . . . . . . . . . . . . . . . . . . . . . . . . . . . . . . . . . . . . . . . . . . . . . . . . . . . . . . . . . . . . . . . .. . . . . . 1 2. 2.2.2. 1. Aldehydes . . . . . . . . . . . . . . . . . . . . . . . . . . . . . . . . . . . . . . . . . . . . . . . . . . . . . . . . . . . . . . . . . . . . . . . . . . . . . . . . . . . . . . . . . . . . . . . . . . . . . 1 2. 2.2.2.2. Ketones and Methyl Ketones . . . . . . . . . . . . . . . . . . . . . . . . . . . . . . . . . . . . . . . . . . . . . . . . . . . . . . . . . . . . . . . . . . . . . . . . 1 2. 2.2.2.3. Esters . . . . . . . . . . . . . . . . . . . . . . . . . . . . . . . . . . . . . . . . . . . . . . . . . . . . . . . . . . . . . . . . . . . . . . . . . . . . . . . . . . . . . . . . . . . . . . . . . . . . . . . . . . . . 1 3. 2.2.3 2.2. 3 . 1. Flavour B inding by Milk and Other Proteins . . . . . . . . . . . . . . . . . . . . . . . . . . . . . . . . . . . . . . . . . . . . . . . . . . . . 1 3 .. p-Lactoglobulin (P-lg) . . . . . . . . . . . . . . . . . . . . . . . . . . . . . . . . . . . . . . . . . . . . . . . . . . . . . . . . . . . . . . . . . . . . . . . . . . . . . . . . . . . 1 4.
(7) v. Table of Contents. 2.2.3.2. a-Lactalbumin (a-la). . . . . .. 18. 2.2.3.3. Bovine Serum Albumin (BSA). . . . . . . . . . . . . . . . . . . . . . . . . .. 18. 2.2.3.4. Whey Protein Products. . . . . . . . . . . . . . . . . . . . . . . . . . . . . . . . . . . . . . . . . . . . . . . . .. 20. 2 .2 .3. 5. Case ins. . . . . . . . . . . . . . . . . . . . . . . . . . . . . . . . . . . . . . . . . . . . . . . . . . . . . . . . . . . . . . . . . . . . . . . . . . . . . . . . . . . . . . . . . . . . . . . . . . . . . . . . . .. 20. 2.2.3.6. Comparison of Flavour Binding Capac ities of M ilk Proteins . . . . . . . . . . . . . . . . . . . . . . . 22. 2.2.3.7. Other Food Proteins. . . . . . . . . . . . . . . . . . . . . . .. . . .. ... .... . . . . . . . . . . . . . . . . .. . . . . . . . . . . . . . . . .. . . . . . . . . . . . . . . . . . . . . . . . . . . . . . . . . .. .. .. .. . . . . . . . . . . . . . . . . . . . . . . . . . . . . . . . . . . . .. . . . . . . . . . . . . . . . . . . .. .... .. . ,. . . . . . . . . . . .. .. . . . . . . . . . . . . . . . . . .. 2.2.3 . 7. 1. Soy Protein. 2.2.3.7.2. Fababean Protein. 2.2.3.7.3. Pea Protein. 2.2.3 .7.4. Egg Protein. 2.2.3.7.5. Fish Actomyosin. 2.2.3.7.6. Musc le, Bone and Skin Proteins. . . . . . . . . . . . . . . . . .. ... .. . . . . . . . . . . . . . . . . . . . . . . . . . . .. . . . . . . . . . . . . . . . .. . . .. . . . . . .. .. .. .. .. . . . . . . . . . . . . . . . . . . . . . . . . . . . . . . . . . . . . . . . . . . .. 24. . . . . . . . . . . . . . . . . . . . . . . . . . . . . . . . . . . . . . . . . . . . .. 24. . . . . . . . . . . . . . . . . . . . . . . . . . . . . . . . . . . . . . .. . . . . . . . . . . . . . . . . . . . . . . . . . . . . . . . . . . . . .. . . . . . . . . . . . . . . .. . . . . . . . . . .. .. . . . . . . . . .. .. . . . . . . . . . . . . . . . . .. . . . . . . . . . . . . . . . . . . . . . . . . . . . . . . . . . . . .. . . . . . . . . . . . . . . . . . . . . . . . . . . . . . . . . . . .. . . . . .. .. .. .. . . . . . . . . .. ... .. .. . . . . . .. ... . . . . . . . . . .. . . . . . . .. 25. . . . . . . . . . . . . . . . . . . . . . . . . . . .. 25. . . . . . . . . . . . . . . . . .. . . . . . . . . . . . . . . . . . . . . . . . . . .. . . . . . . . . . . . . . . . . . . . . . . . . . . . .. .. .. ... 25. . . . . . . . . . . . . . . . . . .. . . . . . . . .. .. . . . . . . . . .. .. . 26 .. . . . . . .. 26. Factors Influencing P rotein-Flavou r Binding .............................................. 26. 2.3. 2.3 . 1. Protein Concentration. 2.3.2. Heat Treatment. . . . . . . . . . . . . . . . .. . . . . . . . . . . . . . . . . .. .. ... . . . . . . . . . . . . . . . . . . . .. .. . . . . . . . . . . . . . . . . . . . . . . . . . .. . . . . . . . . . . . . . . . . . . . . . . . . . . . . . . . . . . . . . . . . . . . . . . . . . . . . . . . .. .. .. . . . . . . . . .. .. . . . . . . . . . . .. 26. .. . . . . .. 27. .. . . . . . . . . . . . . . . . .. 2 . 3 .2. 1. Below the Denaturation Temperature. . . . . . . . . . . . . . . . . . . . . . . . . . . . . . . . . . . . . . . . . . . . . . .. . . . . .. 27. 2.3 .2.2. Above the Denaturation Temperature. . . . . . . . . . . . . . . . . . . . . . . . . . . . . . . . . . . . . . . . . . . . . . . . . . . . . . . . . . . . .. 28. 2 . 3 .3. High Pressure Treatment. 2.3 .4. pH of the Medium. 2.3.5. Ionic Strength of the Medium. . . . . . . . . . . . . . . . . . . . . . . . . . . .. . . . . . . . . . . . . . . . .. .. .. . . . . . . .. ... .. . . . . . . .. . . . . . . . . . . . . . . . . . . . . . . . . . . . . . . . . . . .. . . . . . . . . . . . . . . . . . . . . . . . . . . . . . . . . . . . . . . . . . . . . . .. . . . . . . . . . . . . . . . . . . . .. .. .. .. . . . . . . . . .. . 30. . . . . . . . . . . . . . . . . . . . . . . . . . . . . .. . . . . . . . . . . . . . . . . . . . . . . . . . . .. ... . . . . . . . . . . . . . . . . . . . . . . . . .. 31 32. 2.4. Implications in t h e Development o f Protein Foods ....................................... 33. 2.5. Flavour Release from P roteins ...................................................................... 34. 2. 5 . 1. Flavour Release and Perception. 2.5.2. Analysis of Flavour Release from Proteins. 2 . 5 .2. 1. MS Breath Methods. 2 . 5 .2. 1 . 1. . . . . .. ... . . . . . . . . . . . . . . . . . . . . . . . . . . .. . . . . . . . . . . .. .. .. . . . . . . . . . . . . . . . . . . . . . . . . . . . . . . . . . . . . .. . . . . . . . . . . . . . . . . . . . . . . . . . . . . . . . . . . . . .. . . . . . . . . . . . . . . . . . . . . . . . . . . . . . . . . . . . . . . . . . . . . . . . . . . . . . . . . . . . . . . . . . . . . . . . . . . . . .. .. .. . . . . . .. . . . . . . . .. 34 34 35. Atmospheric pressure chemical ionisation mass spectrometry CAPCI-MS) .. , . . . . . . . . . . . . . . . . . . . . . . . . . . . . . . . . . . . . . . . . . . . . . . . . . . . . . . . . . . . . . . . . . . . . . . . . . . . . . . . . . . . 36. 2 . 5 .2. 1 .2. Proton-transfer-reaction mass spectrometry (PTR-MS). . . . . . . . . . . . . . . . . . . . .. .. . . . .. 36. 2.5 .2.2. Mouth S imulators . . . . . . . . . . . . . . . . . . . . . . . . . . . . . .. . . . . . . . . . . . . . . . . . . . . . . . . . . . . . . . . . . . . . . . . . . . . . . . . . . . . . . . . . . 40. 2 . 5 .2.3. Sensory Methods . . . . . . . . . . . . . . . . . . . . . . . . . . . . . . . . . . . . . . . . . . . . . . . . . . . . . . . . . . . . . . . . . . . . . . . . . . ... . . . . . . . . . . . . . 4 1. 2 . 5 .3. Flavour Release from L iquid, Protein-Containing Systems. 2.5.4. Flavour Release from Viscous, Protein-Containing Systems. . . . . . . . . . . . . . . . . . . . . . . . . . . . . . . .. . . . . . . . . . . . . . . . . . . . . . . . . . . . . .. 42 43.
(8) VI. Table o f Contents. 2.5.5 2.6. Factors Influencing F lavour Release In-Mouth . . . . . . . . . . . . . . . . . . . . . . . . . . . . . . . . . . . . . . . . . . . . . . . . . . 45 Concluding Remarks ..................................................................................... 46. CHAPTER THREE: BINDING OF 2-NONANONE AND MILK PROTEINS. 3. 1. Abstract. 3.2. Introduction. 3.3. M aterials and M ethods. . . ........... ........................................................................................................... .................................................................................................... .......... ......................................................................... 48. 48 48 50. 3.3. 1. 2-Nonanone . . . . . . . . . . . . . . . . . . . . . . . . . . . . . . . . . . . . . . . . . . . . . . . . . . . . . . . . . . . . . . .. . . . . . . . . ... . . . . . . . . . . . . . . . . . . . . . . . . . . . 5 0. 3 .3 .2. Milk Proteins . . . . . . . . . . . . . . . . . . . . . . . . . . . . . . . . . . . . . . . . . . . . . . . . ... . . . . . . . . . . . . . . . . . . . ... . . . . . . . . . . . . . . . . . . . ... . . . . . 5 1. 3 .3 . 3. Composition of WPI . . . . . . . . . .. . . . . . . . . . . . . . . . . . . . . . . . . . . . . . ... . . . . . . . . . . . . . . . . ... . . . . . . . . . . . . . . . . . . . . . . . . . . . 5 1. 3 .3 . 3 . 1. Determinat ion of Individual Whey Proteins by HPLC . .. . . ... . . . . . . . . . . . . . . . . . . . . . . . . . . . 5 1. 3 . 3 .3 . 2. Moisture Content . . . . . . . . . . . . . . . . . . . . . . . . . . . . . . . . . . . . . . ...... . . . . . . . . . . . . . . . . ... . . . . . . . . . . . . . . . . . . . ... . . . . . 5 1. 3 .3 .4. Preparation of Case ins . . . . . . . . . . . . . . . . . . . . . . . . . . . . . . . ...... . . . . . . . . . . . . . . . . . . . ... . . . . . . . . . . . . . . . . . . . . . . . . . . . 5 2. 3 . 3 .4. 1. Preparation of Sodium Caseinate . . . . . . . . . . . . . . . . . . . . . . . . . . . . . . . . . . . . . . . . . . . . . . . . . . . . . . . . . . . . . . . . . . . 52. 3 . 3 .4.2. Separation of Case ins by Ion Exchange Chromatography (lEC) . . . . . . . . . . . . . . . . . . . . 53. 3 . 3 .4.3. Polyacrylamide Gel Electrophoresis ( PAGE) . . . . . . . . . . . . . . . . . . .... . . . . . . . . .... . . . . . . . . . . . . . . 56. 3.3.5. U V Spectroscopy . . . . . ... . . . . . . . . . . . . . . . . . . . . . . . . . . . . . . . ... . . . . . . . . . . . . . . . . . . . . . . . . . . . . . . . . . . . . . . . . . . . . . . . . . . . . 5 9. 3.3.6. Preparation o f Protein-Flavour Solutions . . . . . . . . . . . . . . . . . . . . . . . . . . . ... . . . . . . . . . . . . . ...... . . . . . . ... 6 0. 3.3.7. Development of a Headspace S PME Method . . . . ... . . . . . . . . . . . . . . . . . . . . . . . . . . . . . . . . . . . . . . . . . . . . . 60. 3 . 3 .7. 1. S PME Equipment . . . . . . . . . . . . . . . . . . . . . . . . . . . . . . . . . . . . . . . . . . . . . . . . . . . . . . . . . . . . . . . . . . . . . . . . . . . . . . . . . ... . . . . . 6 1. 3 . 3 . 7.2. Fibre Selection and Determination of Extraction Time (tex) . . . . . . . . . . . . . . . . . . . ... . . . . . 6 1. 3 . 3 .7.3. Determination o f the Thermal Equilibration Time (teq) . . . . . . . . . . . . . . . . . . . . . . . . . . ... . . . . . 65. 3 . 3 .7.4. Solvent Selection . . . . . . . . . . . . . . . . . . . . . . . . . . . . . . . . . . . . . . . . . . . . . . . . . . . . . .. . . . ..... . ... . . . . . . . . . . . . . . ... . . . . . . 65. 3 . 3 .7.5. Sample Agitation during SPME Extraction ... . . . . . . . . . . . . . . . . . .... . . ... . . . . . ... . . . . . . . . . . . . . . 66. 3 .3 . 8. Gas Chromatography . . . . . . . . . . . . . . . . . . . . . . . . . . . . . . . . . . ... . . . . . . . . . . . . . . . . . . . . . . . . . . . . . . . . . . . . . . . . . . . ... . . . . . 66. 3 .3 . 9. Determination of B inding Parameters . . . . . . . . . . . . . . . . . . . . . . . . . . . . . . . . . . . . . . . . . . . . . . . . . . . . . . . ... . . . . . 67. 3.3 . 1 0. Statistical Analysis ..... . . . ... . . . . ... . . . . . . . . . . . . . . ... . . . . . . . . . . . . . . . . . . . . . . .... ... . . . ... . . . . . . . . ... . . ... . . . . . 67. 3.4. Results and Discussion .......... ......................................................................... 68. 3 .4. 1. Optimisation of the SPME Method ... . . . . . . . . . . . . . . . ... . . . . . . . . . . . . . . . . ... . . ... . ... . . . . . . . . . . ... ... . . 68. 3 . 4. 1 . 1. F ibre Selection and Determination of Extraction Time (tex). 3 .4. 1 .2. F ibre-Headspace Partition Coefficient (Kjh) . . . . . . . . . . . . . . . . . . . . . . . . . . . . . . . . . . . . . . . . . . . . . . . . . . . 72. 3 .4. 1 . 3. Thermal Equil ibration Time (teq) . . . . . . . . . . . . . . . . . . . . . ... . . . . . . . . . . . ... . . . . . . . . . . . .. . . . . .. . . . . . . . . . 75. ............ . . . ..... . . . . . . . . 68. ..
(9) Table of Contents. VII. 3 .4. l .4. So lvent Selection . . . . . . . . . . . . . . . . . . . . . . . . . . . . . . . . . . . . . . . . . . . . . . . . . . . . . . . . . . . . . . . . . . . . . . . . . . . . . . . . . . . . . . . . . . 76. 3 .4. l . 5. Sample Agitation during S PME Extraction . . . . . . . . . . . . . . . . . . . . . . . . . . . . . . . . . . . . . . . . . . . . . . . . . . . 77. 3 .4. l . 6. F inal SPME Method for Measuring Flavour Binding on Proteins . . . . . . . . . . . . . . . . . . 79. 3 .4.2. Binding of 2-Nonanone and Milk Proteins . . . . . . . . . . . . . . . . . . . . . . . . . . . . . . . . . . . . . . . . . . . . . . . . . . . . . . . . 80. 3 .4.2. 1. �-Lactoglobulin (p-Ig) . . . . . . . . . . . . . . . . . . . . . . . . . . . . . . . . . . . . . . . . . . . . . . . . . . . . . . . . . . . . . . . . . . . . . . . . . . . . . . . . . . . 80. 3 .4.2.2. a-Lactalbumin (a-la) . . . . . . . . . . . . . . . . . . . . . . . . . . . . . . . . . . . . . . . . . . . . . . . . . . . . . . . . . . . . . . . . . . . . . . . . . . . . . . . . . . . . . 82. 3 .4.2.3. Bovine serum albumin (BSA) . . . . . . . . . . . . . . . . . . . . . . . . . . . . . . . . . . . . . . . . . . . . . . . . . . . . . . . . . . . . . . . . . . . . . . . 83. 3 .4.2.4. Case ins. . . . . . . . . . . . . . . . . . . . . . . . . . . . . . . . . . . . . . . . . . . . . . . . . . . . . . . . . . . . . . . . . . . . . . . . . . . . . . . . . . . . . . . . . . . . . . . . . . . . . . . . . .. 87. 3 .4.2.4 . 1. Purity of prepared sodium caseinate . . . . . . . . . . . . . . . . . . . . . . . . . . . . . . . . . . . . . . . . . . . . . . . . . . . . . . 87. 3 . 4.2.4.2. Separation of case ins by ion-exchange chromatography ( l EC) . . . . . . . . . . . . . . 8 8. 3 .4.2.4.3. Purity o f prepared case ins . . . . . . . . . . . . . . . . . . . . . . . . . . . . . . . . . . . . . . . . . . . . . . . . . . . . . . . . . . . . . . . . . . . . . 90. 3 .4.2.4.4. Binding of case ins and 2-nonanone . . . ... . . . . . . . . . . . . . . . . . . . . . . . . . . . . . . . . . . . . . . . . . . . . . . . . . 90. 3 .4.2.5. Milk Protein Products . . . . . . . . . . . . . . . . . . . . . . . . . . . . . . . . . . . . . . . . . . . . . . . . . . . . . . . . . . . . . . . . . . . . . . . . . . . . . . . . . . . 93. 3 . 4.2. 5 . 1. WPI . . . . . . . . . . . . . . . . . . . . . . . . . . . . . . . . . . . . . . . . . . . . . . . . . . . . . . . . . . . . . . . . . . . . . . . . . . . . . . . . . . . . . . . . . . . . . . . . . . . . . . 94. 3 . 4.2. 5 . 2. Sodium caseinate . . . . . . . . . . . . . . . . . . . . . . . . . . . . . . . . . . . . . . . . . . . . . . . . . . . . . . . . . . . . . . . . . . . . . . . . . . . . . . . . . . . 97. 3.5. Conclusions ................................................................................................... 99 .. CHAPTER FOUR: FACTORS INFLUENCING PROTEIN- FLAVOUR BINDING . 10 1 ... 4. 1. Abstract ........................................................................................................ 1 0 1. 4.2. Introduction . .. 4.3. Materials and M ethods ................................................................................ 1 03. .. ... .......... .. ........... . .................................................................... 1 02 .... 4.3 . 1. Flavour Compounds . . . . . . . . . . . . . . . . . . . . . . . . . . . . . . . . . . . . . . . . . . . . . . . . . . . . . . . . . . . . . . . . . . . . . . . . . . . . . . . . . . . . . . . . 1 03. 4 . 3 .2. Buffer Preparation . . . . . . . . . . . . . . . .. . . . . . . . . . . . . . . . . . . . . . . . . . . . . . . . . . . . . . . . . . . . . . . . . . . . . . . . . . . . . . . . . . . . . . . . . . 1 04. 4.3.3. Protein Preparation . . . . . . . . . . . . . . . . . . . . . . . . . . . . . . . . . . . . . . . . . . . . . . . . . . . . . . . . . . . . . . . . . . . . . . . . . . . . . . . . . . . . . . . . . 1 05. 4 . 3 .4. Other Solutions . . . . . . . . . . . . . . . . . . . . . . . . . . . . . . . . . . . . . . . . . . . . . . . . . . . . . . . . . . . . . . . . . . . . . . . . . . . . . . . . . . . . . . . . . . . . . . . 1 06. 4.3.5. Amino Ac id Analysis . . . . . . . . . . . . . . . . . . . . . . . . . . . . . . . . . . . . . . . . . . . . . . . . . . . . . . . . . . . . . . . . . . . . . . . . . . . . . . . . . . . . . . 1 06. 4.3.6. Heat Treatment . . . . . . . . . . . . . . . . . . . . . . . . . . . . . . . . . . . . . . . . . . . . . . . . . . . . . . . . . . . . . . . . . . . . . . . . . . . . . . . . . . . . . . . . . . . . . . . 1 06. 4.3.7. High Pressure Treatment . . . . . . . . . . . . . . . . . . . . . . . . . . . . . . . . . . . . . . . . . . . . . . . . . . . . . . . . . . . . . . . . . . . . . . . . . . . . . . . . . 1 08. 4.3.8. Competition with Sodium Dodecyl Sulphate ( SDS) . . . . . . . . . . . . . . . . . . . . . . . . . . . . . . . . . . . . . . . . 1 1 0. 4.3.9. Effect of pH . . . . . . . . . . . . . . . . . . . . . . . . . . . . . . . . . . . . . . . . . . . . . . . . . . . . . . . . . . . . . . . . . . . . . . . . . . . . . . . . . . . . . . . . . . . . . . . . . . . . 1 1 1. 4. 3 . 1 0. Identification of Unknown Compound using S PME and GC-Mass Spectrometry (GC-MS) . . . . . . . . . . . . . . . . . . . . . . . . . . . . . . . . . . . . . . . . . . . . . . . . . . . . . . . . . . . . . . . . . . . . . . . . . . . . . . . . . . 1 1 1.
(10) Table of Contents. VIII. Automated Headspace SPME Method .. 4 .3 . 1 2. Gas C hromatography . . . . . . . . . . . . . . . . . . . . . . . . . . . . . . . . . . . . . . . . . . . . . . . . . . . . . . . . . . . . . . . . . . . . . . . . . . . . . . . . . . . . . . 1 1 2. 4 .3. 1 3. Circular D ichroism (CD) . . . . . . . . . . . . . . . . . . . . . . . . . . . . . . . . . . . . . . . . . . . . . . . . . . . . . . . . . . . . . . . . . . . . . . . . . . . . . . . . 1 1 2. 4 .3 . 14. Statistical Analysis . . . . . . . . . . . . . . . . . . . . . . . . . . . . . . . . . . . . . . . . . . . . . . . . . . . . . . . . . . . . . . . . . . . . . . . . . . . . . . . . . . . . . . . . . 1 1 3. 4.4. . . . . . . . . . . . . . . . . . . . . . . . . . . . . . . . . . . . . . . . . . . . .. .. . . . . 111. 4 .3 . 1 1. . . . . .. . . .. . .. Results and Discussion .. .... ............ ............................................ ............. 1 13 ... 4 .4 . 1. .. .. .. Comparison of the B inding of 2-Nonanone, 1 -Nonanal, or trans-2-Nonenal to WPI. 4 .4 .2. .. . . . . . . . . . . . . . . . . . . . . . . . . . . . . . . . . . . . . . . . . . . . . . . . . . . . . . . . . . . . . . . . . . . . . . . . . . . . . . . . . . . . . . . . . . . . . . . . . . . . . . . . . . . . . . . .. 1 13. Effect of Heat Treatment on Flavour B inding to WPI . . . . . . . . . . . . . . . . . . . . . . . . . . . . . . . . . . . . . . 1 1 6. 4 .4 .2. 1. Effect of Heating Temperature on the B inding of 2-Nonanone to WPI . . . . . . . . 1 1 6. 4 .4 .2.2. Effect of Heating T ime on the B inding of Flavour Compounds to WPI . . . . . . . 1 1 7. 4 .4 .2.2 . 1. 2-Nonanone . . . . . . . . . . . . . . . . . . . . . . . . . . . . . . . . . . . . . . . . . . . . . . . . . . . . . . . . . . . . . . . . . . . . . . . . . . . . . . . . . . . . . . . . . 1 1 7. 4 .4 .2.2.2. 1 -Nonanal . . . . . . . . . . . . . . . . . . . . . . . . . . . . . . . . . . . . . . . . . . . . . . . . . . . . . . . . . . . . . . . . . . . . . . . . . . . . . . . . . . . . . . . . . . . 1 1 8. 4 .4 .2.2.3. Trans-2-nonenal . . . . . . . . . . . . . . . . . . . . . . . . . . . . . . . . . . . . . . . . . . . . . . . . . . . . . . . . . . . . . . . . . . . . . . . . . . . . . . . . . . 1 20. 4 .4. 2.3. Near-DV CD . . . . . . . . . . . . . . . . . . . . . . . . . . . . . . . . . . .. . . . . . . . . . . . . . . . . . . . . . . . . . . . . . . . . . . . . . . . . . . . . . . . . . . . . . . . . . . . 1 25. 4 .4 .2.4. Far-DV CD . . . . . . . . . . . . . . . . . . . . . . . . . . . . . . . . . . . . . . . . . . . . . . . . . . . . . . . . . . . . . . . . . . . . . . . . . . . . . . . . . . . . . . . . . . . . . . . . . 1 2 6. 4 .4 . 3. Effect of pH on F lavour Binding to WPI . . . . . . . . . . . . . . . . . . . . . . . . . . . . . . . . . . . . . . . . . . . . . . . . . . . . . . . . . 1 27. 4 .4 .4. Effect of H igh Pressure Treatment on F lavour B inding to WPI . . . . . . . . . . . . . . . . . . . . . . . 1 3 0. 4 .4 . 5. Competition with SDS . . . . . . . . . . . . . . . . . . . . . . . . . . . . . . . . . . . . . . . . . . . . . . . . . . . . . . . . . . . . . . . . . . . . . . . . . . . . . . . . . . . . 1 32. 4 .4 . 5 . 1. 2-Nonanone . . . . . . . . . . . . . . . . . . . . . . . . . . . . . . . . . . . . . . . . . . . . . . . . . . . . . . . . . . . . . . . . . . . . . . . . . . . . . . . . . . . . . . . . . . . . . . . . 1 32. 4 .4 . 5.2. 1 -Nonanal and trans-2-Nonenal . . . . . . . . . . . . . . . . . . . . . . . . . . . . . . . . . . . . . . . . . . . . . . . . . . . . . . . . . . . . . . . . . . 1 3 3. 4.5. Conclusions ....... ... ... .. . . . .. . .. ... ........ ..... ........................... ..... .. 134 ... .. .... .... .. .... ... ... .. .. .. .. .. .. ... CHAPTER FIVE: IN-MOUTH FLAVOUR RELEASE FROM PROTEIN CONTAINING SySTEMS. ............................................... . . .. ..... 5. 1. Abstract ... .. ..... . .. .. 5.2. Introduction ..................... ... ... 5.3. Materials and Methods .. . ... .. ... ... .... .... .... ......... ... .. ... ... .. ... . . .......................................... ............. . ..... ............................... ............. . .... .. ......... ..... .. .. ....... .. ... ... ... . . .. ............................................. .... .. . .. . 137 .. .. .... ... ... . ... . .............................. .. .. 137. .. ..... ........ 137. ... 138 .. 5.3 . 1. Materials . . . . . . . . . . . . . . . . . . . . . . . . . . . . . . . . . . . . . . . . . . . . . . . . . . . . . . . . . . . . . . . . . . . . . . . . . . . . . . . . . . . . . . . . . . . . . . . . . . . . . . . . . 1 3 8. 5 . 3 .2. In Vitro F lavour Release . . . . . . . . . . .. . . . .. . . . . . ....................... . .. . . . . . . . . . . . . . . . . . . . . . . . . . . ....... 139. 5 .3 . 3. Determination o f Flavour B inding b y S PME-GC-FI D . . . . . . . . . . . . . . . . . . . . . . . . . . . . . . . . . . . . 1 3 9. 5.3.3. 1. SPME . . . . . . . . . . . . . . . . . . . . . . . . . . . . . . . . . . . . . . . . . . . . . . . . . . . . . . . . . . . . . . . . . . . . . . . . . . . . . . . . . . . . . . . . . . . . . . . . . . . . . . . . . 1 39. 5.3 .3.2. Gas Chromatography . . . . . . . . . . . . . . . . . . . . . . . . . . . . . . . . . . . . . . . . . . . . . . . . . . . . . . . . . . . . . . . . . . . . . . . . . . . . . . . . . . 1 39.
(11) IX. Table of Contents. In Vivo Flavour Release by PTR-MS . . . . . . . . . . . . . . . . . . . . . . . . . . . . . . . . . . . . . . . . . . . . . . . . . . . . . . . . . . . . . . 1 40. 5 .3A 5 . 3 A.l. Preparation of Solutions . . . . . . . . . . . . . . . . . . . . . . . . . . . . . . . . . . . . . . . . . . . . . . . . . . . . . . . . . . . . . . . . . . . . . . . . . . . . . . 1 40. 5 . 3A.2. Sample Consumption Protocol . . . . . . . . . . . . . . . . . . . . . . . . . . . . . . . . . . . . . . . . . . . . . . . . . . . . . . . . . . . . . . . . . . . . 1 4 1. 5 . 3 .4.3. Measurement of Flavour Release by PTR-MS . . . . . . . . . . . . . . . . . . . . . . . . . . . . . . . . . . . . . . . . . . . . . 1 4 1. 5 . 3 .4.4. Calculation of the Flavour Concentration in the Breath . . . . . . . . . . . . . . . . . . . . . . . . . . . . . . . 1 42. 5 . 3 .4.5. Data Analysis of the PTR-MS Release Profiles . . . . . . . . . . . . . . . . . . . . . . . . . . . . . . . . . . . . . . . . . . . 1 43. 5.3.5. Statistical Analysis . . . . . . . . . . . . . . . . . . . . . . . . . . . . . . . . . . . . . . . . . . . . . . . . . . . . . . . . . . . . . . . . . . . . . . . . . . . . . . . . . . . . . . . . . 1 44 Results and Discussion ...................... ..................................................... . ... 1 44. 5.4. .. .. 5A. l. In Vitro Release of2-Nonanone from Milk Proteins by SPME-GC-FID . . . . . . . . . . 1 44. 5A.2. In Vivo Release o f 2-Nonanone from Milk Proteins by PTR-MS . . . . . . . . . . . . . . . . . . . . . 1 45. 5 .4.2. 1. B inding of 2-Nonanone in Solutions of WPI , Sodium Caseinate, and CMC 1 45. 5 .4.2.2. Selection of Mo lecular I ons for MS Detection . . . . . . . . . . . . . . . . . . . . . . . . . . . . . . . . . . . . . . . . . . . . . 1 46. 5A.2.3. Cho ice of Consumption Technique . . . . . . . . . . . . . . . . . . . . . . . . . . . . . . . . . . . . . . . . . . . . . . . . . . . . . . . . . . . . . 1 47. 5A.2.4. Choice of Protein Concentration . . . . . . . . . . . . . . . . . . . . . . . . . . . . . . . . . . . . . . . . . . . . . . . . . . . . . . . . . . . . . . . . . 1 48. 5A. 2 . 5. 2-Nonanone Release from Milk Proteins with I n-Mouth Movements . . . . . . . . . . 1 50. 5 .4.2.5 . 1. 2-Nonanone Release from WPI . . . . . . . . . . . . . . . . . . . . . . . . . . . . . . . . . . . . . . . . . . . . . . . . . . . . . . . . . . . 1 5 1. 5 .4 . 2 . 5 . 2. 2-Nonanone Release from Sodium Caseinate . . . . . . . . . . . . . . . . . . . . . . . . . . . . . . . . . . . . . . 1 53. 5 .4.2.6 5.5. The Effect of Viscosity on 2-Nonanone Release . . . . . . . . . . . . . . . . . . . . . . . . . . . . . . . . . . . . . . . . . . 1 53 Conclusions .................................................................................................. 158. CHAPTER SIX: OVERALL CONCLUSIONS AND RECOMMENDATIONS FOR FUTURE WORK ..................................................................................................... 160. BIBLIOGRAPHY ..................................................................................................... 166. APPENDIX .............................................................................................................. 188. Means and Standard Deviations . . . . . . . . . . . . . . . . . . . . . . . . . . . . . . . . . . . . . . . . . . . . . . . . . . . . . . . . . . . . . . . . . . . . . . . . . . . . . . . . . . . . . 1 88 Publications. . . . . . . . . . . . . . . . . . . . . . . . . . . . . . . . . . . . . . . . . . . . . . . . . . . . . . . . . . . . . . . . . . . . . . . . . . . . . . . . . . . . . . . . . . . . . . . . . . . . . . . . . . . . . . . . . . . .. 1 89.
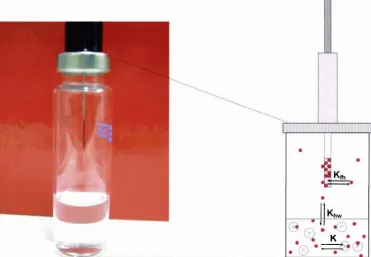
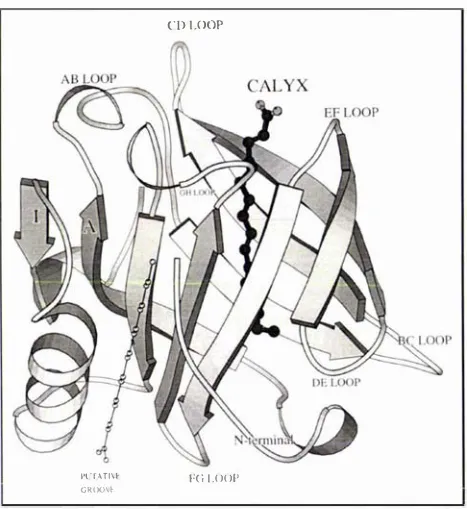
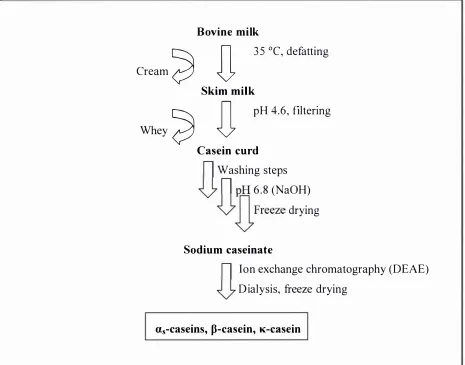
(12) x. List of Figures. LIST OF FIGURES F igure 2. 1 - 1 : Common interactions of proteins and flavour compounds; (a) hydrophobic interaction between a protein and an aliphatic aldehyde or ketone flavour; (b) Schiff base formation between I -nonanal and a lysine residue of a protein; (c) addition reaction of trans-2-nonenal and a lysine residue of a protein; (d) addition reaction of trans-2-nonenal and a histidine residue of a protein. . . . . . .. .. . . . . . . . . . .. .. . . . . . . . . . . . . . . . . . . . . . . . . . . . . . . . . . . . . . . . . . . . . . . . . . . . . . . . . . . . . . . . . . . . . .. .. . . . . . . . . . . . . . . . . . . .. 4. F igure 2.2- 1 : Illustration of the partition process in headspace SPME for investigating interactions of proteins (P) and flavour compounds (e ) (not to scale) ; fibre- headspace partition coeffic ient, coefficient,. K. Kjh. headspace-water partition. Khw. binding constant. . . . . . . . . . . . . . . . . . . . . . . . . . . . . . . . . . . . . . . . . . . . . . . . . . . . . . . . . . . . . . . . . . . . . . . . . 6. Figure 2.2-2 : A general view of p- Iactoglobulin with palmitic acid in the central hydrophobic pocket (filled atoms), and on the surface binding site (open atoms) ( from Wu and others (1999)). .. . . . . . . . . . . . . .. .. . . . . . . . . . . . . . . . . . . . . . . . . . . . . .. .. . . . . . . . . . . . . . . . . .. 15. F igure 2.2-3 : Vanillin flavour intensity relative to the reference in the presence of sodium caseinate (CAS) and whey protein concentrate ( WP C ) . The reference vanillin concentration was 3 . 3 8 x 1 0-6 mM in a 2 . 5 % sucrose solution. For each protein type, bars with dissimilar letter codes indicate significant differences between means (Hansen and Heinis, 1991). .. . . . . . . . . . . . . . . . .. 23. F igure 2 . 5 -1: The PTR-MS instrument (lonicon Analytik G mbH, Innsbruck, Austria), and a subject connected to the instrument while consuming a sample . . . . . . . . . . . . . 3 7 Figure 2. 5-2: Schematic o f the PTR-MS system (Source: Ionicon Analytik GmbH, Innsbruck, Austria) . . . . . . . . . . . . . . . . . . . . . . . . . . . . . . . . . . . . . . . . . . . . . . . . . . . . . . . . . . . . . . . . . . . . . . . . . . . . . . . . . . . . . . . . . 3 8 F igure 3 . 3 - 1 : Simplified scheme o f the isolation of the casein proteins from bovine milk. .. . . . . . . . . . . . . . . . . . . . . . . . . . . . . . . . . . . . . . . . . . . . . . . . . . . . . . . . . . . . . . . . . . . . . . . . . . . . . . . . . . . . . . . . . . . . . . . . . . . . . . . . . . . . . . .. 52. Figure 3 . 3-2: Set-up of the system for the casein separation using ion-exchange chromatography . . . . . . . . . . . . . . . . . . . . . . . . . . . . . . . . . . . . . . . . . . . . . . . . . . . . . . . . . . . . . . . . . . . . . . . . . . . . . . . . . . . . . . . . . . . . . 5 5 F igure 3 .4- 1 : Extraction t ime profiles o f different SPME fibre coatings for 2-nonanone (0.6 mM). . . . . . . . . . . . . . . . . . . . . . . . . . . . . . . . . . .. .. . . . . . . . . . .. .. . . . .. .. . . . . . .. ... . . . . . . . . . . . . . . . . . . . . . . . .. ... . . . . . . . . . . . . . . . . . . .. 69.
(13) List of Figures. XI. Figure 3 .4-2 : Thermal equi libration of a sample containing 2-nonanone (0.8 mM) and WPI (0.5 0/0) at 25 DC. . . . . . . . . . . . . . . . . . . . . . . . . . . . . . . . . . . . . . . . . . . . . . . . . . . . . . . . . . . . . . . . . . . . . . . . . . . . . . . . . . . .. . 75 . .. Figure 3 .4-3 : Standard curves of 2-nonanone using both ethano l (50 %) and propylene glyco l (pure) as flavour solvents . . . . . . . . . . . . . . . . . . . . . . . . . . . . . . . . . . . . . . . . . . . . . . . . . . . . . . . . . . . . . . . . . . . . . 76 Figure 3 .4-4: Binding of 2-nonanone (0.2 mM) to WPI (0.5 %) and to sodium caseinate ( 1 . 0 %) in the presence of ethano l ( 1 %) and propylene glycol (2 %) . . . . . . . . . . . . . . 77 Figure 3 .4-5 : Dependence o f FI D response on stirring speed and SPME extraction time . . . . . . 78 Figure 3 .4-6: Typical gas chromatograms of 2-nonanone in the absence and presence of WPI (0.5 %) . . . . . . . . . . . . . . . . . . . . . . . . . . . . . . . . . . . . . . . . . . . . . . . . . . . . . . . . . . . . . . . . . . . . . . . . . . . . . . . . . . . . . . . . . . . . . . . . . . . 80 Figure 3 .4-7 : Binding isotherm of 2-nonanone in aqueous so lution of P-Ig (0.5 %; 0.24 mM) at 25 DC (each data point is the mean of triplicates) ;. v. number. of moles of ligand bound per mole of protein . . . . . . . . . . . . . . . . . . . . . . . . . . . . . . . . . . . . . . . . . . . . . . . . . 8 1 Figure 3 .4- 8 : Klotz plot for the binding of 2-nonanone (0. 1 -0.8 mM) to P-lg (0.5 %; 0.24 mM) at 25 DC (each data point is the mean of triplicates) . . . . . . . . . . . . . . . . . . . . . . . . 8 1 Figure 3 .4-9: Binding isotherm for the binding of 2-nonanone (0. 1 -0 . 8 mM) and a-la (0.5 %; 0.3 mM) at 25 DC (each data point is the mean o f triplicates) . . . . . . . . . . . . . . 83 Figure 3 .4- 1 0 : Klotz plot for the binding of 2-nonanone (0. 1 -0 . 8 mM) to a-la (0.5 %; 0.3 mM) at 25 DC (each data point is the mean of triplicates) . . . . . . . . . . . . . . . . . . . . . . . . . . 83 Figure 3 .4- 1 1 : Binding isotherm of 2-nonanone (0. 1 -0.8 mM ) in aqueous solution of BSA (0.5 %; 0.065 mM) at 25 DC (each data point is the mean of triplicates). . . . . . . . . . . . . . . . . . . . . . . . . . . . . . . . . . . . . . . . . . . . . . . . . . . . . . . . . . . . . . . . . . . . . . . . . . . . . . . . . . . . . . . . . . . . . . . . . . . . . . .. 84. Figure 3 .4- 1 2 : Scatchard plot for the binding of 2-nonanone (0. 1 -0 . 8 mM) to B SA (0.5 %; 0.065 mM) at 25 DC (each data point is the mean of triplicates) . . . . . . . . . . 84 Figure 3 .4- 1 3 : Klotz plot for the binding of 2-nonanone (0. 1 -0 . 8 mM) to BSA (0.5 %; 0.065 mM) at 25 DC, divided into low (0. 1 -0.2 mM) and high (0 .20 . 8 mM) 2-nonanone concentrations (each data point is the mean of triplicates) . . . . . . . . . . . . . . . . . . . . . . . . . . . . . . . . . . . . . . . . . . . . . . . . . . . . . . . . . . . . . . . . . . . . . . . . . . . . . . . . . . . . . . . . . . . . . . . . . . . . . . 85.
(14) L i st of Figures. XII. Figure 3 .4-14 : Hill p lot for the binding of B S A (0. 5 %; 0.065 mM) to 2-nonanone (0. 1 -0. 8 mM), divided into two c lasses of binding sites; Y saturation of binding sites (assuming nl = 2.4 and n2 = 1 0) ; [L] concentration of free 2-nonanone (M). .. . . . . . . . . . . . . . . . . . . .. .. . . . . . . . . . . . . . . . . . . . . . . . . . . . . . . . . . . . . . . . . . . . . .. .. . . . . . . . . . . . . . . . . . . . . . . . . . .. 86. Figure 3 .4- 1 5 : Comparison of prepared and commercial sodium caseinate using SEC and (a) UV detection, and (b) RI detection . . . . . . . . . . . . . . . . . . . . . . . . . . . . . . . . . . . . . . . . . . . . . . . . . . . . . 88 Figure 3 .4- 1 6 : Elution of the caseins from the ion-exchange column, measured by UV absorbance at "A PAGE. .. =. 280 nm; vertical errors indicate tubes selected for urea. . . . . . . . . . . . . . . . . . . . . . . . . . . . . . . . . . . . . . . . . . . . . . . . . . . . . . . . . . . . . . . . . . . . . . . . . . . . . . . . . . . . . . . . . . . . . . . . . . . . . . . . . . . .. 89. Figure 3 .4- 1 7 : Urea PAGE gels of casein standards (three lanes on the left) and selected fractions (see Figure 3 .4- 1 6) . . . . . . . . . . . . . . . . . . . . . . . . . . . . . . . . . . . . . . . . . . . . . . . . . . . . . . . . . . . . . . . . . . . . . . . . . . . 89 Figure 3 . 4- 1 8 : Urea P AGE gel of casein standards (three lanes on the left) and pooled casein fractions . . . . . . . . . . . . . . . . . . . . . . . . . . . . . . . . . . . . . . . . . . . . . . . . . . . . . . . . . . . . . . . . . . . . . . . . . . . . . . . . . . . . . . . . . . . . . . 90 Figure 3 .4- 1 9 : Binding of 2-nonanone to prepared usl -casein (2.0 %; 0.73 mM) and p-casein (2.0 %; 0.86 mM) . . . . . . . . . . . . . . . . . . . . . . . . . . . . . . . . . . . . . . . . . . . . . . . . . . . . . . . . . . . . . . . . . . . . . . . . . . . . . 9 1 Figure 3 .4-20 : Klotz p lot for the binding o f 2-nonanone (0. 1 -0.8 mM) to the prepared usl -casein (2 .0 %, 0.73 mM) and p-casein (2.0 %, 0.86 mM) (each data point is the mean of duplicates) . . . . . . . . . . . . . . . . . . . . . . . . . . . . . . . . . . . . . . . . . . . . . . . . . . . . . . . . . . . . . . . . . . . . . . 92 Figure 3 .4-2 1 : Influence of WPI (0.5 %) and sodium caseinate ( l .0 %) on the headspace concentration of 2-nonanone . . . . . . . . . . . . . . . . . . . . . . . . . . . . . . . . . . . . . . . . . . . . . . . . . . . . . . . . . . . . . . . . . . . . . . . . . . 93 Figure 3 .4-22 : Scatchard p lot for the binding of 2-nonanone (0. 1 -0 . 8 mM) and WPI (0.5 0/0). . . . . . . . .. .. . . . . . . . . . . . . . . . . . . . . . . . . . . . . . . . . . . . . . . . . . . . . . . . . . . . . . . . . . . . . . . . . . .. .. . . . . . . .. .. . . . . . . . . . . .. .. . . . . . . . . . . .. 94. Figure 3 . 4-23 : Klotz plot for the binding of 2-nonanone (0. 1 -0.8 mM) to WPI (0. 5 %) at 25 QC (each data point is the mean of five replicates) . . . . . . . . . . . . . . . . . . . . . . . . . . . . . . . . . . . . . 95 Figure 3 . 4-24 : Klotz plot for the binding of 2-nonanone (0. 1 -0.8 mM) to sodium caseinate (l.0 %) at 25 QC (each data point is the mean of four replicates) . . . . . . 97.
(15) XIII. List of Figures. Figure 4 . 3 - 1 : Flowchart showing the sample preparation to investigate binding of flavour compounds to treatment.. WPI. for both flavour addition before and after heat. . . . . . . . . . . . . . . . . . . . . . . . . . . . . . . . . . . . . . . . . . . . . . . . . . . . . . . . . . . . . . . . . . . . . . . . . . . . . . . . . . . . . . . . . . . . . . . . . . . . . .. 1 07. Figure 4.3-2 : Flowchart showing the sample preparation to investigate binding of flavour compounds to. WPI. for both flavour addit ion before and after high. pressure treatment. . . . . . . . . . . . . . . . . . . . . . . . . . . . . . . . . . . . . . . . . . . . . . . . . . . . . . . . . . . . . . . . . . . . . . . . . . . . . . . . . . . . . . . . 1 08 Figure 4.3-3 : Temporal profiles of temperature and pressure during high pressure treatment at (a) 250 MPa, and (b) 600 MPa . . . . . . . . . . . . . . . . . . . . . . . . . . . . . . . . . . . . . . . . . . . . . . . . . . 1 09 Figure 4.4- 1 : GC chromatogram of 2-nonanone, 1 -nonanal, and lrans-2-nonenal. . . . . . . . . . . . . . . 1 1 3 Figure 4.4-2 : Standard curves of trans-2-nonenal,. I -nonanal, and 2-nonanone. (0.2- 1 .0 ppm) . . . . . . . . . . . . . . . . . . . . . . . . . . . . . . . . . . . . . . . . . . . . . . . . . . . . . . . . . . . . . . . . . . . . . . . . . . . . . . . . . . . . . . . . . . . . . . . 1 1 4 Figure 4.4- 3 : Binding of C9 flavour compounds ( 1 . 0 ppm) to WPI (0.5 %). Different letters indicate significant (P < 0.05) differences between samples (n = 3 ) . . . . 1 1 4 Figure 4.4-4 : Comparison of amino acids in. WPI. (0. 025 %) in the absence and presence. of trans-2-nonenal (25 ppm) . . . . . . . . . . . . . . . . . . . . . . . . . . . . . . . . . . . . . . . . . . . . . . . . . . . . . . . . . . . . . . . . . . . . . . . . . 1 1 6 Figure 4.4-5: Binding of 2-nonanone (0. 1 mM) to. WPI. (0.5 %) upon heat treatment for. 1 2 min at temperatures between 30 and 90 QC (n = 3 ) . . . . . . . . . . . . . . . . . . . . . . . . . . . . . . . . . . . 1 1 7 Figure 4 .4-6: Binding of 2-nonanone ( 1 . 0 ppm) to. WPI. (0.5 %) with increasing heating. time (80 QC) (n = 3 ) . . . . . . . . . . . . . . . . . . . . . . . . . . . . . . . . . . . . . . . . . . . . . . . . . . . . . . . . . . . . . . . . . . . . . . . . . . . . . . . . . . . . . . 1 1 7 Figure 4.4-7: Binding of 1 -nonanal ( 1 .0 ppm) to. WPI. (0.5 %) with increasing heating. time (80 QC) (n = 3 ) . . . . . . . . . . . . . . . . . . . . . . . . . . . . . . . . . . . . . . . . . . . . . . . . . . . . . . . . . . . . . . . . . . . . . . . . . . . . . . . . . . . . . . 1 1 9 Figure 4.4- 8 : Binding of trans-2-nonenal ( 1 .0 ppm) to. WPI. (0.5 %) with increasing. heating time (80 QC) (n = 3) . . . . . . . . . . . . . . . . . . . . . . . . . . . . . . . . . . . . . . . . . . . . . . . . . . . . . . . . . . . . . . . . . . . . . . . . . . 1 20 Figure 4.4-9: (a) Chromatogram of volatiles after heating. WPI. (0.5 %) and trans-. 2-nonenal ( 1 .0 ppm) at 80 QC for 1 0 and 80 min, respectively; (b) mass spectrum of the heptanal peak (mlz 20- 1 20) . . . . . . . . . . . . . . . . . . . . . . . . . . . . . . . . . . . . . . . . . . . . . . . . . . 1 2 1.
(16) L ist o f Figures. XIV. Figure 4.4-10: Chromatogram of volatiles after heating trans-2-nonenal (1 .0 ppm) in phosphate buffer (0.1 M, pH 7.2) at 80 QC for 80 m in . . . . . . . . . . . . . . . . . . . . . . . . . . . . . . . . . . . 121 Figure 4.4-11: Effect of different levels of (a) ascorbic acid (O-O. l %) and (b) gallic acid (0-0. 07 %) on the FID peak areas o f heptanal and trans-2-nonenal after the latter (1. 0 ppm) was heated (60 min, 80 QC) in the presence. 0f. WPI. (0.5 %) in phosphate buffer (26 mM, pH 7.2). For each individual flavour compound, d ifferent letters indicate significant (P < 0.05) differences between samples (n = 2) . . . . . . . . . . . . . . . . . . . . . . . . . . . . . . . . . . . . . . . . . . . . . . . . . . . . . . . . . . . . . . . . . . . . . . . . . . . . . . . 122 Figure 4.4-12 : Effect of nitrogen in the headspace of heated (80 QC, 60 min) samples, containing WPI (0.5 %) and trans-2 -nonenal (1.0 ppm), on the FID peak areas of he ptanal and trans-2-nonenal (n = 3) . . . . . . . . . . . . . . . . . . . . . . . . . . . . . . . . . . . . . . . . . . . . . . . 123 Figure 4.4-13 : Chromatograms of vo latiles after trans-2-nonenal (1.0 ppm) was heated at 80 QC for 10 and 80 min, respectively, in the presence of (a) B-lg (0.5 %), and (b) BSA (0.5 %) . . . . . . . . . . . . . . . . . . . . . . . . . . . . . . . . . . . . . . . . . . . . . . . . . . . . . . . . . . . . . . . . . . . . . . . 124 F igure 4.4-14: Chromatogram of volatiles after trans-2-nonenal (1.0 ppm) was heated at 80 QC for 10 and 80 min, respect ively, in the presence of sodium caseinate (2.0 %). . . . . . . . . . . . . . . . . . . . . . . . . . . . . . . . . . . . . . . . . . . . . . . . . . . . . . . . . . . . . . . . . . . . . . . . . . . . . . . . . . . . . . . . . . .. Figure 4.4-15 : Near-UV CD spectra of WPI solutions between 250 and 3 5 0. run. 124. in the. absence and presence of propylene glycol (1 %), 2-nonanone (14 ppm), and trans-2-nonenal (1 ppm) at room temperature . . . . . . . . . . . . . . . . . . . . . . . . . . . . . . . . . . . . . . . . 125 Figure 4.4-16 : Near-UV CD spectra of native and heat-treated (80 QC, 20 min) WPI solutions between 250 and 3 5 0 run in the absence and presence o f 2-nonanone ( 1 4 ppm) . . . . . . . . . . . . . . . . . . . . . . . . . . . . . . . . . . . . . . . . . . . . . . . . . . . . . . . . . . . . . . . . . . . . . . . . . . . . . . . . . . . 126 Figure 4.4-17: Far-UV CD spectra of WPI so lutions between 190 and 2 5 0. run. in the. absence and presence of 2-nonanone (14 ppm) and trans-2-nonenal (1 ppm) at roo m temperature . . . . . . . . . . . . . . . . . . . . . . . . . . . . . . . . . . . . . . . . . . . . . . . . . . . . . . . . . . . . . . . . . . . . . . . . 127 Figure 4.4-18 : Far-UV CD spectra of native and heat-treated (80 QC, 20 min) WPI solutions between 190 and 250. run. in the absence and presence o f. 2-nonanone (14 ppm) . . . . . . . . . . . . . . . . . . . . . . . . . . . . . . . . . . . . . . . . . . . . . . . . . . . . . . . . . . . . . . . . . . . . . . . . . . . . . . . . . . . 127.
(17) xv. L ist of Figures. Figure 4.4- 1 9 : Effect of pH on the binding of (a) 2-nonanone, ( b) 1 -nonanal, (c) trans2-nonenal at 1 .0 ppm to unheated or heat-treated (80. cC,. 5 min) WPI. (0.5 %). Different letters indicate significant (P < 0.05) differences between samples (n = 3) . . . . . . . . . . . . . . . . . . . . . . . . . . . . . . . . . . . . . . . . . . . . . . . . . . . . . . . . . . . . . . . . . . . . . . . . . . . . . . . 1 28 Figure 4.4-20: E ffect of high pressure treatment (250 and 600 MPa, 30 min) on the binding of 2-nonanone, 1 -nonanal, and trans-2-nonenal to WPI (0. 5 %) at pH 7.2; (a) flavour added before high pressure treatment, (b) flavour added after high pressure treatment. For each individual flavour compound, different letters indicate significant (P < 0.05) differences between samples (n = 3 ) . . . . . . . . . . . . . . . . . . . . . . . . . . . . . . . . . . . . . . . . . . . . . . . . . . . . . . . . . . . . . . . . . . . . . . . . . . . . . . . 1 3 0 Figure 4.4-2 1 : B inding o f 2-nonanone (0. 1 mM) to P-Ig (0.2 mM) in the absence of SDS, and with SDS (0.2 mM) added before and after 2-nonanone, at both pH 4.0 and pH 7.2 (n = 3) . . . . . . . . . . . . . . . . . . . . . . . . . . . . . . . . . . . . . . . . . . . . . . . . . . . . . . . . . . . . . . . . . . . . . . . . . . . . . 1 3 2 Figure 4.4-22 : D isplacement o f aldehyde flavours (0.007 mM) o n P-Ig (0.0 14 mM) by SDS (0. 0 1 4 mM) at pH 7.2. For each individual flavour compound, different letters indicate significant differences (P < 0.05) between samples (n = 3 ) . . . . . . . . . . . . . . . . . . . . . . . . . . . . . . . . . . . . . . . . . . . . . . . . . . . . . . . . . . . . . . . . . . . . . . . . . . . . . . . . . . . . . . . . . . . . . 1 3 4 Figure 5 . 3 - 1 : Example for concentrations o f 2-nonanone i n controls 1 and 2 . . . . . . . . . . . . . . . . . . . . . . 1 4 1 Figure 5 . 3-2: Parameters (lmax, (max, A UC) for the analysis o f the PTR-MS release profiles. . . . . . . . . . . . . . . . . . . . . . . . . . . . . . . . . . . . . . . . . . . . . . . . . . . . . . . . . . . . . . . . . . . . . . . . . . . . . . . . . . . . . . . . . . . . . . . . . . . . . . . . . .. 1 43. Figure 5 . 4- 1 : Release of 2-nonanone from (a) individual whey proteins, and (b) WPI and sodium caseinate at 30. cC, FlD peak areas normalised . . . . . . . . . . . . . . . . . . . . . . . . . . .. 1 44. F igure 5 .4-2 : Binding of 2-nonanone to (a) WPI at 0.5, 1 . 0, and 2.0 %, and (b) sodium caseinate at 1 .0, 2.0, and 4.0 %. . . . . . . . . . . . . . . . . . . . . . . . . .. .. . . . . . . . . . . . . . . . . . . . . . . . . . . . . . . . . . . . . . . . . . . .. 1 45. Figure 5 .4-3 : Scan of mlz 20- 1 80 of the headspace above (a) a solution of 50 ppm 2-nonanone and (b) water . . . . . . . . . . . . . . . . . . . . . . . . . . . . . . . . . . . . . . . . . . . . . . . . . . . . . . . . . . . . . . . . . . . . . . . . . . . . . 1 46 Figure 5.4-4: Temporal 2-nonanone release from a WP I so lution (2 %) and the corresponding "control 1 ", when samples were swallowed straight after sample intake without any in-mouth movements . . . . . . . . . . . . . . . . . . . . . . . . . . . . . . . . . . . . . . . . . . 147.
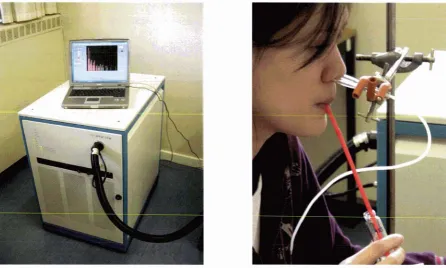
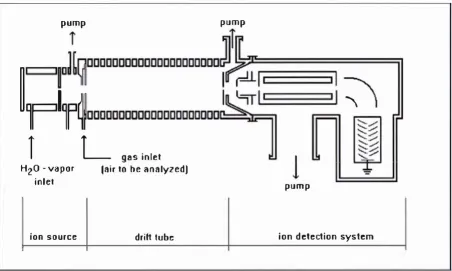
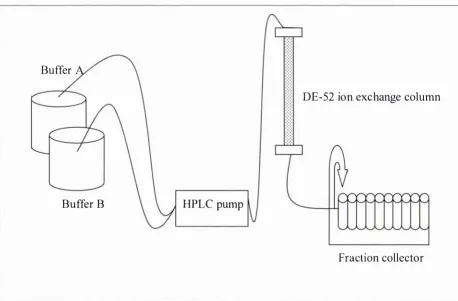
(18) List of Figures. XVI. Figure 5 .4-5 :. Release of 2-nonanone from WPI, sodium caseinate, and the. corresponding controls after the samples were swallowed straight after sample intake without any in-mouth movements. . . . . . . . . . . . . . . . . . . . . . . . . . . . . . . . . . . . . . . . . . 1 48 Figure 5 .4-6: Release profiles of 2-nonanone from (a) 0 . 5 % and (b) 2 % WPI so lutions in comparison to the controls 1 . Samples were consumed by subject 3 with swirling in-mouth . . . . . . . . . . . . . . . . . . . . . . . . . . . . . . . . . . . . . . . . . . . . . . . . . . . . . . . . . . . . . . . . . . . . . . . . . . . . . . . . . 1 49 Figure 5 .4-7: Comparison of the release of 2-nonanone from sodium caseinate and WPI (2 %) (n= 5) . . . . . . . . . . . . . . . . . . . . . . . . . . . . . . . . . . . . . . . . . . . . . . . . . . . . . . . . . . . . . . . . . . . . . . . . . . . . . . . . . . . . . . . . . . . . . . . . 1 5 1 Figure 5 .4-8 : Release of 2- nonanone from a WPI solution (2 %) as compared to the controls. .. . . . . . . . . . . . . . . . . . . . . . . . . . . . . . . . . . . . . . . . . . . . . . . . . . . . . . . . . . . . . . . . . . . . . . . . . . . . . . . . . . . . . . . . . . . . . . . . . . . . . . . .. 1 52. Figure 5 .4-9 : Release of 2-nonanone from a sodium caseinate solution (2 %) as compared to the controls . . . . . . . . . . . . . . . . . . . . . . . . . . . . . . . . . . . . . . . . . . . . . . . . . . . . . . . . . . . . . . . . . . . . . . . . . . . . . . 1 5 3 Figure 5 .4- 1 0 : Effect of C MC (0.5 %) on the release of 2-nonanone from control 2 ( 1 ppm 2-nonanone) . . . . . . . . . . . . . . . . . . . . . . . . . . . . . . . . . . . . . . . . . . . . . . . . . . . . . . . . . . . . . . . . . . . . . . . . . . . . . . . . . . . . . 1 54 Figure 5 .4- 1 1 : Effect of CMC (0.5 %) on the release o f 2-nonanone from WPI and sodium caseinate solutions (2 %) . . . . . . . . . . . . . . . . . . . . . . . . . . . . . . . . . . . . . . . . . . . . . . . . . . . . . . . . . . . . . . . . . . 1 5 5 Figure 5 . 4- 1 2 : Release of 2-nonanone from WPI and sodium caseinate (2 %) in thickened systems (0.5 % C MC) as compared to the corresponding thickened controls . . . . . . . . . . . . . . . . . . . . . . . . . . . . . . . . . . . . . . . . . . . . . . . . . . . . . . . . . . . . . . . . . . . . . . . . . . . . . . . . . . . . . . . . 1 5 7.
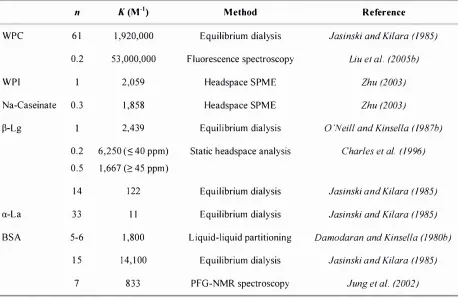
(19) List of Tables. XVII. LIST OF TABLES Table 2 . 2- 1 : Levels of 2-nonanone in foods . . . . . . . . . . . . . . . . . . . . . . . . . . . . . . . . . . . . . . . . . . . . . . . . . . . . . . . . . . . . . . . . . . . . . . . . . . 1 3 Table 2 . 2-2: Major proteins in bovine milk; adapted from Rosenthal (1 991). . . . . . . . . . . . . . . . . . . . . . . . . .. 14. Table 2 .2-3 : Binding data for the interactions between 2-nonanone and milk proteins (25 °C ): n, number o f binding sites per monomer; constant.. K,. intrinsic binding. . . . . . . . . . . . . . . . . . . . . . . . . . . . . . . . . . . . . . . . . . . . . . . . . . . . . . . . . . . . . . . . . . . . . . . . . . . . . . . . . . . . . . . . . . . . . . . . . . . . . . . . . .. 22. Table 2 .3 - 1 : Influence of heat denaturation o n the binding between milk proteins and flavour compounds; i binding increases, t binding decreases . . . . . . . . . . . . . . . . . . . . . . . . . 29 Table 2 . 5 - 1 : Proton affinities of selected constituents of air and selected organic volatile compounds (Lindinger et aI. , 1 998). . . . . . . . . . . . . .. .. . . . . . . . . . . . . . . . . . . . . . . . . . . . . . . . . . . . . . . . . . . . . . . . . . .. 39. Table 3 . 3 - 1 : Physicochemical properties of 2-nonanone . . . . . . . . . . . . . . . . . . . . . . . . . . . . . . . . . . . . . . . . . . . . . . . . . . . . . . . 5 0 Table 3 . 3-2: Spectroscopic data of aqueous solutions of the main whey proteins and caseins ( l %). . . . . . . . . . . . . . . . . . . . . . . . . . . . . . . . . . . . . . . . . . . . . . . .. .. . . . . . . . . . . . . . . . . . . . . . . . . .. .. . . . . . . . . . . . . . . . . . . . .. .. . . .. 59. Table 3 .4- 1 : Amount of 2-nonanone extracted by PDMS fibres . . . . . . . . . . . . . . . . . . . . . . . . . . . . . . . . . . . . . . . . . . . . 7 1 Table 3 .4-2: Partition coeffic ients for flavour compounds between the PDMS fibre coating and the headspace above the flavour solution (Roberts et aI. ,. 2000; Jung and Ebeler, 2003a) calculated by LTPRI (Pawliszyn, 1 997) . .... . . .. 74 3 Table 3 .4-3 : F I D responses ( x 1 0- ) after headspace extraction by syringe (300 f.ll) and by SPME of a 2-nonanone so lution ( l . 0 mM). . . . . . . . . . . . . . . . . . . . . . . . . . . . . . . . . . . . . . . . . . . . . . . . . .. 74. Table 3 .4-4: Influence of stirring speed on the amount of 2-nonanone extracted from the headspace as determined by FID peak area. . . . . . . . . . . . . . . . . . . . . . . . . . . . . . . . . . . . . . . . . . . . . . . . . . . . . 78 Table 3 .4-5: Optimum SPME parameters for the measurement of protein-flavour interactions . . . . . . . . . . . . . . . . . . . . . . . . . . . . . . . . . . . . . . . . . . . . . . . . . . . . . . . . . . . . . . . . . . . . . . . . . . . . . . . . . . . . . . . . .. . . . . . . . . . . 79 Table 3 .4-6: Fractions and yields of prepared caseins . . . . . . . . . . . . . . . . . . . . . . . . . . . . . . . . . . . . . . . . . . . . . . . . . . . . . . . . . . . 89 Table 3 .4-7: Percent binding o f 2-nonanone to. asl-. and �-casein (0.5 %). . . . . . . . . . . . . . . . . . . . . . . . .. .. . . . .. . 91. Table 3 .4-8 : Protein composition of WPI as determined by HPLC . . . . . . . . . . . . . . . . . . . . . . . . . . . . . . . . . . . . . . . 96.
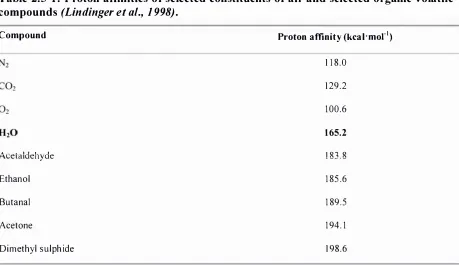
(20) XVI I I. List o f Tables. Table 3 .4-9: Binding parameters of 2-nonanone with the individual milk proteins and the milk protein products WPI and sodium caseinate at 25 QC; of binding sites per mono mer,. K. intrinsic binding constant,. n. number. nK. global. binding constant. . . . . . . . . . . . . . . . . . . . . . . . . . . . . . . . . . . . . . . . . . . . . . . . . . . . . . . . . . . . . . . . . . . . . . . . . . . . . . . . . . . . . . . . . . . . . 98 Table 4.3- 1 : Characteristics o f the C9 flavour compounds . . . . . . . . . . . . . . . . . . . . . . . . . . . . . . . . . . . . . . . . . . . . . . . . . . 1 03 Table 4.3-2 : Sample preparation scheme for the SOS competition experiment. . . . . . . . . . . . . . . . . . . 1 1 0 Table 4.3-3 : Parameters of the automated headspace SPME method . . . . . . . . . . . . . . . . . . . . . . . . . . . . . . . . . . 1 1 1 Table 4.3-4: Sample preparation scheme for the C D experiment. . . . . . . . . . . . . . . . . . . . . . . . . . . . . . . . . . . . . . . . 1 1 2 Table 5.3 - 1 : Preparation of protein solutions for the. in vitro. flavour release experiment. . . . . 1 3 9. Table 5 . 3-2: Added volumes of 2-nonanone stock solution (50 ppm), and total and free 2-nonanone concentrations in the protein containing samples and in the controls. .. . . . . . . . . . . . . . . . . . . . . . . . . . . . . . . . . . . . . . . . . . . . . . . . . . . . . . . . . . . . . . . . . . . . . . . . . . . . . . . . . . . . . . . . . . . . . . . . . . . . . . . .. 1 40. Table 5 . 3-3 : PTR-MS operating conditions . . . . . . . . . . . . . . . . . . . . . . . . . . . . . . . . . . . . . . . . . . . . . . . . . . . . . . . . . . . . . . . . . . . . . . . . 1 42 Table 5 .4- 1 : Binding of 2-nonanone ( 1 .0 ppm) to WPI and sodium case inate (2 %) in thickened (0.5 % CMC) and non-thickened systems (mean ± standard deviat ion; n = 3 ) . . . . . . . . . . . . . . . . . . . . . . . . . . . . . . . . . . . . . . . . . . . . . . . . . . . . . . . . . . . . . . . . . . . . . . . . . . . . . . . . . . . . . . . . . . . 1 46 Table 5 .4-2 : Areas under the curve (A ues) ,. tm ax,. and. Imax. of all samples (mean ±. standard deviation; n = 5) . . . . . . . . . . . . . . . . . . . . . . . . . . . . . . . . . . . . . . . . . . . . . . . . . . . . . . . . . . . . . . . . . . . . . . . . . . . . . 1 54.
(21) L i st of Abbreviations. XIX. LIST OF ABBREVIATIONS 00. At equilibrium. a- la. a-Lactalbumin. P-Ig. p-Lactoglobulin Extinction coefficient (I'mo r 1 'cm- 1 ). A. Wavelength (nm). 8. Temperature Cc). A. Absorptivity. APCI. Atmospheric pressure chemical ionisation. APS. Ammonium persulphate. AUC. Area under the curve. BSA. Bovine serum albumin. BTEX. Benzene, toluene, ethylbenzene, and xylenes. c. Concentration (M). C. Cross-linker as percentage of total monomer concentration (%). CAR. Carboxen. CD. Circular dichro ism. C MC. Carboxymethylcellulo se. cone.. concentrated. cps. Counts per second. CY. Coefficient of variat ion (%). Da. Dalton (g·mor 1 ). DCCLC. Dynamic coupled co lumn liquid chromatography. DEAE. Diethy laminoethy I. DSC. Differential scanning calorimetry. DYB. Diviny lbenzene.
(22) xx. L ist of Abbreviations. E. E lectric field. [F]. Concentration of flavour (M). FID. F lame ionisation detector. GC. Gas chromatograph(y). GC-O. GC-olfactometry. h. Hour(s) or Hill coefficient or headspace. HHP. H igh hydrostatic pressure. H PLC. H igh performance liquid chromatography. HPMC. Hydroxypropyl methyl cellulose. I EC. Ion-exchange chromatography. I max. Maximum intensity of flavour perception I nfrared B inding constant (M- ' ) D issociation constant Partition coefficient between SPME fibre coating and headspace Partition coefficient between SPME fibre coating and water Partition coefficient between headspace and water. [L]. Concentration of free ligand (M). [L ] tot. Total ligand concentration (M). Log P. Logarithm of the partition coefficient between water and n-octanol. LTPRI. L inear temperature programmed retention index. M. MoIT '. mm. M inute(s). MPC. Milk protein concentrate. MS. Mass spectrometry I spectrometer. MW. Molecular weight.
(23) XXI. List of Abbreviations. m1z. Mass to charge ratio. n. Number of binding sites per mole of protein. nK. Global binding constant (M- I ). NMR. Nuclear magnetic resonance. NOE. Nuclear Overhauser effect. [P]. Protein concentration. PAGE. Polyacrylamide gel electrophoresis. P AH. Polycyclic aromatic hydrocarbons. PDMS. Polydimethylsiloxane. PFG. Pulsed field gradient. PG. Propylene g lyco l ( 1 ,2-propanedio l). ppbV. Parts per billion by volume. ppm. Parts per million. PTFE. Polytetrafluoroethylene. PTR. Proton transfer reaction. RAS. Retronasal aroma simulator. RI. Refractive index. rpm. Revs per minute. sccm. 3 standard centimeter cube per minute ; 1 c m of gas per minute at 0 QC and at atmospheric pressure.. SD. Standard deviation. SE. Standard error. SEM. Secondary electron multiplier. SDS. Sodiumdodecylsulphate. s. Second(s). SEC. Size exclusion chromatography.
(24) List of Abbreviations. X XII. SPME. Solid-phase microextraction. t. Time. T. Total monomer concentration (%). TCA. Trichloroacetic acid. TEMED. N, N, N ' , N ' -Tetramethylethylenediamine Equilibration time Extraction t ime. TI. Time-intensity. t max. Time at which maximum flavour intensity is perceived. Tris. Tris(hydroxymethy l)methy lamine. UV. Ultraviolet. V. Volume (1) or Volts. v. Number of moles of flavour bound per mol of protein. var. Variance. WPC. Whey protein concentrate. WPI. Whey protein iso late. Y. Fractional saturation of binding sites on the protein.
(25) Chapter One: Introduction. C HAPTER ON E : I NTRO D UCTI O N One of the most important criteria for consumer acceptance of foods i s flavour. Food matrix components, such as proteins (Gremli, 1 9 74; Damodaran and Kinsella, 1 980a, b, 1 981a, b;. Fares et al. , 1 998; Liibke et al. , 2002; Gianelli et al. , 2005), carbohydrates (Yven et al. , 1 998; Heinemann et al. , 2001; Philippe et al. , 2003,· Jouquand et al. , 2004) , and lipids (Ebeler et al. , 1988; van Ruth et al. , 2002; Meynier et al. , 2003) , are known to interact with flavour compounds. Proteins are added to foods primarily because of their functional properties, such as emulsifying and stabilising capacities, and their nutritional value. However, interactions between proteins and flavours are known to influence the perceived flavour of a food product. (Overbosch et al. , 1 991,· Land, 1 996) . Protein ingredients not only reduce the perceived impact of desirable flavours but also may transmit undesirable off-flavours to foods, espec ially whey protein and soy protein products (Mills and Solms, 1 984,· Semenova et al. ,. 2002a) . I n addition, proteins may change the texture of a food, i.e. gelling, and thus decrease the flavour perception due to inhibition of mass transfer (Jaime et al. , 1 993,· Carr et al. , 1 996,·. Wilson and Brown, 1997) . I n the area of protein-flavour interactions, studies have been conducted mainly with milk proteins (Andriot et al. , 2000,· L iibke et al. , 2002) and soy proteins (Damodaran and KinseLfa,. 1 981 a,· Li et al. , 2000) , but also with a range of other food proteins, such as fababean protein (Ng et al. , 1 989a, b,· Semenova et al. , 2002a), pea protein (Dumont and Land, 1 986) , ovalbumin (Maier, 1970; Ebeler e t al. , 1 988), fish actomyosin (Damodaran and KinseLfa,. 1 983), and myoglobin (Gianelli et al. , 2005) . The studies on milk proteins are of great importance since milk proteins are utilised in numerous food products, including dairy products, bakery and confectionary products, and meat products (Mulvihill, 1992). The demand for healthier, low-fat foods is increasing. However, in the absence of fat , altered flavour-matrix interactions result in a dramatic change in flavour profiles (Shamil and Kilcast,. 1 992,· Plug and Haring, 1 993; Hatchwell, 1 996). I n fat-reduced or "light" foods the dominant components are carbohydrates or proteins which interact differently with aroma compounds compared with fat, and thus change the perceived flavour. In addition, most of the fat replacers used in these foods are composed of proteins or carbohydrates or both. A better understanding of the science behind protein-flavour interactions is required for the development of improved food flavour, particularly that of low-fat foods, and for minimising the presence o f off-flavours in protein-containing foods..
(26) 2. Chapter One: Introduction. Understanding the binding of flavour compounds and proteins is important, however, the extent of release o f flavours fro m proteins during consumption is crucial since it affects the flavour perception. Recently, both in vitro (Roberts and A cree, 1 995; Deibler et al. , 200 1 ;. Chung et al. , 2003) and in vivo techniques (Soeting and Heidema, 1 988; Linforth e t al. , 1 996; Taylor and Linforth, 2000; Weel et al. , 2002) have been developed to investigate flavour release from foods. Milk proteins have been found to reduce the in-mouth flavour release and flavour perception because of their interact ions with flavour compounds (Guichard, 2000;. Denker et al. , 2006; Giroux et al. , 2007) . However, only two studies reported on the actual release of flavour compounds from proteins in-mouth (Le Guen and Vree ker, 2003; Weel et. al. , 2003) . Aliphatic aldehydes were found to be partially released from whey protein isolate (WP I ) during consumption (Weel et al. , 2003), whereas alkenals were not released, and methyl ketones were completely released from milk protein concentrate (MPC) (Le Guen and. Vreeker, 2003) . These results show that flavour release is very dependent on the type o f flavour compound. However, very different consumption protocols were used by the authors, making a comparison of results difficult. C learly, further work is needed to elucidate the release of flavour compounds from proteins in-mouth. The objectives of this research were (1). to. determine. binding. parameters. o f the. hydrophobic. flavour. compound,. 2-nonanone, to individual milk proteins (namely, �-lactoglobulin, a-lactalbumin, bovine serum albumin, as l -casein, and �-casein), WPI, and sodium caseinate, using an optimised headspace SPME method fo llowed by GC-FID for the investigation of protein-flavour interactions; (2). to compare the b inding of structurally similar flavour compounds - 2-nonanone, I -nonanal, and trans-2-nonenal - to WPI in aqueous solution, and to investigate the effect of heat and high pressure treatment, and pH on the extent of protein-flavour binding; and. (3). to investigate the in vivo release of the reversibly bound flavour compound, 2-nonanone, from WPI and sodium caseinate using proton-transfer-reaction mass spectrometry ( PTR-MS), and to understand the effect of viscosity on flavour release. in vivo..
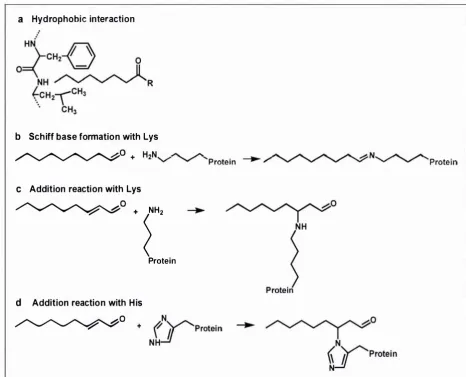
(27) 3. Chapter Two: Literature Review. CHAPTE R TWO : LITE RATU R E REV I EW. 1. The aim of this review is to discuss the flavour binding ability of individual food proteins, with emphasis on milk proteins, and the influence of processing treatments, pH, and ionic strength on protein-flavour binding. Furthermore, the current knowledge on the release of flavour compounds from milk proteins during consumption, and effects of texture on flavour release, are summarised. Methodologies used to investigate protein-flavour interactions and flavour release from proteins are evaluated. Implications of protein-flavour interactions in the development of protein foods, and future research are also considered.. 2. 1. Types of Interactions. Two different types of interaction can occur between proteins and flavour compounds: ( 1 ) reversible (physicochemical) binding, inc luding hydrogen bonds, hydrophobic interactions, and ionic bonds, and (2) irreversible (chemical) binding via covalent linkages, i.e. amide and ester formation, the condensation of aldehydes with amino groups (NH2) ("Schiff base" formation) and sulphydryl (SH) groups, and addition reactions with unsaturated flavour compounds ("Michael addition") (Solms et ai. , 1 9 73; Overbosch et ai. , 1 991; Mottram et ai. ,. 1 996; Meynier et ai. , 2003, 2004) . Examples of typical interactions between flavour compounds and proteins are shown in Figure 2. 1 - 1 . The type o f binding between a protein and a flavour compound depends on the characteristics of both the protein and the flavour, and thus there is no universal mechanism for flavour binding in foods (Solms et ai. , 1 9 73) . However, most flavours show hydrophobic, reversible binding to proteins (Gremli, 1 9 74; Damodaran and Kinsella, 1 980b, 1 981a, b, 1 983; O 'Neill. and Kinsella, 1 98 7b; Pelletier et aI. , 1 998) . Adsorption and absorption also exist but are specific for low-moisture food systems (Maier, 1 9 72, 1 9 73, 1 9 75; Le Thanh et aI. , 1 992;. Landy et aI. , 1 997; Mironov et aI. , 2003), and are not discussed in this review.. 1. Parts of th is chapter have been published previously: Klihn, l , Con sidine, T., and Singh, H. (2006).. I nteractions of m i lk proteins and volatile flavor compounds: Implications in the development of protein foods. Journal of Food Science 7 1 (4): R72-R82 (see Appendix)..
(28) Chapter Two: Literature Review. 4. a. Hyd rophobic interaction. b Sch iff base formation with Lys. �O. �o c. d. +. 'Protein. H2N. /".. /".. 'V". .......,.. ........" 'Protei n. /".. /".. /".. /".. h N� /".. /"... -. ;, .......,. ........" ........" � ........". Addition reaction with Lys. + rProtein o + ('Y'Protein. Addition reaction with H is. �. N. NH. ...!i. Figure 2 . 1 - 1 : Common interactions of proteins and flavou r compounds; (a) hydrophobic interaction between a p rotein and an aliphatic aldehyde or ketone flavo u r; (b) Schiff base fo rmation between I -nonanal and a lysine residue of a protein; (c) addition reaction of trans-2-nonenal and a lysine residu e of a protein; (d ) addition reaction of trans-2-nonenal and a histidine residue of a p rotein.. 2. 2. Flavour Binding by Proteins. 2 . 2 . 1 A n a l ysis of F lavo u r B i n d ing by P rote i n s. Two approaches may be used t o study the interactions between flavour mo lecules and macromo lecules, such as proteins: instrumental techniques and sensory analysis, The systems considered are often very simple, consisting of one flavour compound and one protein, usually in an aqueous so lution, 2.2. 1 . 1. Static (Equilibriu m) Methods. F lavour binding has been examined predominantly under equilibrium conditions, A common technique is equilibrium dialysis which is still commonly used (Damodaran and Kinsella,.
Figure

+7
Related documents
In addition, we aimed to assess the association of chronic glycaemia (HbA1c), acute gly- caemia, illness severity, alkalosis, catecholamine infusion and cardiopulmonary bypass
This study, conducted in a pediatric department of a large teaching hospital in Antananarivo, aimed to assess the levels of ESBL-PE carriage among hospitalized infants -- on
In this study, we investigated the diagnostic performance of QuantiFERON-TB Gold assay (QFT-GIT) according to categories and anatomic sites of EPTB, and identified predictors
Methods: This retrospective cohort study was performed in a 12-bed cardiosurgical intensive care unit (ICU) of a university hospital and included patients consecutively admitted
To evaluate the Type I error rates of our four statistical tests with real learning algorithms, we needed to nd two learning algorithms that had identical performance when trained
In this paper we trace the early history of relativistic su- pertasks, as well as the subsequent discussions of Malament-Hogarth spacetimes as physically-reasonable models
The structure and magnitude of the oceanic heat fluxes throughout the N-ICE2015 campaign are sketched and quantified in Figure 4, summarizing our main findings: storms
Nitri fi cation and sedimentary denitri fi cation occurred near the river mouth, nitri fi cation prevailed further offshore under the plume, and fi nally, phytoplankton
