David Duffy
John FitzGerald
Kevin Timoney
David Byrne
Winter 2013
The
Economic
Research
Institute
was
founded
in
Dublin
in
1960,
with
the
assistance
of
a
grant
from
the
Ford
Foundation
of
New
York.
In
1966
the
remit
of
the
Institute
was
expanded
to
include
social
research,
resulting
in
the
Institute
being
renamed
The
Economic
and
Social
Research
Institute
(ESRI).
In
2010
the
Institute
entered
into
a
strategic
research
alliance
with
Trinity
College
Dublin,
while
retaining
its
status
as
an
independent
research
institute.
The
ESRI
is
governed
by
an
independent
Council
which
acts
as
the
board
of
the
Institute
with
responsibility
for
guaranteeing
its
independence
and
integrity.
The
Institute’s
research
strategy
is
determined
by
the
Council
in
association
with
the
Director
and
staff.
The
research
agenda
seeks
to
contribute
to
three
overarching
and
interconnected
goals,
namely,
economic
growth,
social
progress
and
environmental
sustainability.
The
Institute’s
research
is
disseminated
through
international
and
national
peer
reviewed
journals
and
books,
in
reports
and
books
published
directly
by
the
Institute
itself
and
in
the
Institute’s
working
paper
series.
Researchers
are
responsible
for
the
accuracy
of
their
research.
All
ESRI
books
and
reports
are
peer
reviewed
and
these
publications
and
the
ESRI’s
working
papers
can
be
downloaded
from
the
ESRI
website
at
www.esri.ie
The
Institute’s
research
is
funded
from
a
variety
of
sources
including:
an
annual
grant
‐
in
‐
aid
from
the
Irish
Government;
competitive
research
grants
(both
Irish
and
international);
support
for
agreed
programmes
from
government
departments/agencies
and
commissioned
research
projects
from
public
sector
bodies.
Sponsorship
of
the
Institute’s
activities
by
Irish
business
and
membership
subscriptions
provide
a
minor
source
of
additional
income.
Quarterly
Economic
Commentary
The
Quarterly
Economic
Commentary
analyses
current
economic
trends
and
provides
macro
‐
economic
forecasts
for
the
current
and
following
year.
It
assesses
international
economic
prospects
and
provides
short
‐
term
forecasts
in
the
framework
of
a
consistent
set
of
national
accounts
for
Ireland.
Its
wide
range
of
users
includes
government
departments,
policy
‐
makers,
social
partners,
international
organisations,
academics
and
the
national
and
international
financial
sectors.
Research
Bulletin
The
Research
Bulletin
provides
short
summaries
of
work
published
by
ESRI
staff
and
overviews
of
thematic
areas
covered
by
ESRI
programmes
of
research.
Bulletin
articles
are
designed
to
be
easily
accessible
to
a
wide
readership.
A
reference
or
references
to
the
full
publication
is
included
at
the
end
of
each
Bulletin
article.
An
archive
of
bulletin
articles
will
be
found
at
www.esri.ie/bulletin
Quarterly Economic
Commentary
David Duffy John FitzGerald Kevin Timoney David Byrne
Winter 2013
Special Articles
Research Note
Research Bulletins
Authors
The Commentary is edited by David Duffy and John FitzGerald. David Duffy is a Senior Research Officer, John FitzGerald is a Research Professor, Kevin Timoney and David Byrne are Research Assistants at the Economic and Social Research Institute (ESRI).
The Commentary, Research Notes and Research Bulletin contained within have been accepted for publication by the Institute, which is not responsible for either the content or the views expressed.
Research Bulletins
The following research bulletins have been published on our website:
Evaluation of the Effect of the Power of One Campaign on Natural Gas Consumption – Seán Diffney, Seán Lyons and Laura Malaguzzi Valeri
All Bulletins can be found on our website at
Table of Contents
Summary Table ... ii
Summary ... iii
National Accounts 2012, 2013, 2014 ... vi
CHAPTERS 1 The International Economy ... 1
2 Exports of Goods and Services ... 6
3 Investment ... 8
4 Prices, Consumption and Incomes ... 10
5 Public Finances ... 14
6 The Labour Market ... 16
Box 1: Educational Attainment and the Labour Market ... 19
7 Imports and the Balance of Payments ... 22
8 Monetary Sector Developments ... 24
9 Measures of Growth and Output ... 28
10 General Assessment ... 31
Summary Forecast Tables are contained within the main text. Detailed Forecast Tables are contained in an Appendix. SPECIAL ARTICLES ... 41
Distributional Impact of Tax, Welfare and Public Service Pay Policies: Budget 2014 and Budgets 2009-2014 – Tim Callan, Claire Keane, Michael Savage and John R. Walsh Lost in Transition? The Labour Market Pathways of Long-term Unemployed Individuals in Ireland Pre and Post the Great Recession – Elish Kelly and Seamus McGuinness RESEARCH NOTES ... 73
Summary Table
2010 2011 2012 2013 2014
Output (Real Annual Growth %)
Private Consumer Expenditure 0.9 -1.6 -0.3 0.3 1.5
Public Net Current Expenditure -6.9 -2.8 -3.7 0.3 -1.3
Investment -22.6 -9.5 -1.0 2.1 4.5
Exports 6.4 5.4 1.6 0.3 4.6
Imports 3.6 -0.4 0.0 0.9 3.9
Gross Domestic Product (GDP) -1.1 2.2 0.2 0.3 2.7
Gross National Product (GNP) 0.5 -1.6 1.8 2.0 2.7
Prices (Annual Growth %)
Consumer Price Index (CPI) -1.0 2.6 1.7 0.5 0.8
Growth in Average Hourly Earnings -3.5 0.4 0.8 1.0 1.4
Labour Market
Employment Levels (ILO basis (000s)) 1,882 1,849 1,839 1,884 1,923
Unemployment Levels (ILO basis (000s)) 303 317 316 283 261
Unemployment Rate (as % of Labour Force) 13.9 14.6 14.7 13.1 12.0
Public Finance
General Government Balance (€bn) -48.3 -21.3 -13.5 -11.7 -7.6
General Government Balance (% of GDP) -30.5 -13.1 -8.2 -7.1 -4.4
General Government Debt (% of GDP) 91.2 104.1 117.4 123.7 119.9
External Trade
Balance of Payments Current Account (€bn) 1.8 2.0 7.3 8.2 9.8
Current Account (% of GNP) 1.4 1.5 5.5 6.0 7.0
Demand
Final Demand 1.3 2.2 0.2 0.5 3.2
Domestic Demand -4.4 -1.8 -1.6 0.9 1.4
Domestic Demand (excl. Stocks) -5.0 -3.0 -1.1 0.6 1.4
Summary
The Irish economy has turned the corner and domestic demand in 2013 is estimated to have grown by 0.9 per cent, the first increase in this aggregate since the crisis began. It is a portent of a stronger recovery in 2014 and 2015. On top of this mild recovery in domestic demand, there is a continuing stimulus to the economy from the export sector, in particular from the growth in exports of services. When taken together these developments mean that GNP is likely to have grown by 2 per cent this year and the current-account surplus is likely to have further increased on the 2012 outturn.
We are assuming that the EU economy will return to growth in 2014. The resulting growth in exports should complement the expected growth in domestic demand to produce a growth rate of GNP of around 2.7 per cent in 2014.
The two areas where important new information has become available since we published our last forecast are employment and the public finances.
The labour market is the most useful indicator as to what is happening in the Irish economy today – the Quarterly National Accounts do not give a true picture due to the ending of pharmaceutical patents. Quarterly National Household Survey
(QNHS) data and Live Register data underpin our view that a recovery has begun in the Irish economy. The third quarter figures for employment (and unemployment) were even better than those for the previous three quarters, which also involved substantial growth. This has caused us to revise upwards our estimate of employment growth in 2013 to 2.5 per cent and to revise downwards our forecasts for unemployment next year to 12 per cent of the labour force. In addition, it is clear that employment of those with third-level education is growing particularly rapidly, promising a sustained increase in productivity in the future.
National Accounts 2012
A: Expenditure on Gross National Product
2011 2012 Change in 2012
€bn €bn Value Price Volume
Private Consumer Expenditure 82.4 82.6 0.3 0.6 -0.3
Public Net Current Expenditure 25.7 25.1 -2.4 1.4 -3.7
Gross Fixed Capital Formation 17.3 17.4 1.0 2.0 -1.0
Exports of Goods and Services 167.0 176.7 5.9 4.2 1.6
Physical Changes in Stocks 1.0 0.4
Final Demand 293.3 302.3 3.1 2.8 0.2
less:
Imports of Goods and Services (M) 131.8 137.0 3.9 3.9 0.0
Statistical Discrepancy 1.1 -1.3
GDP at Market Prices 162.6 163.9 0.8 0.7 0.2
Net Factor Payments (F) -31.9 -31.3
GNP at Market Prices 130.7 132.6 1.5 -0.3 1.8
B: Gross National Product by Origin
2011 2012 Change in 2012
€bn €bn €bn %
Agriculture 3.2 2.9 -0.3 -9.5
Non-Agriculture: Wages, etc. 68.3 68.4 0.1 0.1
Other 61.1 59.8 -1.3 -2.2
Adjustments: Stock Appreciation -0.1 -0.1
Statistical Discrepancy -1.1 1.3
Net Domestic Product 131.3 132.3 1.0 0.8
Net Factor Payments -31.9 -31.3 0.6 -2.0
National Income 99.4 101.0 1.6 1.7
Depreciation 16.3 16.4 0.1 0.7
GNP at Factor Cost 115.6 117.4 1.8 1.5
Taxes less Subsidies 15.0 15.3 0.2 1.5
GNP at Market Prices 130.7 132.6 2.0 1.5
C: Balance of Payments on Current Account
2011 2012 Change in 2012
€bn €bn €bn
X – M 35.0 39.6 4.6
F -31.9 -31.3 0.6
Net Transfers -1.2 -1.2 0.0
Balance on Current Account 2.0 7.3 5.2
National Accounts 2013
A: Expenditure on Gross National Product
2012 2013 Change in 2013
€bn €bn Value Price Volume
Private Consumer Expenditure 82.6 83.5 1.0 0.7 0.3
Public Net Current Expenditure 25.1 25.5 1.6 1.3 0.3
Gross Fixed Capital Formation 17.4 18.2 4.3 2.2 2.1
Exports of Goods and Services 176.7 177.9 0.7 0.4 0.3
Physical Changes in Stocks 0.4 0.8
Final Demand 302.3 305.9 1.2 0.7 0.5
less:
Imports of Goods and Services (M) 137.0 139.3 1.7 0.8 0.9
Statistical Discrepancy -1.3 -1.4
GDP at Market Prices 163.9 165.2 0.8 0.5 0.3
Net Factor Payments (F) -31.3 -29.1
GNP at Market Prices 132.6 136.1 2.6 0.6 2.0
B: Gross National Product by Origin
2012 2013 Change in 2013
€bn €bn €bn %
Agriculture 2.9 3.0 0.1 3.0
Non-Agriculture: Wages, etc. 68.4 70.1 1.7 2.5
Other 59.8 58.2 -1.5 -2.5
Adjustments: Stock Appreciation -0.1 -0.1
Statistical Discrepancy 1.3 1.4
Net Domestic Product 132.3 132.6 0.3 0.3
Net Factor Payments -31.3 -29.1 2.2 -6.9
National Income 101.0 103.5 2.5 2.5
Depreciation 16.4 16.4 0.0 0.1
GNP at Factor Cost 117.4 119.9 2.5 2.1
Taxes less Subsidies 15.3 16.2 0.9 5.9
GNP at Market Prices 132.6 136.1 3.4 2.6
C: Balance of Payments on Current Account
2012 2013 Change in 2013
€bn €bn €bn
X – M 39.6 38.5 -1.1
F -31.3 -29.1 2.2
Net Transfers -1.2 -1.3 -0.1
Balance on Current Account 7.3 8.2 0.9
National Accounts 2014
A: Expenditure on Gross National Product
2013 2014 Change in 2014
€bn €bn Value Price Volume
Private Consumer Expenditure 83.5 85.4 2.3 0.8 1.5
Public Net Current Expenditure 25.5 25.3 -0.7 0.6 -1.3
Gross Fixed Capital Formation 18.2 19.6 7.6 3.0 4.5
Exports of Goods and Services 177.9 188.2 5.8 1.1 4.6
Physical Changes in Stocks 0.8 0.8
Final Demand 305.9 319.3 4.4 1.1 3.2
less:
Imports of Goods and Services (M) 139.3 146.9 5.5 1.5 3.9
Statistical Discrepancy -1.4 -1.4
GDP at Market Prices 165.2 171.1 3.6 0.9 2.7
Net Factor Payments (F) -29.1 -30.2
GNP at Market Prices 136.1 140.8 3.5 0.8 2.7
B: Gross National Product by Origin
2013 2014 Change in 2014
€bn €bn €bn %
Agriculture 3.0 3.0 0.1 2.5
Non-Agriculture: Wages, etc. 70.1 72.4 2.3 3.3
Other 58.2 60.6 2.4 4.1
Adjustments: Stock Appreciation -0.1 -0.1
Statistical Discrepancy 1.4 1.4
Net Domestic Product 132.6 137.4 4.8 3.6
Net Factor Payments -29.1 -30.2 -1.1 3.8
National Income 103.5 107.1 3.7 3.5
Depreciation 16.4 16.6 0.2 1.2
GNP at Factor Cost 119.9 123.7 3.9 3.2
Taxes less Subsidies 16.2 17.1 0.9 5.7
GNP at Market Prices 136.1 140.8 4.8 3.5
C: Balance of Payments on Current Account
2013 2014 Change in 2014
€bn €bn €bn
X – M 38.5 41.2 2.7
F -29.1 -30.2 -1.1
Net Transfers -1.3 -1.3 0.0
Balance on Current Account 8.2 9.8 1.6
1
The International Economy
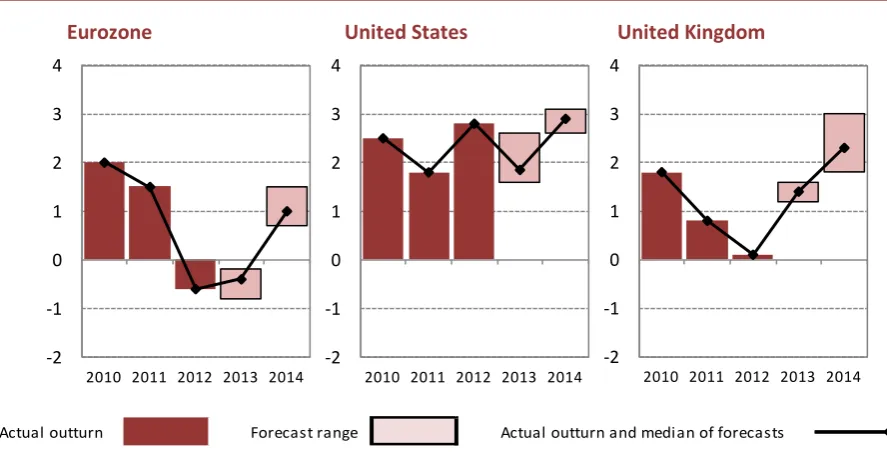
While economic conditions in the Eurozone, the United States and the United Kingdom remain challenging, there has been greater stability and reduced uncertainty evident in 2013 compared to recent years. The economies in the US and UK are estimated to have grown modestly between 1 and 2 per cent this year, with growth prospects for 2014 improving to between 2 and 3 per cent. The situation for the Eurozone remains much less favourable, however, with contraction likely this year and uncertainty surrounding the muted 1 per cent growth forecast for next year. Figure 1 summarises the range of growth forecasts for Ireland’s main trading partners for the present forecast horizon.
FIGURE 1 Real GDP Growth (% change, year-on-year)
Eurozone United States United Kingdom
Sources: FocusEconomics, Eurostat, IMF, OECD, HM Treasury and Federal Reserve.
The Eurozone Economy
Having spent six quarters mired in contraction, the Eurozone economy grew marginally in the second and third quarters of 2013. However, initial estimates showed a weak expansion of just 0.1 per cent in the third quarter, suggesting the expected pick-up in activity for the second half of 2013 may not be realised. The labour market situation in the Eurozone remains challenging and, as shown in Figure 2, the unemployment rate is considerably higher for the currency union excluding Germany.
-2 -1 0 1 2 3 4
2010 2011 2012 2013 2014 -2
-1 0 1 2 3 4
2010 2011 2012 2013 2014 -2
-1 0 1 2 3 4
2010 2011 2012 2013 2014
[image:11.595.76.520.375.604.2]FIGURE 2 Unemployment Rates, 2007 Q1 – 2013 Q2
Source: Eurostat, own calculations.
A number of key areas for reform remain for the currency union. Progress towards decoupling bank and sovereign debt has been hampered by disagreement among member states on detailed implementation since the policy was announced at the June 2012 European Summit. Lengthy negotiations for coalition formation in Germany have contributed to this inertia in the latter half of 2013. Agreement for the Single Supervisory Mechanism was reached in March, and has been followed in December by agreement on the rules for the Single Resolution Mechanism (SRM). The new system will come into force in 2016 and will see individual funds established for each member state, rather than a unified fund. The funds will be supplied through bank contributions and are planned to reach one per cent of a member state’s covered deposits by 2025. The European Central Bank has planned an extensive assessment of systemically important Eurozone banks with risk assessment, asset quality review and stress testing expected before end-2014. Despite recent progress for the Eurozone, considerable uncertainty for recovery in growth remains, and if previous trends continue, there may be downward revisions in prospect for the Eurozone’s 2014 growth forecast.
The US Economy
Despite the closure of its federal government for 16 days in October due to political gridlock, the US economy has strengthened in Quarter 4, 2013. Seasonally adjusted US non-farm payrolls continues to grow at a brisk pace, pushing closer to 137 million in November, the highest level of employment since
0 2 4 6 8 10 12 14 16 Q1Q2Q3Q4Q1Q2Q3Q4Q1Q2Q3Q4Q1Q2Q3Q4Q1Q2Q3Q4Q1Q2Q3Q4Q1Q2
2007 2008 2009 2010 2011 2012 2013
Pe rc ent ag e o f L abo ur F or ce
August 2008. Annual GDP growth picked up in the third quarter to 1.8 per cent, following revised estimates for the second quarter at 1.6 per cent and the first quarter at 1.3 per cent. Forecasts continue to predict GDP growth for 2013 of about 2 per cent, largely unaffected by the government shutdown, accelerating to just under 3 per cent in 2014. A bipartisan budgetary agreement reached in December will avoid spending cuts totalling $60 billion previously scheduled for 2014 and 2015, but the issue of raising the debt ceiling remains unresolved.
FIGURE 3 Three key US Stock Indices, 2008 - Present
Sources: FRED Federal Reserve Bank of St Louis and Yahoo Finance.
There has been much speculation on the commencement of the withdrawal or ‘taper’ of quantitative easing in the US. Following a prolonged period without consensus about the interpretation of economic indicators, a clearer picture of economic recovery is now emerging. If members of the Federal Open Market Committee consider the recovery to be sustainable, in particular with regard to the unemployment rate, the $85 billion per month in quantitative easing is expected to be gradually withdrawn. The term of office of the current Chairman of the Federal Reserve, Ben Bernanke, ends in January 2014. Janet Yellen is set to succeed Bernanke, pending Senate approval. Her nomination and confirmation process have thus far been positively received by investors.
Figure 3 charts three US stock indices since 2008. Nasdaq has recently reached a 13-year high above 4,000, up one-third since the beginning of 2012, whereas the
40 60 80 100 120 140 160 180
Jan-08 Jan-09 Jan-10 Jan-11 Jan-12 Jan-13 Jan-14
Ja
nu
ar
y
20
08
=
1
00
[image:13.595.73.523.223.519.2]Dow Jones has surpassed 16,000 to reach an all-time high. However, it remains to be seen whether such gains will be sustained when monetary policy becomes less accommodative.
The UK Economy
Further improvements in the economy of the United Kingdom have been seen since the last Commentary. The Office for National Statistics (ONS) has estimated growth of 0.8 per cent in GDP in the third quarter, leaving the UK on course for growth of 1.5 per cent for the year. All of the main industrial groupings (agriculture, production, construction and services) showed growth over the period, with the largest rise coming from the employment-intensive construction sector. Services, the largest of these components, now exceeds its pre-crisis output peak.
The UK labour market has continued to improve in 2013. The addition of more than 175,000 jobs during the third quarter caused the employment rate to grow to 71.8 per cent from 71.2 per cent in the previous quarter. The unemployment rate fell by 0.2 percentage points to 7.6 per cent, which represents a four-year low. Improvements in labour force participation have also been observed. Growth in earnings, however, is lagging behind the growth in employment, and has not been keeping pace with inflation. Growth in the Consumer Price Index fell to 2.2 per cent year-on-year in October. This fall was in line with falls seen in the US and Eurozone. The fact that inflation in the UK is the highest in the 28 member states of the European Union, and twice the EU average, implies potential competitiveness losses for the UK. Inflation is, however, close to target. This may allow the Bank of England to continue its loose monetary policy to support the economic recovery.
In August of this year, the Bank of England issued “forward guidance” on the path of monetary policy. It suggested that it would leave the Bank Rate unchanged, at least until the unemployment rate had fallen below 7 per cent. This guidance also applied to its quantitative easing scheme. The Bank did not expect that the unemployment rate would reach that threshold until 2016, but it now seems likely to be achieved sooner.
The World Economy
2
Exports of Goods and Services
As explained in previous Commentaries, the ending of the pharmaceutical ‘patent cliff’ is impacting on Ireland's trade statistics. Official statistics show that the value of Irish merchandise exports was down by €4.8 billion in the first ten months of the year when compared to the same period in 2012. Much of this occurred in the exports of chemicals and related products, down by €4.1 billion in value over the same period. Taking account of these factors and the international environment outlined earlier, it seems likely that merchandise exports will have fallen by about 3.9 per cent in volume and by about 4.1 per cent in value in 2013, broadly in line with our previous forecast.
The Quarterly National Accounts show that services exports continue to exceed service imports, see Figure 4. On the basis of available data, it seems likely that there was a substantial increase in earnings from tourism in 2013, rising by 5 per cent. A number of factors have contributed to this increase, the improvements in the US and UK economy, as well as The Gathering initiative by Tourism Ireland. With regard to other services exports, output data suggest that the sector has
FIGURE 4 Exports and Imports of Goods and Services, Constant Prices
Source: Central Statistics Office, Quarterly National Accounts.
-25,000 -20,000 -15,000 -10,000 -5,000 0 5,000 10,000 15,000 20,000 25,000
Q1 Q2 Q3 Q4 Q1 Q2 Q3 Q4 Q1 Q2 Q3 Q4 Q1 Q2 Q3 Q4 Q1 Q2 Q3 Q4 Q1 Q2
2008 2009 2010 2011 2012 2013
€
m
illio
n
been performing well over the course of the year. We anticipate that other services export growth should be over 4 per cent this year. On the basis of these forecasts we expect that overall exports of goods and services will grow by 0.3 per cent this year. The price deflator for exports looks likely to be moderate this year at just 0.4 per cent, and so the value of exports is estimated to have increased by just 0.7 per cent in 2013.
Looking forward into 2014, we remain hopeful that the long-awaited recovery in the Eurozone economy takes place. Short-term forecasting institutes across Europe expect that world trade growth will increase in 2014 to an annual rate of 4.4 per cent. Also the effects of the ending of the patent for the drug Lipitor on trade data will have fully played out. Thus, we are forecasting some recovery, albeit moderate, in measured merchandise exports, with growth in volume terms of 2 per cent (Table 1). Tourism receipts may show some slowdown in growth to around 4 per cent following the ending of The Gathering, but we anticipate that other services exports will continue to drive Irish export growth. On the basis of trends in this sector and service-sector FDI coming on stream, we anticipate that export growth for this sector will be around 7 per cent next year. Taking these forecasts into account, total exports could increase by 4.6 per cent in 2014 in real terms and by 5.8 per cent in value, implying an export price deflator next year of just over 1 per cent.
TABLE 1 Exports of Goods and Services
2011 2011 2012 2013 2014
Value Volume Change
€ billion % % % %
Merchandise 85.0 3.8 -3.6 -3.9 2.0
Services:
Tourism 3.0 -4.8 -0.2 5.0 4.0
Other Services 78.5 7.6 7.2 4.1 7.0
Total Services 81.5 7.0 6.9 4.1 6.9
Exports of Goods and Services 167.0 5.4 1.6 0.3 4.6
3
Investment
It seems likely that the volume of investment has increased in 2013. While the growth looks set to be moderate, this is the first time that we will have seen an increase in this sector since 2007. However, underneath this overall improvement the various components of investment are displaying quite different trends.
Available indicators suggest that the investment in residential housing remains subdued. It seems likely that housing completions will be approximately 8,200 this year, a decline on 2012. While the number of completions is expected to rise in 2014 the increase will not be large in absolute terms, so the issue of a housing supply constraint is likely to remain a factor in the market over the short term at least.
The low level of supply is contributing to the strong growth in house prices in the Dublin region. In contrast, house prices outside Dublin have remained weak. The Private Residential Tenancies Board (PRTB)/ESRI Rent Index for Quarter 3, 2013 shows a similar picture for the rental market. At the moment we do not view the strength of the Dublin market as the re-emergence of a bubble. The current increases from a low base are taking place after a period of a substantial decline in prices, and the number of transactions remains far below its long-run average. In addition, mortgage drawdowns remain subdued, suggesting the price increases have not been driven by credit growth. As the housing market recovers there may be periods of sharp increases in prices over a short period.
Investment in other building and construction looks likely to have grown this year. Thus, we are forecasting that overall building and construction investment has grown by 2.5 per cent in volume this year and will grow by 6.3 per cent in 2014 (Table 2).
TABLE 2 Gross Fixed Capital Formation, % Change in Volume
2011 2011 2012 2013 2014
Value Volume Change
€ billion % % % %
Housing 3.8 -20.5 -21.4 0.0 13.5
Other Building 5.1 -14.8 7.2 3.1 2.0
Total Building and Construction 9.3 -16.2 -4.1 2.5 6.3
Machinery and Equipment 8.0 -0.9 2.6 1.7 2.4
Total 17.3 -9.5 -1.0 2.1 4.5
4
Prices, Consumption and Incomes
Prices
Inflation rates in the United States, Eurozone and United Kingdom, at 1.0 per cent, 0.9 per cent and 2.2 per cent respectively, are the lowest seen since late-2009. Low and falling inflation appears widespread, prompting fears of deflation. The European Central Bank (ECB) has admitted that the Eurozone may face “a prolonged period of low inflation.” The ECB offered forward guidance in July that interest rates would remain at present or lower levels for an extended period of time. Furthermore, the main refinancing rate was cut in October from 0.5 per cent to 0.25 per cent, reflecting the need to act on the divergence of Eurozone inflation from the target of just under 2 per cent.
Energy prices are a significant driver of the falls in inflation. The United States Energy Information Administration (EIA) forecast in November the price per barrel of Brent Crude oil to fall 2.75 per cent to $106 in December. It further forecast an average price of $103 for 2014. The EIA points to growth in non-OPEC supply of oil, which is outstripping the growth in worldwide consumption, as a cause of the fall in prices. A recent deal between Iran and several world powers regarding its nuclear programme holds the potential to lower oil prices further. Sanctions introduced against Iran in 2012 cut its petroleum exports by up to 60 per cent. The removal of these sanctions should see world oil supply increase as Iran returns to higher output levels.
TABLE 3 Inflation Measures
2011 2012 2013 2014
Annual Change
% % % %
CPI 2.6 1.7 0.5 0.8
Personal Consumption Deflator 1.8 0.6 0.7 0.8
HICP 1.1 2.0 0.6 0.7
Sources: Central Statistics Office and ESRI Forecasts.
consumption. The forecasts for the CPI, the HICP and the personal consumption deflator are included in Table 3. They highlight likely continuing low inflation in 2014.
Consumption
The KBC Ireland/ESRI Consumer Sentiment Index compiles indices based on the individual’s assessment of their current, past and future financial standing and how they view the outlook for the economy and unemployment, for instance. The responses are used to produce an overall index of sentiment. The Consumer Sentiment Index has been strengthening for much of 2013, as shown in Figure 5. Although the monthly index declined from October’s five-year high, the trend of the index (represented by the 3-month moving average) increased for seven consecutive months to November.
Retail sales have remained relatively weak in 2013. The most recent monthly figures (October) show a volume fall of 1.6 per cent for retail sales (excluding the motor trades) with respect to the same month in 2012. The digital TV switchover took place in October 2012, however, and the elevated sales of electrical goods in that month pushed up the Retail Sales Index. Retail sales (excluding motor trades) are slightly higher in volume for the year-to-date with respect to the same period in 2012. While new vehicle registrations have fallen by 2.3 per cent in 2013, growth of 45 per cent in the registration of second-hand vehicles has caused the overall volume of vehicle registrations to increase by 12.4 per cent.
FIGURE 5 Consumer Sentiment
Sources: ESRI/KBC Ireland.
Nationwide UK (Ireland) Savings Index data (produced by the ESRI) show that the share of respondents whose first preference is to spend any surplus money (in excess of their everyday needs) exceeded 10 per cent in the first 11 months of 2013. This share was 8.4 per cent in 2012. In addition, there was a small decline in the share whose first preference for surplus money is to pay down debt, from 51 per cent in 2012 to 48.2 per cent for the first 11 months of 2013. There may be a moderation in the pace of deleveraging should this pattern continue in 2014.
Incomes
As discussed in Chapter 6 of this Commentary, the CSO’s Quarterly National Household Survey showed robust employment growth and a fall in unemployment during the third quarter. This continued a trend seen since the fourth quarter of 2012, with 3.2 per cent annual employment growth. It is our view that employment will continue to grow at a strong pace in 2014. The
Earnings, Hours and Employment Costs Survey shows that average weekly earnings fell by 2.9 per cent in the third quarter, having grown slightly in the previous two quarters. Average hourly earnings fell by 1.8 per cent year-on-year in the third quarter. An important factor in the fall in hourly earnings was the effect of the Haddington Road Agreement on the public sector. Hourly earnings in the private sector were largely unchanged.
40 45 50 55 60 65 70 75 80
Jan-10 Jul-10 Jan-11 Jul-11 Jan-12 Jul-12 Jan-13 Jul-13
Q
ua
rt
er
4
, 2
00
5 =
1
00
As discussed in Box 1, the educational attainment of the employed population has changed considerably over the last year. Employment of graduates is rising rapidly while employment of those with less than a leaving certificate is falling. Because those with higher levels of educational attainment typically earn more than those with lesser qualifications, this change in the educational composition of those employed will tend to raise average earnings for the economy as a whole.
For 2013 we estimate that this will add over 0.5 percentage points to average earnings and a similar amount in 2014. Allowing for some limited rise in weekly earnings in the last quarter of 2013 and in 2014, we expect average earnings at the level of the economy to rise by around 1 per cent in 2013 and by 1.4 per cent in 2014. This analysis informs our view of growth in wages and gross personal income (reported in billions of Euro in Table 4). Total income received is forecast to grow by 4.8 per cent in 2014.
The improving labour market also impacts on our forecasts of current transfers and direct personal taxation. Transfers are forecast to fall by 3 per cent to €23.6 billion, with taxes to increase to €26.2 billion, up 7.7 per cent. Furthermore, the average tax rate is forecast to rise to 22.1 per cent in 2014. Consumption is forecast to rise in 2014 by 2.3 per cent in value to €85.4 billion. The savings ratio is likely to fall moderately in 2014, as shown in Table 4.
TABLE 4 Personal Disposable Income
2011 2012 2013 2014
€bn €bn €bn €bn
Agriculture etc. 3.2 2.9 3.0 3.0
Non-Agricultural Wages 68.3 68.4 70.1 72.4
Other Non-Agricultural Income 13.3 15.9 17.4 19.4
Total Income Received 84.7 87.1 90.4 94.8
Current Transfers 25.3 25.0 24.4 23.6
Gross Personal Income 110.0 112.2 114.8 118.4
Direct Personal Taxes 22.6 23.1 24.3 26.2
Personal Disposable Income 87.4 89.1 90.5 92.2
Consumption 82.4 82.6 83.5 85.4
Personal Savings 5.0 6.5 7.0 6.8
Savings Ratio 5.8 7.3 7.7 7.4
Average Tax Rate (%) 20.5 20.6 21.2 22.1
5
Public Finances
The exchequer returns to end-November show that tax revenue has grown by 4.2 per cent for the year to date. Income tax revenue, including USC, increased by 4.4 per cent, VAT rose by 2.8 per cent, while excise revenue was 6.8 per cent higher. Net expenditure was 4.4 per cent lower, with current expenditure down by 4.1 per cent and capital expenditure 9.3 per cent lower.
Based on the exchequer returns, it is likely that the general government deficit in 2013 will be just over 7 per cent of GDP (Table 5), down substantially from the final deficit of 8.2 per cent in 2012 and well within the target of 7.5 per cent. This represents a significant improvement in the underlying position as 2013 has seen a reduction in charges to the banks for the guarantee amounting to almost €500 million and an additional one-off charge of over €1 billion relating to the winding up of the Irish Bank Resolution Corporation (IBRC). While concerns continue about expenditure levels in health exceeding budget, the indications from the exchequer returns are that some revenue heads will out-perform their targets.
TABLE 5 Public Finances
2012 2013 2013 2014 2014
€bn €bn % change €bn % change
Income
Taxes on income incl. Social insurance 27.3 28.7 5.2 30.6 6.6
Taxes on expenditure 18.0 18.7 3.6 19.6 4.8
Gross trading and investment income 3.0 3.4 13.5 3.0 -11.5
Other Income 3.9 3.4 -13.0 3.3 -0.9
Total receipts : Current 52.2 54.2 3.8 56.5 4.4
Total receipts : Capital 1.4 1.4 3.2 1.4 -0.7
Total receipts - current and capital 53.6 55.6 3.7 57.9 4.3
Expenditure
Sudsidies 1.5 1.3 -14.3 1.3 -1.5
National debt interest 5.9 7.6 27.7 7.8 3.6
Transfer payments 27.5 26.9 -2.2 26.2 -2.7
Expenditure on Goods and Services 26.9 26.8 -0.4 26.6 -0.7
Total expenditure - current 61.9 62.6 1.1 61.9 -1.1
Total expenditure - capital 5.0 4.7 -5.7 3.6 -22.6
Total expenditure - current and capital 66.8 67.3 0.6 65.5 -2.6
General Govt. Balance -13.5 -11.7 -7.6
6
The Labour Market
Since the fourth quarter of 2012, there has been a continuous expansion of employment and reduction in unemployment in Ireland. Improvements have also been evident in the participation rate and the resulting expansion of the labour force. Although substantial net outward migration is expected to continue, the improvement in labour market conditions remains the most concrete evidence of recovering economic activity at present. By this measure, the pace of the recovery has been accelerating over the past year. The Live Register total has been falling steadily since August 2012, while annual employment growth has risen from 0.1 per cent for Quarter 4, 2012 to 3.2 per cent in Quarter 3, 2013.
The latest Quarterly National Household Survey (QNHS) reports employment growth outstripping the reduction in unemployment. In the third quarter of 2013 there was a seasonally adjusted quarterly increase of 22,500 for total employment, compared to a decrease in unemployment of 18,000. From a peak of 15.1 per cent in early 2012, the standardised unemployment rate is currently at 12.5 per cent.
By sector, the range of expansion in employment appears to be broadening. There were 10 sectors showing quarterly employment growth in the third quarter of 2013, and the largest increase was reported for agriculture, forestry and fishing. As discussed in earlier Commentaries from this year, much of this sector’s growth is thought to be the result of Census-related adjustments to the QNHS. (While caution is warranted in analysing the sectoral composition of employment as reported in the QNHS results, the same uncertainty does not apply to aggregate employment. Thus the growth in employment in other sectors is likely to be underestimated in the QNHS.) However, there have been encouraging developments in the primary sector during the year, with prospects improving for Irish dairy and beef exports thanks to EU and international policy changes. Other areas with growing employment include professional, scientific and technical activities, administrative and support services activities, and accommodation and food service activities.
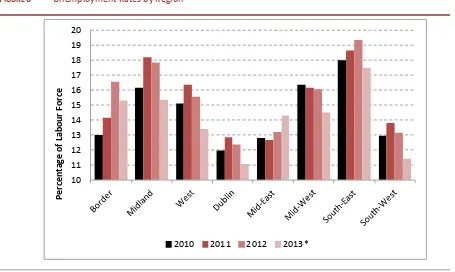
decreases are employment-related in Dublin, the West and the South-West. Figure 7 charts the annual change in youth employment (for those aged 15-24 years). This turned positive in the third quarter of 2013, the first such increase since the final quarter of 2007. From a peak of one in three, the youth unemployment rate has fallen to 26.5 per cent. Much of this reduction is probably due to increased educational participation.
FIGURE 6 Unemployment Rates by Region
Source: Central Statistics Office, Quarterly National Household Survey.
* Annual average assuming no change for Q4 compared to Q3.
With improving momentum in the labour market, we now forecast the rate of unemployment to fall to 12 per cent for 2014, down from 13.1 per cent on average for 2013. The labour force is expected to accelerate its growth in 2014. Unemployment, having fallen below 300,000 in 2013 will then continue to decrease to 261,000 in 2014. The increases in employment this year are expected to be repeated in 2014, with the total at work expected to reach 1.92 million from 1.88 million in 2013. The broad sectoral breakdown of the employment forecasts are shown in Table 6.
10 11 12 13 14 15 16 17 18 19 20
Pe
rc
ent
ag
e o
f L
abo
ur
F
or
ce
[image:27.595.73.528.204.476.2]FIGURE 7 Annual Change in Youth Employment
Source: Central Statistics Office, Quarterly National Household Survey.
TABLE 6 Employment and Unemployment
Annual Averages, 000s
2011 2012 2013 2014
Agriculture 83 86 105 111
Industry 348 336 344 357
of which: Construction 108 102 103 106
Services 1,414 1,415 1,434 1,454
Total at work 1,849 1,839 1,884 1,923
Employment Growth Rate, % -1.8 -0.5 2.5 2.0
Unemployed 317 316 283 261
Labour Force 2,166 2,154 2,162 2,178
Unemployment Rate, % 14.6 14.7 13.1 12.0
Participation Rate, % 60.2 59.9 60.2 60.8
Net Migration -27 -34 -33 -26
Source: Central Statistics Office and ESRI Forecasts.
-90 -80 -70 -60 -50 -40 -30 -20 -10 0 10
Q1 Q2 Q3 Q4 Q1 Q2 Q3 Q4 Q1 Q2 Q3 Q4 Q1 Q2 Q3 Q4 Q1 Q2 Q3 Q4 Q1 Q2 Q3
2008 2009 2010 2011 2012 2013
Tho
us
Box 1: Educational Attainment and the Labour Market
by John FitzGerald
Between the peak of the boom at the end of 2007 and the low point early in 2012, total employment fell by around 16 per cent. Today, total employment stands about 13 per cent below the peak. However, the pattern of change has been very different depending on the educational qualifications of labour market participants.
Figure B.1 shows employment by three levels of education: lower than Leaving Certificate, Leaving Certificate and Post-Leaving Certificates, and third level. In spite of the huge fall in output, employment of graduates has continued to rise throughout the crisis period. Today, the number of people employed who have third-level qualifications is one-eighth higher than it was at the peak of the boom. While the rate of growth of this category of employment has been slower than before the crisis it has, nonetheless, continued at a robust rate throughout the last six years.
FIGURE B.1 Employment by Level of Education
Source: Central Statistics Office, Quarterly National Household Survey.
The picture is very different for employment of those who do not have a Leaving Certificate. As shown in Figure B.1, today employment of those with the least advanced educational qualifications is little over half what it was in 2007. The fall in employment among this category of workers began in 2007 and has continued up to the present. Employment of those with a Leaving Certificate is also down substantially on the 2007 peak – by around 20 per cent. However, the pattern is rather different from those without a Leaving Certificate, the most rapid fall
0 100 200 300 400 500 600 700 800 900
Q1 Q3 Q1 Q3 Q1 Q3 Q1 Q3 Q1 Q3 Q1 Q3 Q1 Q3 Q1 Q3 Q1 Q3 Q1 Q3 Q1 Q3 2003 2004 2005 2006 2007 2008 2009 2010 2011 2012 2013
Th
ou
sa
nd
s
[image:29.595.114.495.303.640.2]occurred in 2009 and it then stabilised so that employment today is similar to what it was in 2010. Clearly the factors driving this category of employment are more complex than in the case of the no qualifications category.
This pattern of change among those with more limited qualifications is not that surprising, given the fact that the building and construction sector has carried the brunt of the fall in employment. Traditionally, those employed in the sector have had more limited educational qualifications than those employed elsewhere in the economy. However, what is more surprising is that the employment of those with third level qualifications has risen continuously throughout the crisis.
Between the peak in 2007 and the latest quarter in 2013, employment of graduates grew by an average of 2.8 per cent a year. (Between 2002 and 2007 it grew by over 8 per cent a year.) This highlights the fact that much of the tradable sector of the economy employing graduates survived the crisis in a reasonably robust state and this is reflected in the signs of economic recovery today. Over the last year growth in graduate employment has returned to 5.3 per cent. It is also notable that the sector of the economy which has traditionally had the highest share of graduate employment has been the public sector. However, over the course of the six years employment in that sector has fallen steadily as a result of the need for fiscal adjustment. That means that the growth in private sector employment of graduates has been particularly robust.
The data published in the QNHS on the population aged 15-64 by level of education also provides interesting evidence consistent with the differential pattern of the change in employment (see Figure B.2). Between the peak of the boom in late 2007 and Quarter 3, 2013 the population aged 15-64 with less than a Leaving Certificate fell by 17 per cent. However, the ESRI’s Demographic Model would suggest that with no net migration the population with no leaving cert would have fallen by only 10 per cent over that period.1 This would suggest substantial emigration among this
group of the population. This would be a reversal of the pattern of emigration since the mid-1980s, where migration tended to be concentrated among those with the highest level of educational qualifications (Fahey, FitzGerald and Maître, 1997)2.
However, the explanation may lie in the fact that the major job losses occurred among those in the building industry, traditionally a sector with a mobile population. It was the sector with one of the highest shares of non-Irish workers in 2007.
1 The model takes account of the ageing of the population. As the older cohorts retire and are replaced by younger
better educated cohorts there is a natural process leading to a reduction in the population with no qualifications. Similarly, with no migration, the ageing process will see a rise in the share of graduates in the population.
2 Fahey, T. J. FitzGerald, and B. Maitre, 1997, “The Economic and Social Implications of Demographic Change”, Journal
FIGURE B.2 Population Aged 15-64 by Level of Education
Source: Central Statistics Office, Quarterly National Household Survey.
Over the period 2007-13 the observed change in the population with a Leaving Cert. was close to what would have been suggested by the ESRI’s Demographic Model – suggesting little net migration among this cohort of the population. Finally, in the absence of net migration, the Demographic Model would suggest a growth in the population with third-level qualifications over the same period of over 10 per cent. In fact, that population rose by 22 per cent over the six years. This would suggest substantial net immigration of graduates over the crisis period.
The implications of the changing pattern of employment growth for 2014 and 2015 are positive. The rapid growth in graduate employment, already seen in the year to Quarter 3, 2013 is likely to continue. However, it can also be anticipated that, with some recovery in the building and construction sector, there may be a return to growth in employment in those with a Leaving Certificate or lesser qualifications. These developments would also be likely to reduce the level of net emigration in the coming years.
0 200 400 600 800 1,000 1,200 1,400
Q1 Q3 Q1 Q3 Q1 Q3 Q1 Q3 Q1 Q3 Q1 Q3 Q1 Q3 Q1 Q3 Q1 Q3 Q1 Q3 Q1 Q3 2003 2004 2005 2006 2007 2008 2009 2010 2011 2012 2013
Th
ou
sa
nd
s
7
Imports and the Balance of Payments
Imports
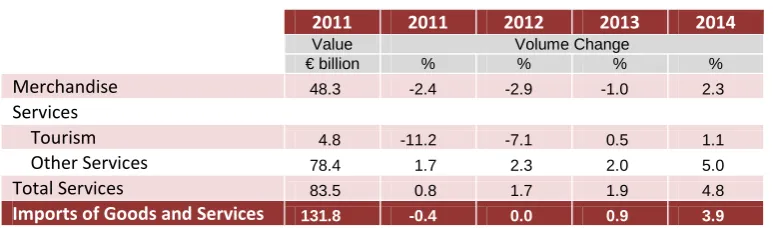
The value of merchandise imports was close to 2 per cent lower in the first nine months of 2013 than in the corresponding period of 2012. Imports of capital goods and goods for consumption were weaker, although in the case of consumption goods the decline was marginal, while imports of intermediate goods grew. On the assumption that these trends continue over the closing months of the year we estimate that merchandise imports will be marginally lower, declining by 1.0 per cent in 2013 in volume terms. With merchandise import prices showing a moderate increase on 2013 the value of merchandise imports is likely to have weakened by about 0.7 per cent this year.
[image:32.595.106.493.535.649.2]Based on available indicators, it seems likely that tourism spending overseas increased moderately in 2013 following a number of years of decline. Other service imports, which include royalty payments, grew in the first half of the year, and are estimated to have risen by 2 per cent in volume in the year as a whole. Thus, imports of goods and services are estimated to have increased by just under 1 per cent in volume and by 1.7 per cent in value in 2013, as shown in Table 7.
TABLE 7 Imports of Goods and Services
2011 2011 2012 2013 2014
Value Volume Change
€ billion % % % %
Merchandise 48.3 -2.4 -2.9 -1.0 2.3
Services
Tourism 4.8 -11.2 -7.1 0.5 1.1
Other Services 78.4 1.7 2.3 2.0 5.0
Total Services 83.5 0.8 1.7 1.9 4.8
Imports of Goods and Services 131.8 -0.4 0.0 0.9 3.9
[image:32.595.104.493.535.650.2]services are forecast to grow by 3.9 per cent in volume terms in 2014 and by 5.5 per cent in value.
Balance of Payments
Our estimated values of exports and imports show that the merchandise trade balance is likely to have fallen by close to 9 per cent, while the trade balance for services has risen in 2013. Both of these movements reflect the impact of the pharmaceutical ‘patent cliff’ on the value of Ireland’s trade as discussed in the previous Commentary and FitzGerald (2013) and in Dalton and Enright (2013). Thus, the surplus on total trade in goods and services is estimated to have fallen by close to €1 billion in 2013 to €38.5 billion. The impact of the ‘patent cliff’ means that we expect net factor flows to be lower in 2013 than in 2012, amounting to €28.9 billion reflecting lower pharmaceutical sector profits. These net outflows are forecast to increase to €30 billion in 2014. Despite this growth, the level is expected to remain lower than the level in 2012. When our forecasts for current transfers are included we are forecasting that the current account surplus will be €8.3 billion in 2013, the equivalent of 5 per cent of GDP and rise to 5.8 per cent of GDP in 2014, approximately €10 billion. Taking account of the impact of redomiciled plcs reduces the current account surplus, although it remains positive, Figure 8.3
FIGURE 8 Current Account of the Balance of Payments, Adjusted for Re-domiciled PLCs
Source: Central Statistics Office and FitzGerald (2013).
3 See FitzGerald, J. (2013) “The Effect of Redomiciled Plcs on GNP and the Irish Balance of Payments”, Dublin: The
Economic and Social Research Institute. Research Note 2013/1/2.
-8 -6 -4 -2 0 2 4 6 8
2005 2006 2007 2008 2009 2010 2011 2012 2013 2014
%
o
f GN
P
8
Monetary Sector Developments
Bank Funding
The funding situation of the Irish banking sector has continued to improve over the course of 2013. A reduced sense of uncertainty has prevailed since the latter half of 2012, when a number of key developments took place assisting the stability of the Eurozone. Following decisive action by the European Central Bank (ECB) to restore confidence and financial stability for the Eurozone (discussed in previous Commentaries), there has been an improvement in the funding profile for the Irish banking sector, with broadly growing deposits and falling reliance on Euro System lending. Figure 9 shows that the borrowing from the Euro System has declined consistently since 2010. At the current pace of decline, it may return to pre-crisis levels in 2014. The restructuring of the promissory notes and Exceptional Liquidity Assistance (ELA) have accelerated the reduction in the banking system’s Total Net External Liabilities, the sum of the Net Foreign Liability and the liabilities to the Central Bank and Euro System. This is now close to balance.
FIGURE 9 Net Foreign Liabilities of the Banking System, January 2003 – October 2013
Source: Central Bank of Ireland, Money and Bank Statistics.
Note: ELA relating to the promissory notes was withdrawn following the restructuring transaction in February 2013.
-75 -50 -25 0 25 50 75 100 125 150 175 200
Ja
n
Ju
n
No
v
Apr Sep Feb Jul Dec May Oct Mar Aug Jan Jun vNo Apr Sep Feb Jul Dec May Oct Mar Aug Jan Jun
2003 2004 2005 2006 2007 2008 2009 2010 2011 2012 2013
€
billio
n
Adjusting for non-transaction related effects (including revaluations and exchange rate movements), household deposits have decreased by just under €400 million in the first ten months of 2013, while NFC deposits have increased by €1.9 billion. Despite the modest decrease in household deposits for the year to date, this represents a broad stabilisation compared to previous years. The weighted average of interest rates offered by banks to attract term deposits has fallen steadily since mid-2012, and currently lies below the comparable Eurozone rate; this trend has been supportive to improvements in bank net interest margins.
Meanwhile, encouraging developments during 2013 for the two pillar Irish banks have improved their ability to attract investor funding at more favourable interest rates. For Bank of Ireland, the €1 billion State-held contingent convertible bond was successfully sold in January, and during the year several covered bond issuances have taken place. In December, €1.8 billion in State-held preference shares were repaid to the Exchequer, partly funded by €537 million in newly issued ordinary shares. Elsewhere, AIB floated €500 million in 3.5-year Asset-Covered Securities (ACS) in January, and in September issued €500 million in covered bonds with five-year maturity. A further €500 million in term funding secured by credit card receivables was raised in November. More recently, €500 million in senior unsecured debt was issued, the first unguaranteed re-entry into wholesale funding markets since 2009.
These positive funding developments notwithstanding, the position of the banking sector in Ireland remains challenging on a number of fronts. Still-rising levels of long-term mortgage arrears (discussed further below in Bank Lending), and the possibility that further capital injections might possibly be required in the future, present difficulties as the sector attempts to recover profitability. The outcome of the ECB’s stress testing in 2014 will ultimately determine the extent to which Irish banks may require additional capital. The preliminary results of the asset quality review by the Central Bank of Ireland (CBI) were disclosed, with varying degrees of detail, in early December. As a result of this preliminary review, each of the banks under scrutiny require additional provisions for losses.
Bank Lending
al. (2013)4 has highlighted the sectoral variance in lending patterns, and there
may be a rising tendency by SMEs to source non-bank financing to boost capital.
FIGURE 10 Annual Change in Private-Sector Lending for Households and Non-Financial Coporations
Source: Central Bank of Ireland, Money and Bank Statistics. * 2013 data available up to end-October.
However, a key factor determining banks’ ability to lend concerns the continuing uncertainty over non-performing loans, in particular those made prior to the crisis where negative equity is involved. Recent CBI data show a stabilisation in mortgage arrears in the third quarter of 2013, with the outstanding balance of all Principal Dwelling Houses (PDH) accounts in arrears falling for the first time since the series began in Quarter 3, 2009. The decrease included all lengths of arrears, except those more than two years behind on repayments. The number of arrears cases for Buy-to-Let (BTL) accounts, however, continued with an overall increase, though more encouragingly the flow of early arrears (up to 180 days overdue) fell compared to the previous quarter. Figure 11 below shows the stabilisation of mortgage arrears for PDH accounts in recent quarters.
4 O’Toole, C. M., Gerlach-Kristen, P. and O’Connell, B. (2013). “SME Debt and Interest Costs in Ireland,” QEC Research
Notes 2013/2/3, Dublin: Economic and Social Research Institute (ESRI).
-10,000 -5,000 0 5,000 10,000 15,000 20,000 25,000 30,000 35,000 40,000
2004 2005 2006 2007 2008 2009 2010 2011 2012 2013*
€
m
illio
n
FIGURE 11 Quarterly Change in PDH Mortgage Arrears: Overall Balance and Accounts
Source: Central Bank of Ireland, Money and Bank Statistics.
To support economic recovery, and to replenish the very low level of investment currently seen, it is essential that credit be made available to households and businesses. Accordingly, the theme of credit availability has featured prominently in contemporary research on the Irish economy. The implications of ongoing credit constraints were considered in the Medium-Term Review published in July 2013. The analysis in the Review suggested that, if the problems in the banking system are not addressed and if credit constraints are allowed to persist into the medium term, this could see investment being 16 per cent lower than potential in 2020.
-4,000 0 4,000 8,000 12,000 16,000
-500 0 500 1,000 1,500 2,000
Q1 Q2 Q3 Q4 Q1 Q2 Q3 Q4 Q1 Q2 Q3
2011 2012 2013
9
Measures of Growth and Output
GNP and GDP
As discussed in detail in the last Commentary, it is difficult at present to measure the trend in real activity in the Irish economy. The main factor behind this difficulty is how the pharmaceutical ‘patent cliff’ has impacted on trade, industrial output and GDP (see FitzGerald, 2013, and Dalton and Enright, 2013, for a discussion of the impact).
The impact of the ‘patent cliff’ on exports, services imports and industrial output means that we expect real GDP will increase by less than 0.5 per cent this year. However, the impact of the ‘patent cliff’ on GNP is likely to be much lower reflecting reduced profit outflows. QNHS data on employment growth suggests a higher level of activity in the economy than portrayed by the GDP numbers consistent with the much higher growth in GNP shown in the first two quarters national accounts numbers. If our estimates prove correct, then the Irish economy should record growth of 2 per cent in 2013, as measured by GNP.
The international environment remains important for Ireland’s economic outlook. Final demand is expected to have risen by 0.5 per cent in 2013. This increase was primarily driven by exports. However, there are signs of some recovery in domestic demand. If the forecasts for world economy activity and trade growth are realised next year, then the Irish economy should see a further expansion in GNP growth to 2.7 per cent in volume terms. While exports will continue to make the main contribution to growth, there will be some rebalancing as domestic demand starts to make a greater contribution.
Output
CSO data on the agricultural sector, coupled with data showing an increase in employment, suggests that output in the sector expanded in 2013. Assuming there are no unseasonal weather patterns in 2014 the expansion in output is forecast to continue, with output in the sector increasing by 1.2 per cent.
Production Index from the CSO shows that manufacturing output in the ten months to October was 2.6 per cent lower compared with the same period in 2012. Sub-indices show that this decline was concentrated in the “modern” sector, where output was down by 4.2 per cent. In contrast, the traditional sector recorded growth of 0.8 per cent. Timoney (2013)5 re-weights the industrial
production index by labour cost share and finds that over the period manufacturing output declined by a more moderate 0.7 per cent, see Figure 12. While a decline of 6.6 per cent is forecast for the sector as a whole, the re-weighted index suggests that when adjustment is made to take account of the high value added of the pharmaceutical sector, output for industry is more stable. As shown in Table 8 industrial output growth is forecast to improve to 1 per cent in 2014.
FIGURE 12 Industrial Production Index Weighted by GVA and Labour Costs
Source: Central Statistics Office, Industrial Production and Turnover Index and Timoney (2013).
Given our forecast of continued growth in service sector exports and the increases in private sector service employment recorded in the QNHS for the first nine months of the year it seems likely that output from this sector has shown strong growth in 2013. This is consistent with the data from the Monthly Services Index showing that the value of output rose by 1.9 per cent in the ten months to October when compared to 2012. It is also consistent with the substantial positive carryover in services sector output shown in the Quarterly National
5 Timoney , K. (2013). “An Alternative Index of Industrial Production for Ireland,” QEC Research Notes, 2013/2/2,
Dublin: Economic and Social Research Institute.
85 90 95 100 105 110 115
2005M01 2007M01 2009M01 2011M01 2013M01
Ba
se
2
00
5
= 1
00
Accounts for the first two quarters of 2013. Thus growth of 3.0 per cent in services output is forecast for 2013. On the basis that these trends continue and world activity levels increase as anticipated in 2014 a growth in output of 3.5 per cent is forecast for the services sector.
TABLE 8 Industry and Output
2011 2011 2012 2013 2014
Value Volume Change
€ billion % % % %
Agriculture 3.9 -1.4 -12.6 -2.2 1.2
Industry 38.5 3.7 -0.3 -6.6 1.0
Distribution, Transport, Software
and Communications 35.6 0.5 -0.6 3.3 4.3
Public Administration and Defence 6.5 -6.0 -6.3 -3.3 -2.0
Other Services 61.7 -0.2 2.7 3.0 3.5