Statistics
in focus
AGRICULTURE AND
FISHERIES
22/2007
Agriculture
Authors
György
BENOIST
Pol MARQUER
[image:1.595.4.199.3.492.2]C o n t e n t s
Table 1 – Labour force by size of
the farms……….3
Table 2 – Agricultural holdings by
size……….….4
Table 3 – Land use by size of the
farms………..……5
[image:1.595.218.572.492.690.2]Table 4 – Livestock by size of the
farms………..……6
Table 5 – Subsistence farming...7
Fa r m s t r u c t u r e i n I t a l y – 2 0 0 5
42% of the holders are aged 65 or more
This Statistics in Focus is part of a series of country-specific publications on
the results of the Farm Structure Survey (FSS) 2005. It provides a brief but
nevertheless comprehensive insight into the farm structure in Italy. A similar
publication was issued in March 2005 presenting the results of the FSS 2003
in Italy.
* * *
At the end of 2005 in Italy, about 1.38 million* agricultural holdings had an
economic size of at least 1 European Size Unit (ESU).
- These holdings employed 1.27 million AWUs (annual work units), the
equivalent of 1.27 million thousand persons working full time;
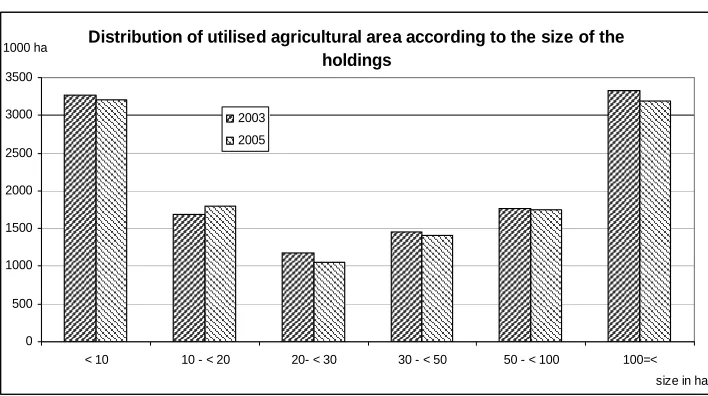
- they made use of about 12.4 million ha of agricultural area, which is on
average 9 ha per holding (compared to 8.2 ha in 2003).
Among these 1.38 million agricultural holdings
- 64% made use of less than one AWU, while 12% made use of 2 or more
AWUs;
- 67% used less than 5 ha agricultural area, while 1% used 100 ha or more;
- 19% were holdings of the type specialist olives, 15% specialist cereals, oil
seed and protein crops, 12% specialist vineyards, 10% were engaged in
mixed cropping and 10% were general field cropping;
- 50% of their agricultural area was situated in less favoured or mountain
areas;
- 3% were organic farms;
- 25% were producing mainly for their own consumption;
- 15% benefited from direct investment aid.
Among the 1.35 million
sole holders
- 30% were women;
- 65% were aged 55 or more, and only 4% were younger than 35 years;
- 23% had another gainful activity as their major occupation.
Distribution of utilised agricultural area according to the size of the
holdings
0 500 1000 1500 2000 2500 3000 3500
< 10 10 - < 20 20- < 30 30 - < 50 50 - < 100 100=< size in ha 1000 ha
2003 2005
Due to differences in the threshold across Member States, the total number of farms is
not comparable between countries. This is why the present analysis, including Tables
1-4 and the graphs focus on holdings of at least one ESU. See methodological notes
for more information on the concept of the ESU.
(
#
Manuscript completed on: 16.02.2007 Data extracted on: 16.01.2007 ISSN 1977-0316
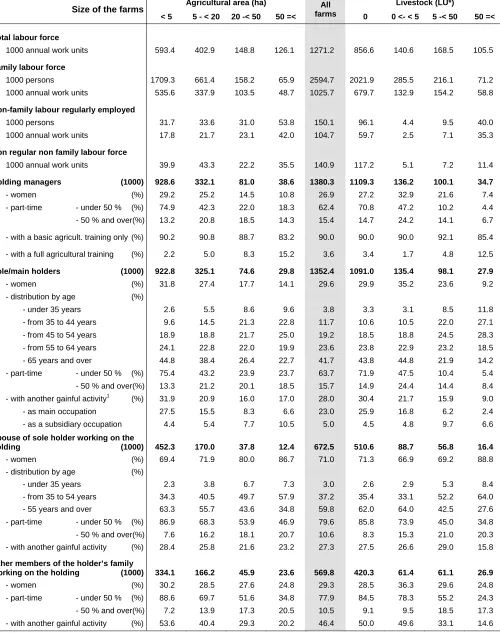
90
1000 persons
>= 65
55 - 64
45 - 54
35 - 44
< 35
1000 persons
men women
Family labour force
Age (years)
180 90
270 360
450 180 270 360
holders spouses other family members
Tractor use by utilised agricultural area categories
0% 20% 40% 60% 80% 100%
< 5 5 - < 20 20 - < 50 >= 50 ha
no tracto r
no t-o wned
o wn
Non Family labour force
245570 AWUs
Agricultural labour force
Family labour force
2594660 persons of which 40% women 1025650 AWUs
Working full time 290720 persons
Working part time 1061640 persons
Not working on farm 0 persons
Working full time 66070 persons
Working part time 503710 persons
Working full time 67400 persons
Working part time 82680 persons Working full time
66070 persons
Working part time 606460 persons
Other family members 569780 persons of which 29% women 192570 AWUs
… regular
150080 persons of which 23% women 104650 AWUs
Holders
1352360 persons of which 30% women 617820 AWUs
Spouses of the sole holders 672520 persons of which 71% women 215260 AWUs
… non regular 140920 AWUs
———————————————————————— 22/200 — Agriculture and fisheries — St a t i s t i c s i n f o c u s 3
#"
Italy – 2005
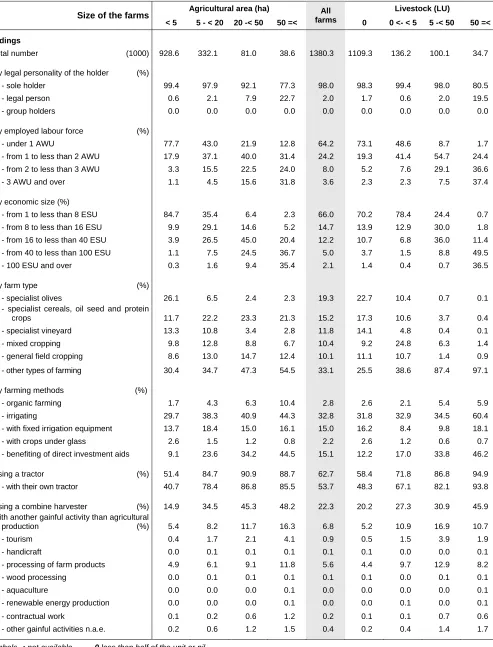
Table 1 – Labour force by size of the farms
Agricultural area (ha) Livestock (LU*)
Size of the farms
< 5 5 - < 20 20 -< 50 50 =<
All
farms 0 0 <- < 5 5 -< 50 50 =<
Total labour force
1000 annual work units 593.4 402.9 148.8 126.1 1271.2 856.6 140.6 168.5 105.5
Family labour force
1000 persons 1709.3 661.4 158.2 65.9 2594.7 2021.9 285.5 216.1 71.2
1000 annual work units 535.6 337.9 103.5 48.7 1025.7 679.7 132.9 154.2 58.8
Non-family labour regularly employed
1000 persons 31.7 33.6 31.0 53.8 150.1 96.1 4.4 9.5 40.0
1000 annual work units 17.8 21.7 23.1 42.0 104.7 59.7 2.5 7.1 35.3
Non regular non family labour force
1000 annual work units 39.9 43.3 22.2 35.5 140.9 117.2 5.1 7.2 11.4
Holding managers (1000) 928.6 332.1 81.0 38.6 1380.3 1109.3 136.2 100.1 34.7
- women (%) 29.2 25.2 14.5 10.8 26.9 27.2 32.9 21.6 7.4
- part-time - under 50 % (%) 74.9 42.3 22.0 18.3 62.4 70.8 47.2 10.2 4.4
- 50 % and over(%) 13.2 20.8 18.5 14.3 15.4 14.7 24.2 14.1 6.7
- with a basic agricult. training only (%) 90.2 90.8 88.7 83.2 90.0 90.0 90.0 92.1 85.4
- with a full agricultural training (%) 2.2 5.0 8.3 15.2 3.6 3.4 1.7 4.8 12.5
Sole/main holders (1000) 922.8 325.1 74.6 29.8 1352.4 1091.0 135.4 98.1 27.9
- women (%) 31.8 27.4 17.7 14.1 29.6 29.9 35.2 23.6 9.2
- distribution by age (%)
- under 35 years 2.6 5.5 8.6 9.6 3.8 3.3 3.1 8.5 11.8
- from 35 to 44 years 9.6 14.5 21.3 22.8 11.7 10.6 10.5 22.0 27.1
- from 45 to 54 years 18.9 18.8 21.7 25.0 19.2 18.5 18.8 24.5 28.3
- from 55 to 64 years 24.1 22.8 22.0 19.9 23.6 23.8 22.9 23.2 18.5
- 65 years and over 44.8 38.4 26.4 22.7 41.7 43.8 44.8 21.9 14.2
- part-time - under 50 % (%) 75.4 43.2 23.9 23.7 63.7 71.9 47.5 10.4 5.4
- 50 % and over(%) 13.3 21.2 20.1 18.5 15.7 14.9 24.4 14.4 8.4
- with another gainful activity1 (%) 31.9 20.9 16.0 17.0 28.0 30.4 21.7 15.9 9.0
- as main occupation 27.5 15.5 8.3 6.6 23.0 25.9 16.8 6.2 2.4
- as a subsidiary occupation 4.4 5.4 7.7 10.5 5.0 4.5 4.8 9.7 6.6
Spouse of sole holder working on the
holding (1000) 452.3 170.0 37.8 12.4 672.5 510.6 88.7 56.8 16.4
- women (%) 69.4 71.9 80.0 86.7 71.0 71.3 66.9 69.2 88.8
- distribution by age (%)
- under 35 years 2.3 3.8 6.7 7.3 3.0 2.6 2.9 5.3 8.4
- from 35 to 54 years 34.3 40.5 49.7 57.9 37.2 35.4 33.1 52.2 64.0
- 55 years and over 63.3 55.7 43.6 34.8 59.8 62.0 64.0 42.5 27.6
- part-time - under 50 % (%) 86.9 68.3 53.9 46.9 79.6 85.8 73.9 45.0 34.8
- 50 % and over(%) 7.6 16.2 18.1 20.7 10.6 8.3 15.3 21.0 20.3
- with another gainful activity (%) 28.4 25.8 21.6 23.2 27.3 27.5 26.6 29.0 15.8
Other members of the holder’s family
working on the holding (1000) 334.1 166.2 45.9 23.6 569.8 420.3 61.4 61.1 26.9
- women (%) 30.2 28.5 27.6 24.8 29.3 28.5 36.3 29.6 24.8
- part-time - under 50 % (%) 88.6 69.7 51.6 34.8 77.9 84.5 78.3 55.2 24.3
- 50 % and over(%) 7.2 13.9 17.3 20.5 10.5 9.1 9.5 18.5 17.3
- with another gainful activity (%) 53.6 40.4 29.3 20.2 46.4 50.0 49.6 33.1 14.6
Symbols : not available 0 less than half of the unit or nil * LU = Livestock Unit
1
[image:3.595.51.551.105.738.2]4 St a t i s t i c s i n f o c u s — Agriculture and fisheries — 22/200 —————————————————————————
#
Italy – 2005
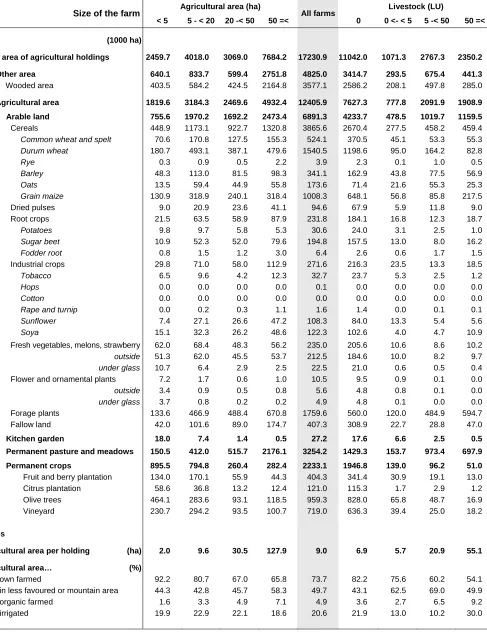
Table 2 – Agricultural holdings by size
Agricultural area (ha) Livestock (LU)
Size of the farms
< 5 5 - < 20 20 -< 50 50 =<
All
farms 0 0 <- < 5 5 -< 50 50 =<
Holdings
- total number (1000) 928.6 332.1 81.0 38.6 1380.3 1109.3 136.2 100.1 34.7
- by legal personality of the holder (%)
- sole holder 99.4 97.9 92.1 77.3 98.0 98.3 99.4 98.0 80.5
- legal person 0.6 2.1 7.9 22.7 2.0 1.7 0.6 2.0 19.5
- group holders 0.0 0.0 0.0 0.0 0.0 0.0 0.0 0.0 0.0
- by employed labour force (%)
- under 1 AWU 77.7 43.0 21.9 12.8 64.2 73.1 48.6 8.7 1.7
- from 1 to less than 2 AWU 17.9 37.1 40.0 31.4 24.2 19.3 41.4 54.7 24.4
- from 2 to less than 3 AWU 3.3 15.5 22.5 24.0 8.0 5.2 7.6 29.1 36.6
- 3 AWU and over 1.1 4.5 15.6 31.8 3.6 2.3 2.3 7.5 37.4
- by economic size (%)
- from 1 to less than 8 ESU 84.7 35.4 6.4 2.3 66.0 70.2 78.4 24.4 0.7
- from 8 to less than 16 ESU 9.9 29.1 14.6 5.2 14.7 13.9 12.9 30.0 1.8
- from 16 to less than 40 ESU 3.9 26.5 45.0 20.4 12.2 10.7 6.8 36.0 11.4
- from 40 to less than 100 ESU 1.1 7.5 24.5 36.7 5.0 3.7 1.5 8.8 49.5
- 100 ESU and over 0.3 1.6 9.4 35.4 2.1 1.4 0.4 0.7 36.5
- by farm type (%)
- specialist olives 26.1 6.5 2.4 2.3 19.3 22.7 10.4 0.7 0.1
- specialist cereals, oil seed and protein
crops 11.7 22.2 23.3 21.3 15.2 17.3 10.6 3.7 0.4
- specialist vineyard 13.3 10.8 3.4 2.8 11.8 14.1 4.8 0.4 0.1
- mixed cropping 9.8 12.8 8.8 6.7 10.4 9.2 24.8 6.3 1.4
- general field cropping 8.6 13.0 14.7 12.4 10.1 11.1 10.7 1.4 0.9
- other types of farming 30.4 34.7 47.3 54.5 33.1 25.5 38.6 87.4 97.1
- by farming methods (%)
- organic farming 1.7 4.3 6.3 10.4 2.8 2.6 2.1 5.4 5.9
- irrigating 29.7 38.3 40.9 44.3 32.8 31.8 32.9 34.5 60.4
- with fixed irrigation equipment 13.7 18.4 15.0 16.1 15.0 16.2 8.4 9.8 18.1
- with crops under glass 2.6 1.5 1.2 0.8 2.2 2.6 1.2 0.6 0.7
- benefiting of direct investment aids 9.1 23.6 34.2 44.5 15.1 12.2 17.0 33.8 46.2
- using a tractor (%) 51.4 84.7 90.9 88.7 62.7 58.4 71.8 86.8 94.9
- with their own tractor 40.7 78.4 86.8 85.5 53.7 48.3 67.1 82.1 93.8
- using a combine harvester (%) 14.9 34.5 45.3 48.2 22.3 20.2 27.3 30.9 45.9
- with another gainful activity than agricultural
production (%) 5.4 8.2 11.7 16.3 6.8 5.2 10.9 16.9 10.7
- tourism 0.4 1.7 2.1 4.1 0.9 0.5 1.5 3.9 1.9
- handicraft 0.0 0.1 0.1 0.1 0.1 0.1 0.0 0.0 0.1
- processing of farm products 4.9 6.1 9.1 11.8 5.6 4.4 9.7 12.9 8.2
- wood processing 0.0 0.1 0.1 0.1 0.1 0.1 0.0 0.1 0.1
- aquaculture 0.0 0.0 0.0 0.1 0.0 0.0 0.0 0.0 0.1
- renewable energy production 0.0 0.0 0.0 0.1 0.0 0.0 0.1 0.0 0.1
- contractual work 0.1 0.2 0.6 1.2 0.2 0.1 0.1 0.7 0.6
- other gainful activities n.a.e. 0.2 0.6 1.2 1.5 0.4 0.2 0.4 1.4 1.7
[image:4.595.56.549.99.746.2]———————————————————————— 22/200 — Agriculture and fisheries — St a t i s t i c s i n f o c u s 5
#"
Italy – 2005
Table 3 – Land use by size of the farms
Agricultural area (ha) Livestock (LU)
Size of the farm
< 5 5 - < 20 20 -< 50 50 =< All farms 0 0 <- < 5 5 -< 50 50 =<
Area (1000 ha)
Total area of agricultural holdings 2459.7 4018.0 3069.0 7684.2 17230.9 11042.0 1071.3 2767.3 2350.2
Other area 640.1 833.7 599.4 2751.8 4825.0 3414.7 293.5 675.4 441.3
Wooded area 403.5 584.2 424.5 2164.8 3577.1 2586.2 208.1 497.8 285.0
Agricultural area 1819.6 3184.3 2469.6 4932.4 12405.9 7627.3 777.8 2091.9 1908.9
Arable land 755.6 1970.2 1692.2 2473.4 6891.3 4233.7 478.5 1019.7 1159.5
Cereals 448.9 1173.1 922.7 1320.8 3865.6 2670.4 277.5 458.2 459.4
Common wheat and spelt 70.6 170.8 127.5 155.3 524.1 370.5 45.1 53.3 55.3
Durum wheat 180.7 493.1 387.1 479.6 1540.5 1198.6 95.0 164.2 82.8
Rye 0.3 0.9 0.5 2.2 3.9 2.3 0.1 1.0 0.5
Barley 48.3 113.0 81.5 98.3 341.1 162.9 43.8 77.5 56.9
Oats 13.5 59.4 44.9 55.8 173.6 71.4 21.6 55.3 25.3
Grain maize 130.9 318.9 240.1 318.4 1008.3 648.1 56.8 85.8 217.5
Dried pulses 9.0 20.9 23.6 41.1 94.6 67.9 5.9 11.8 9.0
Root crops 21.5 63.5 58.9 87.9 231.8 184.1 16.8 12.3 18.7
Potatoes 9.8 9.7 5.8 5.3 30.6 24.0 3.1 2.5 1.0
Sugar beet 10.9 52.3 52.0 79.6 194.8 157.5 13.0 8.0 16.2
Fodder root 0.8 1.5 1.2 3.0 6.4 2.6 0.6 1.7 1.5
Industrial crops 29.8 71.0 58.0 112.9 271.6 216.3 23.5 13.3 18.5
Tobacco 6.5 9.6 4.2 12.3 32.7 23.7 5.3 2.5 1.2
Hops 0.0 0.0 0.0 0.0 0.1 0.0 0.0 0.0 0.0
Cotton 0.0 0.0 0.0 0.0 0.0 0.0 0.0 0.0 0.0
Rape and turnip 0.0 0.2 0.3 1.1 1.6 1.4 0.0 0.1 0.1
Sunflower 7.4 27.1 26.6 47.2 108.3 84.0 13.3 5.4 5.6
Soya 15.1 32.3 26.2 48.6 122.3 102.6 4.0 4.7 10.9
Fresh vegetables, melons, strawberry 62.0 68.4 48.3 56.2 235.0 205.6 10.6 8.6 10.2
outside 51.3 62.0 45.5 53.7 212.5 184.6 10.0 8.2 9.7
under glass 10.7 6.4 2.9 2.5 22.5 21.0 0.6 0.5 0.4
Flower and ornamental plants 7.2 1.7 0.6 1.0 10.5 9.5 0.9 0.1 0.0
outside 3.4 0.9 0.5 0.8 5.6 4.8 0.8 0.1 0.0
under glass 3.7 0.8 0.2 0.2 4.9 4.8 0.1 0.0 0.0
Forage plants 133.6 466.9 488.4 670.8 1759.6 560.0 120.0 484.9 594.7
Fallow land 42.0 101.6 89.0 174.7 407.3 308.9 22.7 28.8 47.0
Kitchen garden 18.0 7.4 1.4 0.5 27.2 17.6 6.6 2.5 0.5
Permanent pasture and meadows 150.5 412.0 515.7 2176.1 3254.2 1429.3 153.7 973.4 697.9
Permanent crops 895.5 794.8 260.4 282.4 2233.1 1946.8 139.0 96.2 51.0
Fruit and berry plantation 134.0 170.1 55.9 44.3 404.3 341.4 30.9 19.1 13.0
Citrus plantation 58.6 36.8 13.2 12.4 121.0 115.3 1.7 2.9 1.2
Olive trees 464.1 283.6 93.1 118.5 959.3 828.0 65.8 48.7 16.9
Vineyard 230.7 294.2 93.5 100.7 719.0 636.3 39.4 25.0 18.2
Ratios
Agricultural area per holding (ha) 2.0 9.6 30.5 127.9 9.0 6.9 5.7 20.9 55.1
Agricultural area… (%)
… own farmed 92.2 80.7 67.0 65.8 73.7 82.2 75.6 60.2 54.1
… in less favoured or mountain area 44.3 42.8 45.7 58.3 49.7 43.1 62.5 69.0 49.9
… organic farmed 1.6 3.3 4.9 7.1 4.9 3.6 2.7 6.5 9.2
… irrigated 19.9 22.9 22.1 18.6 20.6 21.9 13.0 10.2 30.0
[image:5.595.62.549.101.733.2]6 St a t i s t i c s i n f o c u s — Agriculture and fisheries — 22/200 —————————————————————————
#
Italy – 2005
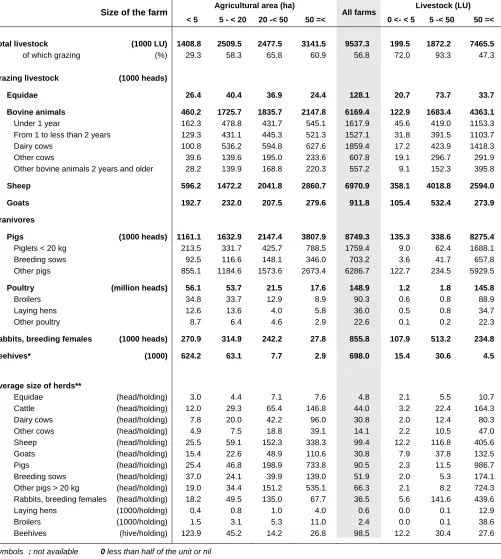
Table 4 – Livestock by size of the farms
Agricultural area (ha) Livestock (LU)
Size of the farm
< 5 5 - < 20 20 -< 50 50 =< All farms 0 <- < 5 5 -< 50 50 =<
Total livestock (1000 LU) 1408.8 2509.5 2477.5 3141.5 9537.3 199.5 1872.2 7465.5
of which grazing (%) 29.3 58.3 65.8 60.9 56.8 72.0 93.3 47.3
Grazing livestock (1000 heads)
Equidae 26.4 40.4 36.9 24.4 128.1 20.7 73.7 33.7
Bovine animals 460.2 1725.7 1835.7 2147.8 6169.4 122.9 1683.4 4363.1
Under 1 year 162.3 478.8 431.7 545.1 1617.9 45.6 419.0 1153.3
From 1 to less than 2 years 129.3 431.1 445.3 521.3 1527.1 31.8 391.5 1103.7
Dairy cows 100.8 536.2 594.8 627.6 1859.4 17.2 423.9 1418.3
Other cows 39.6 139.6 195.0 233.6 607.8 19.1 296.7 291.9
Other bovine animals 2 years and older 28.2 139.9 168.8 220.3 557.2 9.1 152.3 395.8
Sheep 596.2 1472.2 2041.8 2860.7 6970.9 358.1 4018.8 2594.0
Goats 192.7 232.0 207.5 279.6 911.8 105.4 532.4 273.9
Granivores
Pigs (1000 heads) 1161.1 1632.9 2147.4 3807.9 8749.3 135.3 338.6 8275.4
Piglets < 20 kg 213.5 331.7 425.7 788.5 1759.4 9.0 62.4 1688.1
Breeding sows 92.5 116.6 148.1 346.0 703.2 3.6 41.7 657.8
Other pigs 855.1 1184.6 1573.6 2673.4 6286.7 122.7 234.5 5929.5
Poultry (million heads) 56.1 53.7 21.5 17.6 148.9 1.2 1.8 145.8
Broilers 34.8 33.7 12.9 8.9 90.3 0.6 0.8 88.9
Laying hens 12.6 13.6 4.0 5.8 36.0 0.5 0.8 34.7
Other poultry 8.7 6.4 4.6 2.9 22.6 0.1 0.2 22.3
Rabbits, breeding females (1000 heads) 270.9 314.9 242.2 27.8 855.8 107.9 513.2 234.8
Beehives* (1000) 624.2 63.1 7.7 2.9 698.0 15.4 30.6 4.5
Average size of herds**
Equidae (head/holding) 3.0 4.4 7.1 7.6 4.8 2.1 5.5 10.7
Cattle (head/holding) 12.0 29.3 65.4 146.8 44.0 3.2 22.4 164.3
Dairy cows (head/holding) 7.8 20.0 42.2 96.0 30.8 2.0 12.4 80.3
Other cows (head/holding) 4.9 7.5 18.8 39.1 14.1 2.2 10.5 47.0
Sheep (head/holding) 25.5 59.1 152.3 338.3 99.4 12.2 116.8 405.6
Goats (head/holding) 15.4 22.6 48.9 110.6 30.8 7.9 37.8 132.5
Pigs (head/holding) 25.4 46.8 198.9 733.8 90.5 2.3 11.5 986.7
Breeding sows (head/holding) 37.0 24.1 39.9 139.0 51.9 2.0 5.3 174.1
Other pigs > 20 kg (head/holding) 19.0 34.4 151.2 535.1 66.3 2.1 8.2 724.3
Rabbits, breeding females (head/holding) 18.2 49.5 135.0 67.7 36.5 5.6 141.6 439.6
Laying hens (1000/holding) 0.4 0.8 1.0 4.0 0.6 0.0 0.1 12.9
Broilers (1000/holding) 1.5 3.1 5.3 11.0 2.4 0.0 0.1 38.6
Beehives (hive/holding) 123.9 45.2 14.2 26.8 98.5 12.2 30.4 27.6
Symbols : not available 0 less than half of the unit or nil
[image:6.595.50.551.102.661.2]———————————————————————— 22/200 — Agriculture and fisheries — St a t i s t i c s i n f o c u s 7
#"
Italy – 2005
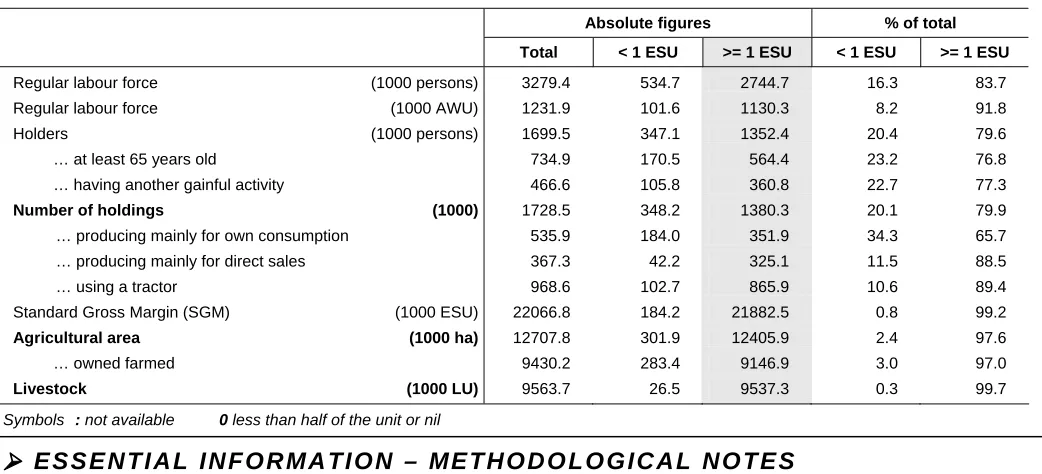
Table 5 – Subsistence farming
Absolute figures % of total
Total < 1 ESU >= 1 ESU < 1 ESU >= 1 ESU
Regular labour force (1000 persons) 3279.4 534.7 2744.7 16.3 83.7
Regular labour force (1000 AWU) 1231.9 101.6 1130.3 8.2 91.8
Holders (1000 persons) 1699.5 347.1 1352.4 20.4 79.6
… at least 65 years old 734.9 170.5 564.4 23.2 76.8
… having another gainful activity 466.6 105.8 360.8 22.7 77.3
Number of holdings (1000) 1728.5 348.2 1380.3 20.1 79.9
… producing mainly for own consumption 535.9 184.0 351.9 34.3 65.7
… producing mainly for direct sales 367.3 42.2 325.1 11.5 88.5
… using a tractor 968.6 102.7 865.9 10.6 89.4
Standard Gross Margin (SGM) (1000 ESU) 22066.8 184.2 21882.5 0.8 99.2
Agricultural area (1000 ha) 12707.8 301.9 12405.9 2.4 97.6
… owned farmed 9430.2 283.4 9146.9 3.0 97.0
Livestock (1000 LU) 9563.7 26.5 9537.3 0.3 99.7
Symbols : not available 0 less than half of the unit or nil
E S S E N T I A L I N F O R MA T I O N – ME T H O D O L O G I C A L N O T E S
"