1
Title:
Genotyping of the Alzheimer’s disease GWAS index SNPs in the
Brains for Dementia Research (BDR) cohort
Authors:
Brookes KJ
1*; McConnell G
1; Williams K
1; Chaudhury S
1;
Madhan G
2; Patel T
1; Turley C
1; Guetta-Baranes T
1; Francis PT
3; Morgan
K
11 Human Genetics, School of Life Sciences, University of Nottingham, Nottingham, UK
2 UCL Genomics, UCL Genomics Great Ormond Street Institute of Child Health, London, UK
3 King’s College London, Wolfson Centre for Age Related Diseases, London, UK
*Corresponding Author Email: keeley.brookes@nottingham.ac.uk, 0115 823 0768
Running Title: Genotyping GWAS variants in BDR
Abstract: 99 words
Main Text: 1721 words
2
Abstract:
The Brains for Dementia Research project is a recently established cohort which aims to
provide brain tissue for research purposes from neuropathologically defined samples. Here
we present the findings from our analysis on the 19 established GWAS index SNPs for Alzheimer’s disease, in order to demonstrate if the BDR sample also displays association to
these variants. A highly significant association of the APOE ε4 allele was identified
(P=3.99x10⁻¹²). Association tests for the 19 GWAS SNPs found that although no SNPs survive
multiple testing, nominal significant findings were detected and concordance with the Lambert
et al GWAS meta-analysis was observed.
Introduction:
The knowledge on the genetic aetiology of late-onset Alzheimer’s disease (LOAD) has been
vastly enhanced over the last decade. Whole genome association studies (GWAS), and
next-generation sequencing investigations have identified numerous genetic risk variants for the
disease in large collaborative samples [1]. The largest GWAS study to date combined the
data from four previous GWAS
datasets (ADGC, CHARGE, EADI & GERAD) to create
the IGAP discovery sample of 17,008 cases and 37,154 controls and imputed over 11
million SNP genotypes for analysis [2]. The addition of data from a replication dataset
increased the sample size to 25,580 cases and 48,466 and yielded the now accepted
19 risk loci (excluding the
APOE
locus) for LOAD from GWAS.
The Brains for Dementia Research (BDR) project is a recently established cohort which aims
to provide brain tissue for research purposes from neuropathologically defined samples [3].
To date, 600 post-mortem brains have been collected and DNA extracted for the purpose of
genetic analysis. Previously we have published the results of our initial exome sequencing
3
analysis on the full sampleset to-date for the established GWAS index SNPs [2], in order to
demonstrate if the BDR sample is genetically representative of LOAD.
Methods:
Samples:
The BDR brain cohort currently has a total of 600 samples, with a form of dementia present in
68.9%. The cohort includes 315 LOAD (age at onset >65 years) cases and 149 cognitively
normal controls; all diagnoses were neuropathologically confirmed. The division of other
dementia diagnoses are shown in Table 1. The average age at death was 82.9 (±8.7) years
for LOAD samples. For control individuals, average age at death was 83.6 (±8.7) years. The
proportion of females is similar in both groups (49.2% and 47.9% respectively) and neither
gender nor age of death were statistically significantly different.
DNA Extraction:
DNA was extracted from brain tissue using standard phenol-chloroform procedures. Samples
were analysed on the Agilent TapeStation and quantified using the Nanodrop 3300
spectrometer to ensure high concentration and quality material was obtained.
Genotyping:
The NeuroChip [5] is a custom Illumina genotyping array with an extensive genome-wide
backbone (n=306,670 variants) and custom content covering 179,467 variants specific to neurological diseases; [6]. There are 284 variants on the NeuroChip that are specific to AD,
including 10 of the GWAS index SNPs [2]. The entire BDR sample has been genotyped using
this platform, and data pertaining to the 10 GWAS SNPs included on the panel were extracted
4
Quality control of the NeuroChip was completed in GenomeStudio (version 2.0, Illumina) and
PLINK [7]. A cluster file was used for automatic clustering of all SNPs [5] whilst manual
re-clustering was completed for mis-clustered SNPs identified by low GenTrain score, cluster
separation score and call frequency. Samples were analysed and removed based on
missingness per individual (mind = 0.1), deviation from European ancestry using top 10
principal components analysis, and heterozygosity (±3 standard deviations). Average
genotyping rate in remaining individuals equalled 98.6% or the entire chip content.
All 10 of the GWAS index SNPs included on this platform (see Table 2) passed QC and
individual genotypes were exported for association analysis in PLINK with an average
genotype rate of 96.4%.
For those GWAS index SNPs not included on the NeuroChip panel (n=9, see Table 2), individual SNP genotyping was carried out ‘in-house’ using KASP assays following standard
protocols (LGC, Middlesex), average genotyping rate was 96.2%. Samples were genotyped for APOE ε2, ε3 and ε4 alleles using the TaqMan assay for SNPs rs7412 and rs429358
(Applied Biosystems) to determine APOE status, genotype call rate was 99.7%.
Statistical Analysis:
Association analysis was carried out in PLINK v1.09 [7]. APOE genotype was collapsed to test the association of ε2/ε3 versus ε4 alleles. Individual GWAS SNP association analysis
was carried out using a logistic regression test correcting for the covariates sex, age at death and APOE ε4 allele count.
5
The BDR sample is a growing cohort, with DNA available for over 600 brain samples available
for scientific use. The genetic analysis presented here consists of the current path-confirmed
diagnosed sample, of 315 AD samples and 149 control samples. The demographics are
presented in Table 1. A number of samples were excluded from the analysis due to the
dementia being other than AD, including Lewy body dementia, vascular dementia, frontal
temporal lobe dementia, mixed dementias and early-onset dementias. Other diagnoses
where dementia was present but were comorbid with other pathologies included three cases of Parkinson’s disease, three cases of Cerebrovascular disease, two cases of Corticobasal
Syndrome, and single cases of Argyrophilic grain disease and PICKS disease. There was
also an individual who presented with dementia but for which there was no underlying
neuropathology present. There were also a number of control samples where although no
dementia symptoms were present, they have been excluded due to other disorders being present, including seven cases of Cerebrovascular disease, six cases of Parkinson’s disease,
and single cases of Huntingdons’ disease, Corticobasal Syndrome, Progressive Supranuclear
Palsy, Motor Neuron disease, and CADASIL syndrome.
Table 1: Sample Demographics
Allele frequencies were not shown to deviate from Hardy-Weinberg equilibrium and minor allele frequencies were similar to those observed in the Lambert et al discovery dataset, [2].
One discrepancy arose from a single SNP (rs35349669) associated with the INPP5D gene, even though the minor allele frequency was similar to that observed in the Lambert et al study,
the minor allele was the opposite to what was expected. In the general population the
frequency of T-allele is 21% (1000 genomes), however in the AD-control discovery set
investigated by Lambert this minor allele frequency was increased to almost 49%, a similarly
high minor allele frequency was also observed in this study (47%) but with the C-allele (Table
6
Table 2: SNP MAF from dbSNP, Lambert discovery sample, BDR
Logistic regression analyses found that the ε4 allele was highly associated with the AD phenotype (P = 3.99 x 10⁻¹², OR = 3.76 (95%CI 2.59 – 5.46)) as would be expected.
Association analysis for the GWAS index SNPs Bonferroni-corrected for multiple testing (n=19 tests, P<0.0026) yielded no significant results. Nominal association was observed for 4 SNPs
(Table 3). SNP rs28834970 (PTK2B) displayed nominal for significance with a P value of 0.044, whilst strong associations for rs10792832 (PICALM), rs35349669 (INPP5D) and rs1476679 (ZWCPW1) was observed with nominal significance with P values of 0.023, 0.014 and 0.015 respectively. The PICALM and ZWCPW1 associated SNPs both indicated a protective effect with odd ratio of 0.7 and 0.65 respectively in agreeance with what was
observed in the Lambert analysis. Whereas the PTK2B and INPP5D SNPs both increased risk for the development of AD with odds ratios of 1.39 and 1.47 respectively. However as
previously noted the association for the INPP5D SNP was with the minor allele which is the opposing allele to that observed by Lambert et al. In total 14 out of the 19 SNPs were in
concordance with the Lambert et al study with respect to the allele associated and direction of
effect size (73.7%).
Table 3: PLINK association results
Discussion:
This study presents data for the association of the established 19 SNP loci associated with
LOAD in the newly formed BDR cohort. Although still in its infancy the cohort has collected
over 600 path-confirmed brain samples, which have been genetically analysed, with further
samples (up to 3000) expected in the next few years. The aim of this study was to investigate
7
identified in the meta-analysis GWAS study by Lambert et al (2013) we genotyped the BDR
sample with the NeuroChip [5] to obtain the GWAS index SNP data and supplemented it with
KASP assays for SNPs that were not present on the array. Minor allele frequencies of the 19
SNPs explored were similar to that produced by the discovery sample in the Lambert et al
study, indicating that genetically speaking the BDR cohort is representative of other LOAD
datasets. The single exception was for rs35349669 (INPP5D), where opposing alleles were found in the minor frequencies, despite the T-allele minor frequency in the general population
being approximately 21%, in the Lambert el al cohort, the T-allele frequency increased to that
of almost 49% (Table 2). The BDR cohort also has a high minor allele frequency for the
rs35349669 SNP (47%) however this is with the C-allele. Where samples have high frequencies of the minor allele it is not uncommon to observed ‘allele flipping’ and may be
indicative of subtle variation between the BDR cohort and the Lambert discovery dataset or
the difference in sample size [8]. Further to this, this SNP also indicated nominal significant
association with the LOAD phenotype in the BDR sample with the C-allele (as opposed to the
T-allele in the Lambert study); however, given the current size of the BDR sample this is quite
possibly a type 1 error.
Three further SNPs within the BDR cohort were indicative of significance for association
rs28834970 (PTK2B), rs10792832 (PICALM), and rs1476679 (ZWCPW1). It is interesting to note that previous analysis of this cohort with whole exome sequencing also indicated
association to the ZWCPW1 gene region with Burden analysis indicating association of the
PILRA gene which has been shown to be in weak LD (r2 = 0.5) with the ZWCPW1 GWAS
index SNP rs1476679 [4]. Although no SNP displayed significant association after correction
for multiple testing, 14/19 SNPs (73.7%) were concordant with the Lambert meta-analysis
dataset for allele and direction of effect. Those that were non-concordant were all with the
same allele (except rs35349669, INPP5D), with effect sizes around 1. Given the small effect sizes of GWAS and the sample size of the current BDR cohort fluctuation around an OR of 1
8
Currently the BDR cohort is underpowered to significantly detect the effect sizes of the
established GWAS hits for LOAD. However as the cohort grows, it is envisaged that the data
will become increasingly concordant with such studies as the Lambert meta-analysis, given
the preliminary data presented here. Genetic data generated form the BDR cohort is publically
available upon a data request to BDR and therefore can serve the interests of the research
community at large for small-scale projects wanting to investigate the effects of the GWAS
hits.
Acknowledgments:
Genotyping was carried out at the UCL Genomics Facility, by G Madhan at UCL Genomics
Great Ormond Street Institute of Child Health, London UK.
We would like to gratefully acknowledge all donors and their families for the tissue provided for this study. Human post-mortem tissue was obtained from the South West Dementia Brain
Bank, London Neurodegenerative Diseases Brain Bank, Manchester Brain Bank, Newcastle
Brain Tissue Resource and Oxford Brain Bank, members of the Brains for Dementia Research
(BDR) Network. The BDR is jointly funded by Alzheimer's Research UK and the Alzheimer's
Society in association with the Medical Research Council.
We also wish to acknowledge the neuropathologists at each centre and BDR Brain Bank staff
for the collection and classification of the samples. Tissue provided by the Newcastle Brain
Tissue Resource is funded in part by a grant from the UK Medical Research Council
(G0400074), by NIHR Newcastle Biomedical Research Centre and Unit awarded to the
Newcastle upon Tyne NHS Foundation Trust and Newcastle University, and by a grant from the Alzheimer’s Society and Alzheimer’s Research UK as part of the Brains for Dementia
9
East NRES committee 08/H0704/128+5 and has deemed all approved requests for tissue to
have been approved by the committee. The work presented here was funded by an ARUK
Major Project Grant to KM and PTF.
Conflicts of Interest:
The authors declare they have no conflict of interests
References:
[1] Brookes KMK (2017) in eLS. John Wiley & Sons Ltd, Chichester.
10
Williams J, Schellenberg GD, Amouyel P (2013) Meta-analysis of 74,046 individuals identifies 11 new susceptibility loci for Alzheimer's disease. Nat Genet 45, 1452-1458.
[3] Costello H, Hayes GM, Highton-Williamson E, Nurock S, Hanbury D, Francis PT (2017) A pilot study of potential brain donor satisfaction and attitudes towards telephone assessment. Int J Geriatr Psychiatry 32, 1247-1256.
[4] Patel T, Brookes KJ, Turton J, Chaudhury S, Guetta-Baranes T, Guerreiro R, Bras J, Hernandez D, Singleton A, Francis PT, Hardy J, Morgan K (2017) Whole-exome sequencing of the BDR cohort: Evidence to support the role of the PILRA gene in Alzheimer's disease. Neuropathol Appl Neurobiol.
[5] Blauwendraat C, Faghri F, Pihlstrom L, Geiger JT, Elbaz A, Lesage S, Corvol JC, May P, Nicolas A, Abramzon Y, Murphy NA, Gibbs JR, Ryten M, Ferrari R, Bras J, Guerreiro R, Williams J, Sims R, Lubbe S, Hernandez DG, Mok KY, Robak L, Campbell RH, Rogaeva E, Traynor BJ, Chia R, Chung SJ, Hardy JA, Brice A, Wood NW, Houlden H, Shulman JM, Morris HR, Gasser T, Kruger R, Heutink P, Sharma M, Simon-Sanchez J, Nalls MA, Singleton AB, Scholz SW (2017) NeuroChip, an updated version of the NeuroX genotyping platform to rapidly screen for variants associated with neurological diseases. Neurobiol Aging.
[6] McCarthy S, Das S, Kretzschmar W, Delaneau O, Wood AR, Teumer A, Kang HM, Fuchsberger C, Danecek P, Sharp K, Luo Y, Sidore C, Kwong A, Timpson N, Koskinen S, Vrieze S, Scott LJ, Zhang H, Mahajan A, Veldink J, Peters U, Pato C, van Duijn CM, Gillies CE, Gandin I, Mezzavilla M, Gilly A, Cocca M, Traglia M, Angius A, Barrett JC, Boomsma D, Branham K, Breen G, Brummett CM, Busonero F, Campbell H, Chan A, Chen S, Chew E, Collins FS, Corbin LJ, Smith GD, Dedoussis G, Dorr M, Farmaki AE, Ferrucci L, Forer L, Fraser RM, Gabriel S, Levy S, Groop L, Harrison T, Hattersley A, Holmen OL, Hveem K, Kretzler M, Lee JC, McGue M, Meitinger T, Melzer D, Min JL, Mohlke KL, Vincent JB, Nauck M, Nickerson D, Palotie A, Pato M, Pirastu N, McInnis M, Richards JB, Sala C, Salomaa V, Schlessinger D, Schoenherr S, Slagboom PE, Small K, Spector T, Stambolian D, Tuke M, Tuomilehto J, Van den Berg LH, Van Rheenen W, Volker U, Wijmenga C, Toniolo D, Zeggini E, Gasparini P, Sampson MG, Wilson JF, Frayling T, de Bakker PI, Swertz MA, McCarroll S, Kooperberg C, Dekker A, Altshuler D, Willer C, Iacono W, Ripatti S, Soranzo N, Walter K, Swaroop A, Cucca F, Anderson CA, Myers RM, Boehnke M, McCarthy MI, Durbin R (2016) A reference panel of 64,976 haplotypes for genotype imputation. Nat Genet 48, 1279-1283.
[7] Purcell S, Neale B, Todd-Brown K, Thomas L, Ferreira MA, Bender D, Maller J, Sklar P, de Bakker PI, Daly MJ, Sham PC (2007) PLINK: a tool set for whole-genome association and population-based linkage analyses. Am J Hum Genet 81, 559-575.
[8] Clarke GM, Cardon LR (2010) Aspects of observing and claiming allele flips in association studies. Genet Epidemiol 34, 266-274.
11
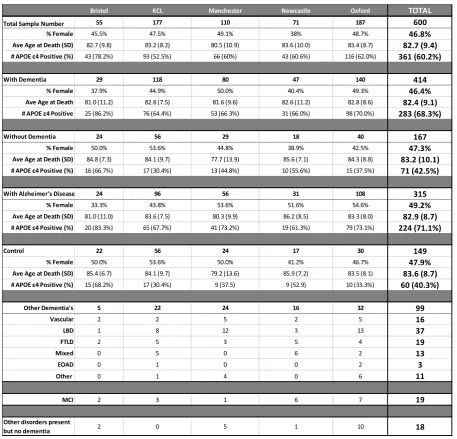
Table 1:
Table 1: Demographic break-down of the BDR, by centre and by diagnosis. Age at the time of death,
and % of samples that were female did not significantly differ between groups.
Bristol KCL Manchester Newcastle Oxford TOTAL
Total Sample Number 55 177 110 71 187 600
% Female 45.5% 47.5% 49.1% 38% 48.7% 46.8%
Ave Age at Death (SD) 82.7 (9.8) 83.2 (8.2) 80.5 (10.9) 83.6 (10.0) 83.4 (8.7) 82.7 (9.4) # APOE ε4 Positive (%) 43 (78.2%) 93 (52.5%) 66 (60%) 43 (60.6%) 116 (62.0%) 361 (60.2%)
With Dementia 29 118 80 47 140 414
% Female 37.9% 44.9% 50.0% 40.4% 49.3% 46.4%
Ave Age at Death 81.0 (11.2) 82.8 (7.5) 81.6 (9.6) 82.6 (11.2) 82.8 (8.6) 82.4 (9.1)
# APOE ε4 Positive 25 (86.2%) 76 (64.4%) 53 (66.3%) 31 (66.0%) 98 (70.0%) 283 (68.3%)
Without Dementia 24 56 29 18 40 167
% Female 50.0% 53.6% 44.8% 38.9% 42.5% 47.3%
Ave Age at Death (SD) 84.8 (7.3) 84.1 (9.7) 77.7 (13.9) 85.6 (7.1) 84.3 (8.8) 83.2 (10.1) # APOE ε4 Positive (%) 16 (66.7%) 17 (30.4%) 13 (44.8%) 10 (55.6%) 15 (37.5%) 71 (42.5%)
With Alzheimer's Disease 24 96 56 31 108 315
% Female 33.3% 43.8% 53.6% 51.6% 54.6% 49.2%
Ave Age at Death (SD) 81.0 (11.0) 83.6 (7.5) 80.3 (9.9) 86.2 (8.5) 83.3 (8.0) 82.9 (8.7)
# APOE ε4 Positive (%) 20 (83.3%) 65 (67.7%) 41 (73.2%) 19 (61.3%) 79 (73.1%) 224 (71.1%)
Control 22 56 24 17 30 149
% Female 50.0% 53.6% 50.0% 41.2% 46.7% 47.9%
Ave Age at Death (SD) 85.4 (6.7) 84.1 (9.7) 79.2 (13.6) 85.9 (7.2) 83.5 (8.1) 83.6 (8.7)
# APOE ε4 Positive (%) 15 (68.2%) 17 (30.4%) 9 (37.5) 9 (52.9) 10 (33.3%) 60 (40.3%)
Other Dementia's 5 22 24 16 32 99
Vascular 2 2 5 2 5 16
LBD 1 8 12 3 13 37
FTLD 2 5 3 5 4 19
Mixed 0 5 0 6 2 13
EOAD 0 1 0 0 2 3
Other 0 1 4 0 6 11
MCI 2 3 1 6 7 19
Other disorders present
12
Table 2:
Table 2: Minor allele frequencies (MAF) for each of the 19 GWAS index SNPs. MAFs were obtain from
1000 genomes (dbSNP), the Lambert discovery dataset (Lambert et al 2013) and the current BDR
cohort of 315 LOAD and 149 control cases combined. Variations between the LOAD cohorts and that
of the 1000 genomes MAFs are clearly apparent, however MAF are similar between the Lambert
Discovery dataset and the BDR cohort, indicating that the BDR is genetically representative of
previously studied LOAD samples.
GWAS Index SNP Chr Location Associated Gene
Major
Allele Minor Allele MAF Minor Allele MAF Minor Allele MAF
Genotyping Platform rs6656401 Chr1:207692049 CR1 G A 0.067 A 0.197 A 0.188 KASP rs6733839 Chr2:127892810 BIN1 C T 0.395 T 0.409 T 0.432 NeuroChip rs35349669 Chr2:234068476 INPP5D C T 0.21 T 0.488 C 0.469 KASP
rs190982 Chr5:88223420 MEF2C A G 0.22 G 0.408 G 0.421 NeuroChip rs9271192 Chr6:32578530 HLA-DRB5 A C 0.237 C 0.276 C 0.265 KASP rs10948363 Chr6:47487762 CD2AP A G 0.188 G 0.266 G 0.312 KASP rs1476679 Chr7:100004446 ZCWPW1 T C 0.212 C 0.287 G 0.284 NeuroChip rs11771145 Chr7:143110762 EPHA1 G A 0.432 A 0.338 A 0.329 NeuroChip rs2718058 Chr7:37841534 NME8 A G 0.337 G 0.373 G 0.367 NeuroChip rs28834970 Chr8:27195121 PTK2B T C 0.316 C 0.366 C 0.403 KASP
rs9331896 Chr8:27467686 CLU T C 0.383 C 0.379 C 0.364 KASP
rs11218343 Chr11:121435587 SORL1 T C 0.109 C 0.039 C 0.041 KASP rs10838725 Chr11:47557971 CELF1 T C 0.263 C 0.316 C 0.329 KASP rs983392 Chr11:59923508 MS4A6A A G 0.231 G 0.403 G 0.418 KASP rs10792832 Chr11:85867875 PICALM G A 0.314 A 0.358 A 0.354 NeuroChip rs17125944 Chr14:53400629 FERMT2 T C 0.111 C 0.092 G 0.101 NeuroChip rs10498633 Chr14:92926952 SLC24A4 G T 0.153 T 0.217 T 0.219 NeuroChip rs4147929 Chr19:1063443 ABCA7 G A 0.175 A 0.190 A 0.209 NeuroChip rs7274581 Chr20:55018260 CASS4 T C 0.094 C 0.083 C 0.084 NeuroChip
13
Table 3:
Table 3: Results from PLINK association analysis for the 19 SNPs investigated in the BDR cohort
alongside data produced from the Lambert et al meta-analysis dataset (Lambert et al 2013). Logistic
regression analysis with correction for sex, age at death and number of APOE Ɛ4 alleles suggest that
four SNPs (rs35349669, rs1476679, rs28834970 & rs10792832) display nominal significance for
association with the LOAD phenotype (highlighted in red). Multiple test correction with Bonferroni saw
no SNPs retain significance (P<0.0026).
GWAS Index SNP Associated Gene Minor Allele OR (95%CI) Meta-Analysis P-value Minor Allele OR (95%CI) P-value
rs6656401 CR1 A (1.14 - 1.28)1.18 5.7 x 10⁻²⁴ A 0.92
(0.63 - 1.34) 0.656
rs6733839 BIN1 T 1.22 (1.18 - 1.25) 6.9 x 10
-44 T 1.03
(0.77 - 1.39) 0.828
rs35349669 INPP5D T 1.08 (1.05 - 1.15) 3.2 x 10
-8 C 1.47
(1.08 - 2.00) 0.014
rs190982 MEF2C G 0.93 (0.90 - 0.95) 3.2 x 10
-8 G 0.96
(0.71 - 1.31) 0.812
rs9271192 HLA-DRB5 C 1.11 (1.08 - 1.15) 2.9 x 10
-12 C 0.99
(0.71 - 1.39) 0.955
rs10948363 CD2AP G 1.10 (1.07 - 1.13) 5.2 x 10
-11 G 1.20
(0.86 - 1.66) 0.278
rs1476679 ZCWPW1 C 0.91 (0.89 - 0.94) 5.6 x 10
-10 C 0.65
(0.46 - 0.92) 0.015 rs11771145 EPHA1 A 0.90
(0.88 - 0.93) 1.1 x 10
-13 A 1.00
(0.72 - 1.39) 0.99
rs2718058 NME8 G 0.93 (0.90 - 0.95) 4.8 x 10
-9 G 0.85
(0.64 - 1.14) 0.278
rs28834970 PTK2B C 1.10 (1.08 - 1.13) 7.4 x 10
-14 C 1.39
(1.01 - 1.90) 0.044
rs9331896 CLU C 0.86 (0.84 - 0.89) 2.8 x 10
-25 C 0.98
(0.72 - 1.32) 0.873
rs11218343 SORL1 C 0.77 (0.72 - 0.82) 9.7 x 10
-15 C 0.78
(0.37 - 1.65) 0.52
rs10838725 CELF1 C 1.08 (1.05 - 1.11) 1.1 x 10
-8 C 1.04
(0.77 - 1.4) 0.813
rs983392 MS4A6A G 0.90 (0.87 - 0.89) 6.1 x 10
-16 G 0.99
(0.73 - 1.34) 0.951
rs10792832 PICALM A 0.87 (0.85 - 0.89) 9.3 x 10
-26 A 0.70
(0.52 - 0.95) 0.023
rs17125944 FERMT2 C 1.14 (1.09 - 1.19) 7.9 x 10
-9 C 1.11
(0.67 - 1.85) 0.682
rs10498633 SLC24A4 T 0.91 (0.88 - 0.94) 5.5 x 10
-9 T 0.93
(0.64 - 1.35) 0.692
rs4147929 ABCA7 A 1.15 (1.11 - 1.19) 1.1 x 10
-15 A 0.95
(0.66 - 1.36) 0.783
rs7274581 CASS4 C 0.88 (0.84 - 0.92) 2.5 x 10
-8 C 1.21
(0.69 - 2.1) 0.508