This is a repository copy of
The evolution of mass loaded supernova remnants: II.
Temperature dependent mass injection rates
.
White Rose Research Online URL for this paper:
http://eprints.whiterose.ac.uk/1252/
Article:
Pittard, J.M., Arthur, S.J., Dyson, J.E. et al. (4 more authors) (2003) The evolution of mass
loaded supernova remnants: II. Temperature dependent mass injection rates. Astronomy
and Astrophysics, 401 (3). pp. 1027-1038. ISSN 0004-6361
https://doi.org/10.1051/0004-6361:20030157
[email protected] https://eprints.whiterose.ac.uk/
Reuse
See Attached
Takedown
If you consider content in White Rose Research Online to be in breach of UK law, please notify us by
A&A 401, 1027–1038 (2003) DOI: 10.1051/0004-6361:20030157
c
ESO 2003
Astronomy
&
Astrophysics
The evolution of mass loaded supernova remnants
II. Temperature dependent mass injection rates
J. M. Pittard
1, S. J. Arthur
2, J. E. Dyson
1, S. A. E. G. Falle
3, T. W. Hartquist
1, M. I. Knight
1, and M. Pexton
31 Department of Physics & Astronomy, The University of Leeds, Woodhouse Lane, Leeds LS2 9JT, UK
2 Instituto de Astronomia, UNAM, Campus Morelia, Apartado Postal 3-72, 58090 Morelia, Michoacan, Mexico
3 Department of Applied Mathematics, The University of Leeds, Woodhouse Lane, Leeds LS2 9JT, UK
Received 21 August 2002/Accepted 4 February 2003
Abstract.We investigate the evolution of spherically symmetric supernova remnants in which mass loading takes place due
to conductively driven evaporation of embedded clouds. Numerical simulations reveal significant differences between the
evo-lution of conductively mass loaded and the ablatively mass loaded remnants studied in Paper I. A main difference is the way
in which conductive mass loading is extinguished at fairly early times, once the interior temperature of the remnant falls
be-low∼107K. Thus, at late times remnants that ablatively mass load are dominated by loaded mass and thermal energy, while
those that conductively mass load are dominated by swept-up mass and kinetic energy. Simple approximations to the remnant evolution, complementary to those in Paper I, are given.
Key words.ISM: kinematics and dynamics – ISM: supernova remnants – galaxies: ISM
1. Introduction
The evolution and properties of supernova remnants are fun-damental to many areas of astrophysical research. Self-similar solutions for various stages of the evolution have been obtained for various assumptions, as have unified solutions which link these together (see Cioffiet al. 1988; Truelove & McKee 1999). The self-similar and unified solutions are complemented by a wide range of numerical investigations. Amongst the prob-lems examined numerically are explosions in plane-stratified media (e.g. Falle & Garlick 1982; Arthur & Falle 1991, 1993), the evolution of SNRs inside pre-existing wind-driven cavities (Franco et al. 1991), the influence of hydrodynamic instabilities (e.g. Chevalier & Blondin 1995), and applications to the broad emission line regions in active galactic nuclei (e.g. Terlevich et al. 1992; Pittard et al. 2001).
In most investigations of supernova remnant evolution, the surrounding medium has been assumed to have a smooth den-sity distribution. However, the interstellar medium is known to be multi-phase (e.g. McKee & Ostriker 1977), and there is clear observational evidence of engulfed clouds within the supernova remnant N63A (Chu et al. 1999; Warren et al. 2002). As it is widely known, the injection of mass from such cool clouds into the interior of a supernova remnant will affect its behaviour and structure.
If the clouds are assumed to be continuously distributed, similarity solutions describing the evolution of adiabatic mass
Send offprint requests to: J. M. Pittard,
e-mail:[email protected]
loaded supernova remnants can be derived for a specific func-tional dependence of the mass injection. Previous work has fo-cussed on cases in which one mass injection process is domi-nant over others. McKee & Ostriker (1977), Chi`eze & Lazareff
(1981), and White & Long (1991) each investigated the evolu-tion under the assumpevolu-tion that cloud destrucevolu-tion is due to con-ductive evaporation. Alternatively, Dyson & Hartquist (1987) treated hydrodynamic ablation as the dominant process.
A small number of papers based on numerical simulations of mass loaded supernova remnants also exist in the literature. Cowie et al. (1981) included the dynamics of the clouds and found that warm clouds are swept towards the shock front and are rapidly destroyed, while cold clouds are more evenly dis-tributed and have longer lifetimes. When energy losses become important, this behaviour leads to the highest densities in the remnant occuring over the outer half radius. In contrast, when there is no mass loading, a thin dense shell forms at the for-ward shock. Arthur & Henney (1996) studied the effects of mass loading by hydrodynamic ablation on supernova rem-nants evolving inside cavities evacuated by the stellar winds of the progenitor stars. They showed that the extra mass injected by embedded clumps was capable of producing the excess soft X-ray emission seen in some bubbles in the Large Magellanic Cloud.
account for the observed X-ray emission (Suchkov et al. 1996). Since the range and radiative energy losses of a remnant are affected by mass loading, it is therefore desirable to have ap-proximations which describe remnant evolution and range in clumpy media.
Analogous approximations already exist for smooth media (cf. Truelove & McKee 1999, and references therein). In a re-cent paper (Dyson et al. 2002, hereafter Paper I), the first steps towards this goal were taken with the derivation of range ap-proximations for cases in which mass injection occurs at a con-stant rate, q, or at a rate which depends on the flow Mach num-ber relative to the clump (Hartquist et al. 1986). A mass loading rate of qM4/3was used for subsonic flow, where M is the Mach
number of the flow. A constant mass loading rate q was used where the flow is supersonic. This prescription simulates mass stripping from the clump by hydrodynamic ablation.
In this companion paper we consider mass injection from clouds into the hot remnant interior by conductive evaporation (cf. Cowie & McKee 1977; McKee & Cowie 1977). This pro-cess is potentially important in any astrophysical system where a hot tenuous phase coexists with a colder denser phase (see McKee & Cowie 1977 for some examples), though it can be suppressed by magnetic fields. In many systems (including su-pernova remnants) the hot phase flows past the clouds, and they will be subject also to ablation. Unfortunately, we currently lack even basic models of this combined interaction, so it is difficult to know whether one process dominates the other, or if one process limits the other. For example, one could imagine a scenario whereby ablation drives the initial mass loss, increas-ing the effective surface area of the cloud (e.g. by forming a tail), at which point conduction takes over and leads to efficient mixing. In evolving objects such as supernova remnants, one process may dominate at early evolutionary stages, while the other dominates at later stages. Given these potential complica-tions and our lack of knowledge about them, as a first approach we treat each process individually.
The outline of our paper is as follows. In Sect. 2 we out-line our assumptions and our numerical code; in Sect. 3 we present some of our results; in Sect. 4 we present simple ap-proximations to these results; and in Sect. 5 we summarize and conclude.
2. The calculations
As initial conditions, we take freely-expanding cold ejecta at constant density (typically 104 times the ambient density, n0),
and with a linear velocity profile. The maximum ejecta speed is 4000 km s−1, which together with the radius of the ejecta defines the initial time. We performed extensive tests with dif-ferent density ratios to confirm that our chosen ratio is large enough not to influence the resulting evolution. The calcula-tions were performed using an adaptive grid hydrodynamic code (see e.g. Falle & Komissarov 1996, 1998), and we have further verified that the resolution employed is high enough to give robust results for the global quantities considered in this paper.
All calculations were performed in spherical symmetry, with an ejecta mass of 10 M⊙and a kinetic energy of 1051ergs
(the effect of different progenitor masses and explosion ener-gies is commented on in Sect. 5). The assumption that the en-ergy is entirely kinetic for the initial conditions is somewhat different to that in Paper I, but it does not affect the result-ing evolution (see also Gull 1973 and Cowie et al. 1981). We modelled the intercloud ambient medium as a warm plasma of temperature 104 K. Cooling appropriate for an optically thin
plasma of solar composition and in collisional ionization equi-librium was included. We assumed that cooling below 104K is
balanced by photoionization heating from the diffuse field and for that reason impose a temperature floor of 104K. For
sim-plicity we did not include magnetic fields or shock precursors, and also did not consider conduction between the hot remnant interior and cold neighbouring gas.
The rate of mass evaporation from embedded clouds is de-pendent on many factors (cf. Cowie & McKee 1977), including the temperature of the hot phase, the cloud radius, and the pres-ence of magnetic fields. However, motions of the clouds are generally not large enough to change the evaporation rates, and Cowie & Songalia (1977) noted that nonspherical clouds may be treated in an approximate way by adopting half the largest dimension as the radius of the cloud. The evaporative mass-loss rate from a single cloud (Cowie & McKee 1977) is
˙
m=4πa2nT1/2(kµmH)1/2φF(σ0), (1)
where a is the cloud radius, n and T are the density and tem-perature of the surrounding hot phase (i.e. the interior of the remnant),µmH is the mean mass per particle, andφis an
ef-ficiency factor which encapsulates the magnetic field strength, its configuration, the cloud geometry, etc. (φ =0 corresponds to no evaporation,φ≈1 to evaporation in the absence of mag-netic fields – e.g.φ=1.1 for a plasma with equal electron and ion temperatures and cosmic abundances). F(σ0) is a function
defined in Eqs. (61) and (62) of Cowie & McKee (1977). In the classical limit, F(σ0) =2σ0, where the saturation parameter, σ0, is defined as
σ0=
T
1.54×10⁷
2 1
napcφ·
(2)
Here apc =a/(1 pc) is the radius of the cloud in parsecs. The
onset of saturation occurs whenσ0 is of order unity, varying
between 1.95 (φ≪1) and 1.08 (φ=1) for the examples given in Cowie & McKee (1977). In the classical limit, ˙m ∝ T5/2
since F(σ0) ∝ σ0 (cf. Fig. 4 in Cowie & McKee 1977). If
saturated, F(σ0)∝σ β
0, whereβ=(1+M 2
s)/(6+M2s), and Ms
(the Mach number of the saturated zone) is related toφby
Ms 1+
1 5M
2 s
!
=2φ. (3)
Sinceφis unlikely to exceed unity by a substantial amount, and has a lower limit of zero, the likely range ofβis 1/6≤β≤3/8. Hence in the saturated limit ˙m∝Tαwhere 5/6
also change. Moreover, we expect the distribution of clouds to evolve with time, as the timescale for the smaller clouds to completely evaporate is shorter than the equivalent timescale for larger clouds and in many cases the evolutionary timescale of the remnant. Further, we may expect some differences in the physical make-up of clouds of differing radii (e.g. the distribu-tion of cloud mass in the cold core and its warmer skin – cf. McKee & Ostriker 1977). Finally, a full treatment also requires specifying the number of clouds per unit volume, which is likely to be dependent on the local environment (e.g. the cloud spectrum inside a starburst superwind is likely to be somewhat different to that in our local ISM). McKee & Ostriker (1977) argued that mass loading in the Galactic ISM would be domi-nated by the smaller clouds.
Addressing all of these issues is beyond the scope of the present paper, so we choose instead the following simplifica-tion. We assume that we can specify a temperature for the onset of saturation, Tsat, which is an average over both the cloud
dis-tribution and time. We adopt Tsat=107K for all of our
calcu-lations. Given the uncertainties introduced by this assumption (and those in the original work of Cowie & McKee 1977) it seems unrealistic to specify a complicated dependence for the mass evaporation rate per unit volume above T =Tsat, and we
therefore assume that it is independent of T . Tests with other values of Tsat have shown that our results only become
sen-sitive to the value of Tsat when Tsat < 107√n0K (n0 ( cm−3)
is the intercloud ambient number density). Hence our results with n0 ≤ 1 cm−3 are robust (since a lower value of Tsat
im-plies that most of the mass loading is from a population of tiny clouds (apc<0.42/φ) whereas the smallest cloud radii in
mod-els of the ISM by McKee & Ostriker, 1977, are∼0.38 pc). On the other hand, for n0 >1 cm−3, our results are dependent on
our chosen value of Tsat. However, as Tsatwill depend on
de-tails such as clump lifetimes and number distributions, which are problem specific parameters, we simply note that our results begin to suffer from loss of generality in this regime.
Our final assumptions are: i) that the intercloud spacing is small compared to the scale over which the properties of the remnant varies (so that a continuous mass source term can be used), ii) that injection takes place at zero velocity relative to the global flow, and iii) that the injected gas has zero internal energy. The full set of gas dynamic equations is then
∂ρ ∂t +
1
r2 ∂ ∂rr
2ρu=q, (4)
∂ρu ∂t +
1
r2 ∂ ∂rr
2
p+ρu2=2p
r , (5)
∂e ∂t +
1
r2 ∂ ∂r
h
r2u(e+p)i=−L, (6)
where the symbols ρ, u, and p have their usual meanings,
e = p/(γ−1)+0.5ρu2 is the total energy, and L is the
ra-diative cooling term. q is the mass loading rate per unit volume and time.
As in Paper I, we define a fiducial mass loading rate
q0=
6ρ0
5tsf
, (7)
which gives the mass flux through the blast wave divided by the remnant volume at the onset of thin shell formation for Sedov expansion. Here,ρ0is the intercloud ambient density and tsfis
the timescale for thin shell formation for a remnant propagating into a uniform ambient medium given by Franco et al. (1994),
tsf=2.87×10⁴E513/14n−04/7 yrs, (8)
where 1051E
51 is the explosion energy. In these units, q0 =
1.32×10−36E−3/14
51 n
11/7
0 (with mean mass per particle,µ=0.6).
Following the above discussion, we define the mass loading rate due to conduction as
q =316 f′q
0
T >107K,
q =f′q0(T/T6)5/2
105K<T <107K,
q =0 T <105K, (9)
where T6 =106K (e.g. Cowie et al. 1981). Thin shell
forma-tion occurs when the temperature immediately behind the lead-ing shock is about 106 K. At low temperatures, mass loading
is so weak that the precise temperature cutoffis unimportant. Defining f′ as we have in Eq. (9) ensures that mass loading starts to influence the dynamics and evolution of the remnant if f′ ∼ 1. To be more specific, low values of f′ mean that mass loading will not dominate in the remnant before the time of onset of thin shell formation, while f′ > 1 indicates that the evaporated mass becomes important in the remnant before
tsf is reached. Readers who refer to Paper I will note that in
that paper we defined a parameter f which is somewhat anal-ogous to f′. In an ablatively mass loaded remnant the ablated mass is comparable to the swept-up mass at time tsfif f ∼1.
However, under the assumptions we have made, in very young remnants in which the temperature is everywhere above 107K, f ∼ 316 f′ for the mass loading rate in an ablatively loaded remnant to be comparable to that in a conductively loaded rem-nant for which E0and n0are the same.
f′is physically related to the number density of clouds and the rate at which mass is evaporated from these. However, from Eq. (13) of Cowie et al. (1981), and since q0 ∝E51−3/14n110 /7, we
find that
f′∝φapcNcE513/14n−011/7, (10)
where Ncis the number density of clouds. Thus we might
ex-pect real remnants to be better described by small f′ when they evolve in environments with high ambient densities, and larger f′when they evolve in environments with low am-bient densities. We note that if the distribution of clouds evolve with time, f′itself may evolve with time, though such an effect is not investigated in the models presented in this paper.
We note here, that differences exist between this work and Paper I. In the calculations presented here, mass loading is permitted throughout the remnant, including the ejecta mate-rial, whereas in Paper I it is switched offin the ejecta. This causes differences when most of the mass loading occurs before the remnant has swept up much intercloud mass (i.e. when f′ and n0are large). A further difference is the assumed
was used, whereas here we use 104 K. This will have negli-gible consequences until near the merger of the remnant with the surrounding gas. We note that in the specific case of super-wind generation, merger may take place with gas at even higher temperatures.
We have computed models with f′ =0, 0.316, 3.16, 31.6, 316, and ambient densities n0 = 0.01, 0.1, 1, 10, 100 cm−3.
Although there is an indication that high values of f′ will be favoured when remnants evolve in surroundings with low ambient densities, f′ also scales with the number density of clouds, and thus could be completely independent of the den-sity of the intercloud medium. Hence we explored ( f′,n0) pa-rameter space.
The remnants are evolved until the blast front degenerates into an acoustic wave. We adopted the same definitions for the ends of the free expansion and Quasi-Sedov-Taylor phases as given in Paper I. These are respectively when the internal en-ergy reaches 60% of the initial enen-ergy (FE) and when 50% of the initial energy has been radiated (QST). For f′ <∼3.16, the mass loading dominates in the remnant at times before the on-set of thin shell formation, tsf, though is always decreasing in
importance at this point (i.e. the ratio of loaded mass to swept-up mass is falling). For f′ > 3.16 the mass loading also re-mains dominant at the time of the end of the QST stage, tQST.
Finally, as in Paper I, we note the caveat that we are considering a purely general case and that, in practice, f′is determined by the actual physical situation being studied. We therefore ignore details such as clump lifetimes and spatial distributions, which only introduce additional, problem specific, parameters.
3. Results
We note that all of the results presented in this paper and Paper I are for a particular set of explosion parameters, namely the canonical values E=1051 erg and M=10 M⊙. Where results for hydrodynamic ablation or constant mass loading are pre-sented these have been calculated with the same code as used in the conductive mass loading cases but for the mass loading prescription given in Paper I.
3.1. Remnant expansion speeds and ranges
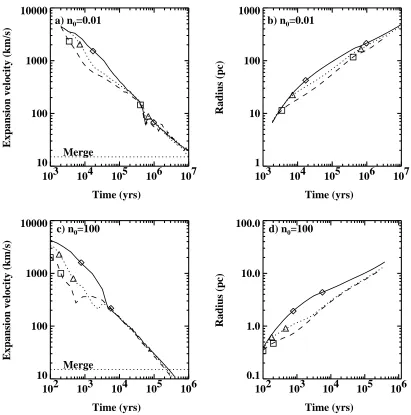
In Fig. 1 we show the remnant expansion speed and radius as functions of time for calculations with zero mass loading ( f′= 0), substantial mass loading ( f′ = 3.16), and high mass load-ing ( f′ =31.6), and for ambient densities of n0 =0.01 cm−3
and n0 = 100 cm−3. Mass loading causes a reduction in
ex-pansion velocity and range at intermediate ages, but there is convergence in speeds and ranges at later times, regardless of the value of f′ or the ambient density. This is in contrast to remnants which mass load through ablation (Paper I) where the reductions in expansion speed and remnant range persist right through to the point of merger with the ambient medium.
This dynamical behaviour can be understood as follows. At early times, the highest temperatures are in the shocked ISM material so mass loading is highest there. By conservation of momentum, the addition of mass to this gas reduces its ve-locity and also has the effect of increasing the pressure (by
conservation of energy). This causes the shocked material to brake harder and leads to an overall reduction in the expan-sion velocity of the remnant. Once the ejecta have completely thermalized, the highest temperatures are in the shocked ejecta material and most of the mass is added here, increasing the den-sity and pressure in this gas. At this stage the rate of decrease of the expansion velocity is less in the conductively mass loaded remnants than in the zero mass loading case because of the higher pressure in the remnant interior. As the blast wave de-celerates, the postshock temperatures and hence the conductive mass loading rates decrease, so during this stage the swept-up mass becomes more important. Eventually, the swept-up mass dominates the dynamics in the postshock region and the rem-nant evolution tends towards the zero mass loading case.
3.2. Mass loading history
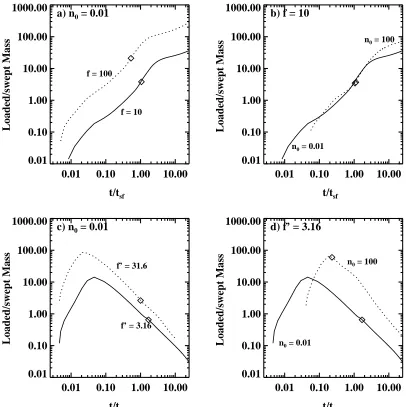
Figure 2 shows the ratio of injected to swept-up mass as a function of time for various values of f′ and ambient densi-ties n0. The top panels show the evolution when mass is
in-jected through hydrodynamic ablation, while the bottom panels show the results obtained when mass injection occurs by con-ductive evaporation. It is immediately obvious from this fig-ure that these mass loading prescriptions yield vastly different behaviour.
When mass loading occurs through ablation, the injected mass becomes increasingly dominant over the swept up mass as time progresses. The limit of the ablative mass loading is a constant mass loading rate q (corresponding to supersonic flow throughout the remnant), so that the injected mass increases as
˙
Mload ≈4πR(t)3q/3, whereas the rate of increase of the
swept-up mass is ˙Mswept=4πR(t)2ρ0dR(t)/dt, so that
˙
Mload
˙
Mswept ∝
R(t)q
˙
R(t)ρ0 ∝
f′t/tsf, (11)
where we have used Eq. (7) and approximated the remnant ex-pansion speed as ˙R(t)∝R(t)/t. Hence, as the ratio of the rates
increases approximately linearly with time, we expect that the ratio of the injected to swept-up mass will also increase ap-proximately linearly with time. This is indeed the behaviour that we see in Figs. 2a, b. Furthermore, for a given f′, we ex-pect that the ratio of the loaded mass (Mload) to the swept-up
mass (Mswept) as a function of time (in units of tsf) will be
in-dependent of n0, as is indeed seen (Fig. 2b). With reference to
Eq. (10), however, “mathematical” independence of n0(at
con-stant f′) does not imply “physical” independence (i.e. keep-ing constant the other physically meankeep-ingful parameters, like
φ, apc, Nc, E51).
When mass loading occurs via conductively-driven evapo-ration, on the other hand, the behaviour of Mload/Mswept as a
10
3
10
4
10
5
10
6
10
7
10
100
1000
10000
Expansion velocity (km/s)
Time (yrs)
a) n
0=0.01
Merge
10
3
10
4
10
5
10
6
10
7
1
10
100
1000
Radius (pc)
Time (yrs)
b) n
0=0.01
10
2
10
3
10
4
10
5
10
6
10
100
1000
10000
Expansion velocity (km/s)
Time (yrs)
c) n
0=100
10
2
10
3
10
4
10
5
10
6
0.1
1.0
10.0
100.0
Radius (pc)
Time (yrs)
d) n
0=100
[image:6.595.76.487.80.495.2]Merge
Fig. 1. Expansion velocity (km s−1) and radius (pc) versus time (yrs) for remnants (E = 1051 erg, M =10 M
⊙) expanding into an ambient
density of n0 =0.01 cm−3 and n0 =100 cm−3. The temperature of the ambient medium is 104 K, and its sound speed is 15 km s−1. The solid
line has f′ = 0 (no mass loading), while the dotted and dashed lines have f′ =3.16 (substantial mass loading) and f′ =31.6 (high mass
loading) respectively. The diamonds, triangles and squares indicate the end of the FE and QST stages for f′=0,3.16,31.6 respectively.
This qualitative difference in the time-dependent be-haviour of the mass loading between the conductively driven evaporation and ablation cases accounts for the differences in the evolutionary behaviour displayed in Fig. 1 of this paper and the evolution of the remnants discussed in Paper I. For the con-ductive case, the mass loading is extinguished at relatively early times and hence does not have much effect over the later stages of the remnant evolution. Once mass loading is “switched off” the ratio Mload/Msweptdepends solely on Msweptand thus is not
independent of n0.
3.3. Mass and energy fractions
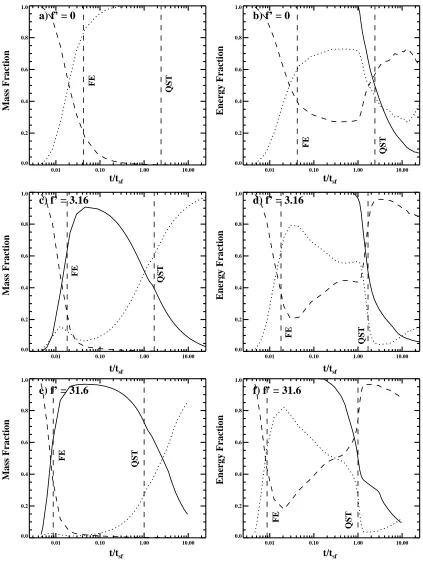
Figure 3 shows the time variation of the mass and energy frac-tions for n0=0.01 cm−3 and f′=0, 3.16 and 31.6. Although
our initial conditions specify the remnant energy as being en-tirely kinetic at early times, a significant fraction is quickly thermalized.
Values of f′=3.16 and 31.6 correspond to f values of 104
and 105, respectively. These are much higher than the f values
discussed in Paper I. The reason for this choice is to approx-imately match the loaded to swept-up mass ratio in the two different mass loading scenarios at the onset of thin-shell for-mation, tsf, i.e., Mload/Mswept≈4 in both cases. Since
conduc-tive evaporation is saturated only at early times in the remnant evolution (cf. Figs. 3c and 3e) and becomes negligible once average temperatures fall below 106K, while hydrodynamic ablation becomes more important as the remnant’s volume in-creases, obviously far higher values of f are necessary in the conductive evaporation case to give Mload/Mswept≈4 at tsf.
With f′=0 (no mass loading) the thermal energy fraction peaks at approximately 0.72 i.e. the value for a Sedov-Taylor remnant expanding into a uniform medium (cf. Fig. 3b). Once the age of the remnant is comparable to tsf, the remnant begins
0.01
0.10
1.00
10.00
0.01
0.10
1.00
10.00
100.00
1000.00
Loaded/swept Mass
t/t
sfa) n
0= 0.01
f = 100
f = 10
0.01
0.10
1.00
10.00
0.01
0.10
1.00
10.00
100.00
1000.00
Loaded/swept Mass
t/t
sfb) f = 10
n0 = 100
n0 = 0.01
0.01
0.10
1.00
10.00
0.01
0.10
1.00
10.00
100.00
1000.00
Loaded/swept Mass
t/t
sfc) n
0= 0.01
f’ = 31.6
f’ = 3.16
0.01
0.10
1.00
10.00
0.01
0.10
1.00
10.00
100.00
1000.00
Loaded/swept Mass
t/t
sfd) f’ = 3.16
n0 = 100
[image:7.595.109.515.83.490.2]n0 = 0.01
Fig. 2. The ratio of evaporated or ablated mass to swept-up mass as a function of time (normalized to the time of shell formation cf. Eq. (8)) for
mass loading by hydrodynamic ablation (top panels) or by conductive evaporation (bottom panels). tsf =4×10⁵yr (n0 =0.01) and 2×10³yr
(n0=100). The diamonds mark the end of the QST stage, and almost overlap in b).
up these processes, and the thermal energy fraction first over-shoots (see Sect. 3.1), then underover-shoots the Sedov-Taylor value (Figs. 3d, f). The decrease in the thermal energy fraction occurs not long after the end of the FE stage. This is long before ra-diative losses become significant, and the remnants are at this stage cooling by adiabatic expansion, such that thermal energy is converted into kinetic energy. This is despite the countering effect of mass loading, which at any given time tends to in-crease the thermal energy fraction relative to the kinetic energy fraction. However, we note that the thermal energy fraction be-gins to decline when the mass fraction of evaporated material starts to drop offand thus is simply a manifestation of the fact that mass loading is ceasing to be an important process in these remnants long before the onset of radiative cooling. In contrast, for the ablation cases discussed in Paper I, it was found that since mass loading becomes more important for the remnant as time goes on, the thermal energy fraction continues to increase right up until the end of the QST stage.
At very late times the energy in a SNR with mass load-ing due to conductive evaporation is predominantly kinetic, whereas in Paper I it was found that in the final stages of a SNR with mass loading due to ablation the continued mass loading ensures that thermal energy dominates.
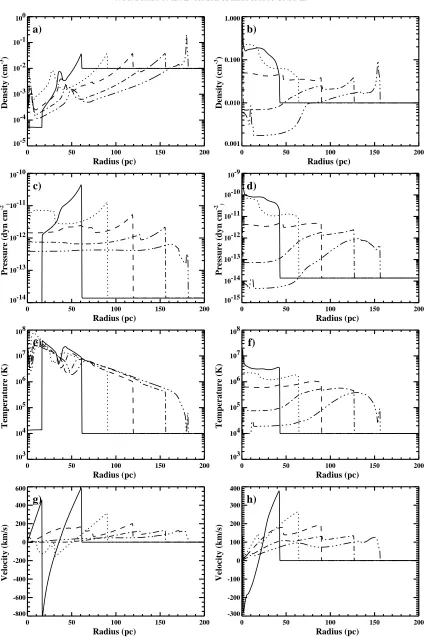
3.4. Evolution of physical quantities
In Fig. 4 we show the density, pressure, temperature, and veloc-ity distributions at specific times just before and after the pre-dicted onset of thin-shell formation for models with n0 =0.01
and f′=0 and f′=3.16. The “structure” at small radii (where the ejected mass is) seen in the density and temperature plots is a consequence of the initial conditions and imposed spherical symmetry (which requires a reflection condition at r =0) but does not significantly affect global properties (see e.g. Cioffi
0.01 0.10 1.00 10.00 0.0
0.2 0.4 0.6 0.8 1.0
Mass Fraction
t/tsf
a) f’ = 0
FE
QST
0.01 0.10 1.00 10.00
0.0 0.2 0.4 0.6 0.8 1.0
Energy Fraction
t/tsf
b) f’ = 0
FE
QST
0.01 0.10 1.00 10.00
0.0 0.2 0.4 0.6 0.8 1.0
Mass Fraction
t/tsf
c) f’ = 3.16
FE
QST
0.01 0.10 1.00 10.00
0.0 0.2 0.4 0.6 0.8 1.0
Energy Fraction
t/tsf
d) f’ = 3.16
FE
QST
0.01 0.10 1.00 10.00
0.0 0.2 0.4 0.6 0.8 1.0
Mass Fraction
t/tsf
e) f’ = 31.6
FE
QST
0.01 0.10 1.00 10.00
0.0 0.2 0.4 0.6 0.8 1.0
Energy Fraction
t/tsf
f) f’ = 31.6
FE
[image:8.595.71.494.82.643.2]QST
Fig. 3. Mass fractions (left panels) and energy fractions (right panels) as functions of the remnant age for f′ =0,3.16,31.6 ( f =0,104,105)
and n0=0.01 (tsf =4×10⁵yr, E=1051 erg, M=10 M⊙). In each of the panels on the left the solid line shows the mass fraction of evaporated
material, the dashed line shows the ejecta mass fraction, and the dotted line shows the swept-up mass fraction. In each of the panels on the right the dashed line shows the kinetic energy fraction, and the dotted line shows the thermal energy fraction, both in terms of the current remnant energy. The solid line shows the total energy as a fraction of the initial remnant energy. Note that we subtract the thermal energy swept-up by the remnant – if this is included both the total energy and the thermal energy fraction increase at late times. The vertical lines mark the ends of the free expansion (FE) and Quasi-Sedov-Taylor (QST) phases.
For f′ = 0 the distributions of density etc. in the exter-nal part of the remnant (where the swept up mass is) corre-spond to the standard Sedov-Taylor solution (although, as in
0 50 100 150 200 10-5
10-4 10-3 10-2 10-1 100
Density (cm
-3 )
Radius (pc)
a)
0 50 100 150 200
0.001 0.010 0.100 1.000
Density (cm
-3 )
Radius (pc)
b)
0 50 100 150 200
10-14 10-13 10-12 10-11 10-10
Pressure (dyn cm
-2 )
Radius (pc)
c)
0 50 100 150 200
10-15 10-14 10-13 10-12 10-11 10-10 10-9
Pressure (dyn cm
-2 )
Radius (pc)
d)
0 50 100 150 200
103 104 105 106 107 108
Temperature (K)
Radius (pc)
e)
0 50 100 150 200
103 104 105 106 107 108
Temperature (K)
Radius (pc)
f)
0 50 100 150 200
-800 -600 -400 -200 0 200 400 600
Velocity (km/s)
Radius (pc)
g)
0 50 100 150 200
-300 -200 -100 0 100 200 300 400
Velocity (km/s)
Radius (pc)
[image:9.595.101.527.74.718.2]h)
Fig. 4. Remnant evolution of density, pressure, temperature, and velocity as a function of age for n0=0.01 and f′=0 (left panels) or f′=3.16
(right panels). The profiles are at time t=3.54×10⁴ yr (solid); t =8.59
×104 yr (dotted); t=1.70
×105 yr (dashed); t=3.39
×105 yr
(dot-dashed); t=5.41×10⁵yr (dot-dot-dot-dashed). t
103 104 105 106 -42
-40 -38 -36 -34
Log
10
ρ
(g cm
-3 s -1 )
.
Time (yrs)
a)
0 2•105 4•105 6•105 8•105 1•106 0
1000 2000 3000 4000
Evaporated mass (Msol)
Time (yrs)
[image:10.595.87.474.83.292.2]b)
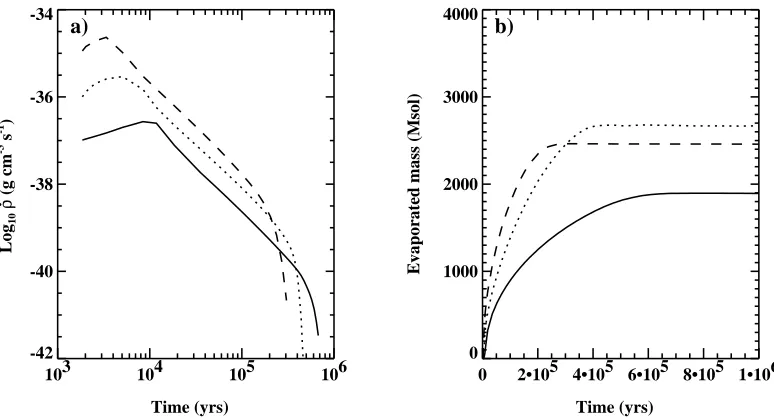
Fig. 5. Remnant averaged mass injection rate a), and integrated mass b), as a function of time for n0 = 0.01 cm−3 and f′ = 3.16 (solid),
f′ =31.6 (dotted), and f′ =316 (dashed). Here we define the remnant volume as a sphere with radius equal to that of the blast wave. The
slight increase in ˙ρat early time results from the fact that the post-shock region where mass loading occurs is above the saturation temperature,
while the volume filling factor simultaneously increases as the reverse shock propagates back to the centre of the remnant. Note also that the
maximum amount of mass that can be evaporated when n0=0.01 cm−3 is<∼3000 M⊙.
Eq. (8)). Inspection of Fig. 4 (in particular, the pressure, which drops markedly in the region where strong radiative cooling starts) shows that our simulations are consistent with this value. The addition of mass through the conductively driven evap-oration of embedded clouds significantly alters the properties of the remnant, most obviously causing the interior density of the remnant to increase with respect to the no mass loading case. At early times, mass loading occurs mainly in the centre of the remnant (in the shocked ejecta region). Once tempera-tures here fall below 106K (due to adiabatic expansion), mass
loading occurs mainly in the region of hot post-shock gas be-hind the blast wave, creating a “thick-shell” morphology (cf. Fig. 4b), resembling that of Cowie et al. (1981) and Dyson & Hartquist (1987).
3.5. Volume-averaged mass loading properties
In Fig. 5a we show the remnant-averaged mass-injection rate (rate of mass evaporation divided by the volume of the rem-nant) as a function of time. At early times, the entire remnant is above T =107K, hence conductive evaporation is saturated
and the remnant-averaged mass loading rate is approximately constant as the remnant expands (the small rise is caused by the increasing fractional volume of the hot shocked gas in the remnant). Once the average remnant temperature drops be-low 107 K the mass evaporation rate is no longer saturated
and ˙ρ, the rate of mass evaporation per unit volume, varies with time as ˙ρ∝t−2. This matches the behaviour found by Chi`eze &
Lazareff(1981), who adopt ˙ρ∝T5/2, for heavily mass loaded
remnants. This is a steeper dependence than the ˙ρ∝t−1
depen-dence found by White & Long (1991), which is a consequence of their particular description for mass loading ( ˙ρ∝T5/6).
From Figs. 5b and 6 we see that the majority of the mass evaporation from the embedded clouds occurs after the aver-age temperature of the remnant drops below 107 K. Once the
average remnant temperature drops below 105K mass
load-ing is effectively “switched off”, the remnant averaged mass injection rate drops sharply, leaving the power-law dependence on time, and the quantity of evaporated mass remains constant in the remnant from this time onwards. Interestingly, this quan-tity does not depend linearly on the mass loading factor f′ (Fig. 5b). Roughly half the evaporated mass is loaded after the average temperature has dropped below 106 K for the model
with n0 =0.01 cm−3 and f′=3.16. Hence our results should
not be strongly affected by the precise value of the tempera-ture Tsatat which conductive evaporation becomes saturated,
or by the initial conditions that we specify.
3.6. End of the QST stage
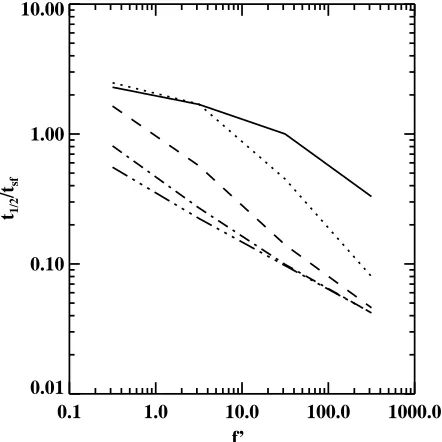
In Fig. 7, the ratio of the time at which the total energy of the remnant falls to one half of its initial energy, t1/2( f′,n0), to the
shell formation timescale, tsf(n0), defined in Eq. (8), is shown
as a function of the mass loading parameter f′for the five dif-ferent values of the ambient density used. This figure shows far more variation with n0than the equivalent figure in Paper I,
where the curve for the different values of the mass loading parameter lie on top of each other. In the conductively driven mass loading case the mass loading rate is sensitive to the ther-mal structure throughout the remnant, and radiative cooling, when it begins, occurs in a larger volume of gas (because of the “thick-shell” morphology). The radiative cooling rate thus depends on the density and temperature of the gas in this ex-tended region, which have a non-simple relation to the mass loading factor f′. In contrast, in the ablation cases discussed in Paper I, mass loading occurs in the narrow region just behind the blast wave, and so the amount of radiative cooling in this zone (which ultimately defines tQST) depends directly on the
104 105 106 0.0
0.2 0.4 0.6 0.8 1.0
Fractional volume
Time (yrs)
a) f’=3.16
104 105 106
0.0 0.2 0.4 0.6 0.8 1.0
Fractional volume
Time (yrs)
[image:11.595.121.505.83.293.2]b) f’=31.6
Fig. 6. The fractional volume of the remnant above a temperature of 105K (solid), 106K (dotted), and 107K (dashed) for n
0=0.01 cm−3 and
f′=3.16 a) or f′=31.6 b). At early times when the ejecta is being thermalized all of the shocked gas is hotter than 107K and the curves are
coincident in each case, and rising towards a value of 1.0. When the mass loading is stronger the remnant cools quicker.
0.1 1.0 10.0 100.0 1000.0 0.01
0.10 1.00 10.00
t1/2
/tsf
f’
Fig. 7. Ratio of the half energy time to the thin shell formation
time (t1/2/tsf) as a function of the mass loading parameter f′ for
the full range of intercloud ambient densities considered: n0 =0.01
(solid); n0 =0.1 (dotted); n0=1.0 (dashed); n0 =10.0 (dot-dashed);
n0=100.0 (triple dot-dash).
4. Discussion
4.1. The free expansion (FE) phase
Table 1 gives the total mass in the remnant at the end of the FE phase, MFE, for remnants with an initial energy, E=1051 erg,
[image:11.595.72.293.350.571.2]and ejecta mass, M = 10 M⊙. When there is no mass load-ing the total mass is independent of the ambient density (beload-ing approximately 56 M⊙, cf. Paper I), though with intermediate rates of mass loading (e.g. f′ ≈ 0.316) MFE becomes depen-dent on n0. For slightly higher mass loading rates ( f′ ≥3.16)
Table 1. The total mass, MFE(M⊙), in the remnant at the end of the free expansion stage for conductive mass loading. Apart from models
with f′=0.316, the mass is relatively invariant with n
0, being≈56 M⊙
for f′=0 and≈37 M⊙for f′≥3.16. E=1051 erg, M=10 M
⊙.
f′
n0 0.0 0.316 3.16 31.6 316
0.01 56.4 45.6 38.1 36.2 36.4
0.10 56.4 43.3 37.4 36.9 37.6
1.00 56.0 42.4 37.6 36.2 36.2
10.0 55.6 41.6 36.9 37.6 37.6
100.00 56.0 39.3 37.6 37.0 –
MFE ≈ 37 M⊙, and is insensitive to both f′ and n0. The fact
that MFE is dependent on f′for a given n0 is consistent with
Figs. 3b, d, f, where it can be seen that the remnant energy thermalizes more rapidly with increasing f′. This behaviour arises from the fact that mass loading reduces the rate at which the remnant expands at early times, as it causes more braking in the ejecta and sends the reverse shock back through it more quickly. In contrast, we note that MFE is essentially constant
when mass loading occurs by hydrodynamic ablation (Paper I). Since the mass loading is essentially saturated in both formu-lations at this stage, these differences arise from the fact that in this paper we also mass load in the shocked ejecta (unlike in Paper I), which has the effect of increasing its pressure.
In Fig. 8 we show the radius at the end of the free-expansion stage, RFE, as a function of n0 and f′. We derive an
ap-propriate analytical approximation for the dependence of RFE
on n0 and f′by following the same procedure as in Sect. 4.1
of Paper I. The agreement between the simulations and the ana-lytical approximation is generally good, although the latter sys-tematically underestimates RFEat high values of f′(as was also
0.01 0.10 1.00 10.00 100.00 0.1
1.0 10.0 100.0
RFE
(pc)
[image:12.595.317.507.84.289.2]n0
Fig. 8. Radius at the end of the free expansion stage as a function of ambient density. The symbols represent the results of the numer-ical simulations and the lines are from Eqs. (8) and (9) in Paper I,
appropriately modified for MFE,avg ≈ 47 M⊙, and using the relation
f′ = 316 f . The symbols and lines are: f′ = 0.0 (plus, solid);
f′=0.316 (diamond, dotted); f′=3.16 (triangle, dashed); f′=31.6
(square, dot-dashed); f′=316 (cross, triple dot-dashed).
estimates for RQST, the radius at the end of the
Quasi-Sedov-Taylor phase. We note that the much higher values of f which we consider in this paper lead to a greater range in RFE at a
given n0.
4.2. The Quasi-Sedov-Taylor (QST) phase
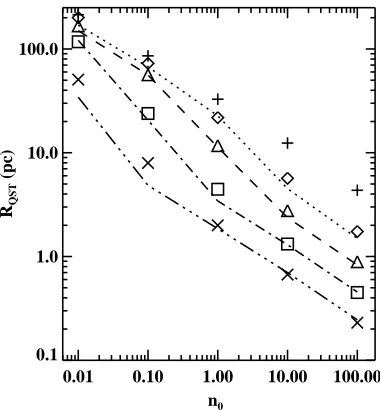
In Fig. 9 and Table 2 we show the variation of RQST with n0
and f′. We find that the expression
RQST f′,n0≈0.75RQST f′=0f′−0.0510−b tanh(n0/a), (12)
where a=6×10−0.9(1−e−x)x
, b=0.17 (log10f′+2.5)1.1, and x=
log10f′+0.5 achieves a good fit to the numerical results. We
plot values of RQSTusing Eq. (12) in Fig. 9.
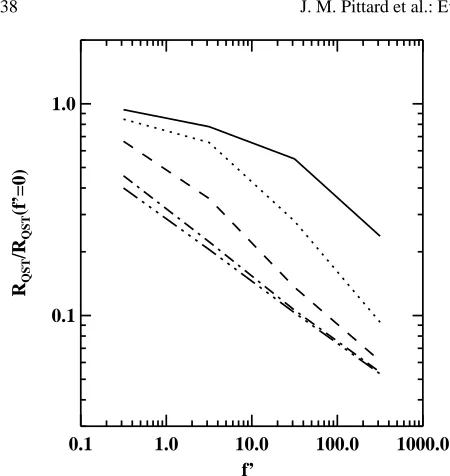
The ratio of the radius at the end of the Quasi-Sedov-Taylor phase to the radius at the same stage for the case where f′=0 (RQST/RQST( f′ = 0)) is shown in Fig. 10 for all f′ and n0.
Although there is variation with n0 for n0 ≤10, this ratio
ap-pears to become fairly insensitive to n0for larger values of f′.
We further note that the behaviour seen in Figs. 7 and 10 is qualitatively similar (which is also the case for ablative mass loading cf. Paper I).
For an ambient density, n0=0.01, the approximation noted
in Eq. (11) of Paper I, with substitution of f with f′, i.e.
RQST≈0.9RQST f′=0
10pf′−0.09log10f ′
, (13)
is a good fit, while for high ambient densities (n0 ∼100.0) an
excellent approximation is
log10[RQST/RQST( f′=0)]≈ −0.3log10f′−0.5. (14)
In the equations in this section it is again assumed that the rem-nants have an initial energy, E = 1051 erg, and ejecta mass, M =10 M⊙.
0.01 0.10 1.00 10.00 100.00 0.1
1.0 10.0 100.0
RQST
(pc)
[image:12.595.55.248.84.289.2]n0
Fig. 9. Radius at the end of the Quasi-Sedov-Taylor stage as a
func-tion of n0and f′. The symbols represent the results of the numerical
simulations and the lines are the analytic approximation of Eq. (12),
and denote f′=0.0 (plus); f′ =0.316 (diamond, dotted); f′=3.16
(triangle, dashed); f′ =31.6 (square, dot-dashed); f′ =316 (cross,
triple dot-dashed).
Table 2. The radius (pc) of a conductively mass loaded remnant at the
end of the Quasi-Sedov-Taylor stage. E=1051 erg, M=10 M
⊙.
f′
n0 0.0 0.316 3.16 31.6 316
0.01 214 201 167 117 50.7
0.10 85.8 72.6 56.4 23.9 7.97
1.00 32.8 21.8 11.7 4.45 2.00
10.0 12.4 5.67 2.77 1.32 0.67
100.00 4.35 1.74 0.89 0.45 0.23
5. Conclusions
[image:12.595.298.529.412.501.2]0.1 1.0 10.0 100.0 1000.0 0.1
1.0
RQST
/R
QST
(f’=0)
[image:13.595.66.291.68.306.2]f’
Fig. 10. Ratio of the radius at the end of the Quasi-Sedov-Taylor
phase to the radius at the same stage for the case where f′ = 0
(RQST/RQST( f′=0)) against f′for all n0: n0=0.01 (solid); n0 =0.1
(dotted); n0=1.0 (dashed); n0=10.0 (dot-dashed); n0=100.0 (triple
dot-dashed).
We are able to confirm some of the properties of conduc-tively mass loaded remnants predicted from self-similar solu-tions, and in particular find that such remnants may display a thick-shell morphology (cf. the hydrodynamic results sented in Cowie et al. 1981 and the similarity solutions pre-sented in Dyson & Hartquist 1987).
In this work we have been particularly interested in the range of conductively mass loaded supernova remnants at the time at which they have radiated away half of their initial en-ergy (see Table 2). It was noted in Sect. 2 that f′may be depen-dent on n0. This behaviour would pick-out a roughly diagonal
line in Table 2, and implies that the radius of remnants at the end of the quasi-Sedov-Taylor stage has less variance with n0
than would otherwise be the case. However, since f′is also de-pendent on the number density of cold clouds we do not expect a particularly tight relationship.
Simple approximations that fit the evolution of the range of supernova remnants which conductively mass load, and which are complementary to similar approximations in Paper I, have also been found. In both works it is assumed that the remnant has an initial energy, E = 1051 erg, and an ejecta mass, M = 10 M⊙. We expect that the evolution of remnants which ablatively mass load will be fairly insensitive to the progenitor mass, because the majority of the mass loading occurs after the FE stage ends, at which point the swept up mass is about 6 times greater than the progenitor mass. In the conduction case it is not so clear what will happen, because most of the mass loading occurs in the early stages when the remnant is becom-ing thermalized. Furthermore, the mass loadbecom-ing may well be
more dependent on our model assumptions (such as the satu-ration temperature, Tsat), than on the progenitor mass, at least
in some regions of parameter space. With regards to the possi-bility of different explosion energies, we note that our solutions should scale in a similar way to the time of thin shell formation,
tsf∝E3/14(cf. Eq. (8)).
Our range approximations will form the basis of future work to investigate galactic superwinds formed by the com-bination of many overlapping supernovae.
Acknowledgements. We would like to thank Dr. R. Bandiera for con-structive comments which led to clarification of our assumptions and generally improved the paper. JMP would also like to thank PPARC for the funding of a PDRA position. This work has made use of NASA’s Astrophysics Data System Abstract Service.
References
Arthur, S. J., & Falle, S. A. E. G. 1991, MNRAS, 251, 93 Arthur, S. J., & Falle, S. A. E. G. 1993, MNRAS, 261, 681 Arthur, S. J., & Henney, W. J. 1996, ApJ, 457, 752 Chevalier, R. A., & Blondin, J. M. 1995, ApJ, 444, 312
Chi`eze, J. P., & Lazareff, B. 1981, A&A, 95, 194
Chu, Y.-H., et al. 1999, New Views of the Magellanic Clouds, ed.
Y.-H. Chu, N. Suntzeff, J. Hesser, & D. Bohlender, IAU Symp.,
190, 143
Cioffi, D. F., McKee, C. F., & Bertschinger, E. 1988, ApJ, 334, 252
Cowie, L. L., & McKee, C. F., ApJ, 211, 135
Cowie, L. L., McKee, C. F., & Ostriker, J. P. 1981, ApJ, 247, 908 Cowie, L. L., & Songalia, A. 1977, Nature, 266, 501
Dyson, J. E., Arthur, S. J., & Hartquist, T. W. 2002, A&A, 390, 1063 (Paper I)
Dyson, J. E., & Hartquist, T. W. 1987, MNRAS, 228, 453 Falle, S. A. E. G., & Garlick, A. R. 1982, MNRAS, 201, 635 Falle, S. A. E. G., & Komissarov, S. S. 1996, MNRAS, 278, 586 Falle, S. A. E. G., & Komissarov, S. S. 1998, MNRAS, 297, 265 Franco, J., Miller, W. W., Arthur, S. J., Tenorio-Tagle, G., & Terlevich,
R. 1994, ApJ, 435, 805
Franco, J., Tenorio-Tagle, G., Bodenheimer, P., & Rozyczka, M. 1991, PASP, 103, 803
Gull, S. F. 1973, MNRAS, 161, 47
Hartquist, T. W., Dyson, J. E., Pettini, M., & Smith, L. J. 1986, MNRAS, 221, 715
McKee, C. F., & Cowie, L. L. 1977, ApJ, 215, 213 McKee, C. F., & Ostriker, J. P. 1977, ApJ, 218, 148
Pittard, J. M., Dyson, J. E., Falle, S. A. E. G., & Hartquist, T. W. 2001, A&A, 375, 827
Suchkov, A. A., Berman, V. G., Heckman, T. M., & Balsara, D. S. 1996, ApJ, 463, 528
Terlevich, R., Tenorio-Tagle, G., Franco, J., & Melnick, J. 1992, MNRAS, 255, 713