This is a repository copy of
Elimination of subharmonics in direct look-up table (DLT) sine
wave reference generators for low-cost microprocessor-controlled inverters
.
White Rose Research Online URL for this paper:
http://eprints.whiterose.ac.uk/857/
Article:
Abeyasekera, T., Johnson, C.M., Atkinson, D.J. et al. (1 more author) (2003) Elimination of
subharmonics in direct look-up table (DLT) sine wave reference generators for low-cost
microprocessor-controlled inverters. IEEE Transactions on Power Electronics, 18 (6). pp.
1315-1321. ISSN 0885-8993
https://doi.org/10.1109/TPEL.2003.818830
[email protected] https://eprints.whiterose.ac.uk/ Reuse
Unless indicated otherwise, fulltext items are protected by copyright with all rights reserved. The copyright exception in section 29 of the Copyright, Designs and Patents Act 1988 allows the making of a single copy solely for the purpose of non-commercial research or private study within the limits of fair dealing. The publisher or other rights-holder may allow further reproduction and re-use of this version - refer to the White Rose Research Online record for this item. Where records identify the publisher as the copyright holder, users can verify any specific terms of use on the publisher’s website.
Takedown
If you consider content in White Rose Research Online to be in breach of UK law, please notify us by
Elimination of Subharmonics in Direct Look-Up
Table (DLT) Sine Wave Reference Generators for
Low-Cost Microprocessor-Controlled Inverters
Tusitha Abeyasekera, C. Mark Johnson, Member, IEEE, David J. Atkinson, and Matthew Armstrong
Abstract—This paper investigates distortion of an inverter
refer-ence waveform generated using a direct look-up (DLT) algorithm. The sources of various distortion components are identified and the implications for application to variable speed drives and grid con-nected inverters are described. Harmonic and subharmonic distor-tion mechanisms are analyzed, and compared with experimental results. Analytical methods are derived to determine the occur-rence of subharmonics, their number, frequencies and maximum amplitudes. A relationship is established identifying a discrete set of synthesizable frequencies which avoid sub-harmonic distortion as a function of look-up table length and a practical method for calculation of the look-up table indices, based on finite length bi-nary representation, is presented. Real time experimental results are presented to verify the analytical derivations.
Index Terms—Distortion, harmonic, inverter reference
wave-form, subharmonic.
NOMENCLATURE
N Number of table elements. Sampling rate.
Table increment. Synthesized frequency.
n Sample number.
Initial phase angle.
W Integer part of table increment.
L, M Integers, L and M have no common factors, i.e., they are relative prime.
Frequency deviation.
k Harmonic number.
A Harmonic amplitude.
Base frequency. DLT Direct look-up table. SNR Signal to noise ratio. TD Total distortion.
THD Total harmonic distortion. PLL Phase locked loop. LSB Least significant bit.
Manuscript received October 25, 2002; revised May 7, 2003. Recommended by Associate Editor J. R. Rodriguez. This work was supported by The Engi-neering and Physical Sciences Research Council (EPSRC) of U.K. and Intelli-gent Power Systems Ltd. (IPS), Gateshead, U.K.
T. Abeyasekera, D. J. Atkinson, and M. Armstrong are with the Power Electronics Drives and Machines Group, School of Electrical Electronic and Computer Engineering, University of Newcastle upon Tyne, Newcastle NE1 7RU, U.K.
C. M. Johnson is with the Department of Electronic and Electrical Engineering, University of Sheffield, Sheffield S1 3JD, U.K. (e-mail: [email protected]).
Digital Object Identifier 10.1109/TPEL.2003.818830
I. INTRODUCTION
I
NCREASING usage of inverters sourcing power to motors, power grids and other sensitive loads has led to concerns over the quality of power generated by them and numerous ar-ticles have been published presenting harmonic distortion ana-lyzes of power generated by inverters. In majority of the cases, the sources of harmonic distortion are associated with inverter control, measurements and device nonidealities. However, it is clear that the spectral purity of the inverter output can only be as good as its [1]. Therefore factors affecting the quality of the inverter reference waveform are of increasing importance.It is also noted that this problem has been adequately dealt with in precision waveform synthesis with application to com-munications, acoustics and speech recognition [2]–[4]. How-ever the implications of this in the context of inverter power quality have not been investigated. This paper investigates dif-ferent types of distortions resulting in the degradation of the in-verter reference waveform, their implications and methods of suppression.
A. Sources of Harmonic Distortion
Among the many different methods used to synthesize ref-erence waveforms for inverters (treated in detail in Section II), the DLT method has wide spread application. Three main fac-tors are found to influence the harmonic content of a waveform synthesized via the DLT method.
• Finite word length of the table values:
This affects the vertical quantization of waveform samples [2]. Processors with adequate word length (24 or 32 b) reduce the error to a very low level. Detailed analysis of this for shorter word lengths has been presented in [5] and is not covered further in this paper.
• Effect of table length N: This has an overall effect on the waveform and is treated in Section III.
• Non-uniform sampling effect: This is caused by table index truncation and is the most significant source of distortion. It is treated in Sections III and IV.
B. Implications for Drives and Power Systems
Two main areas where distorted waveforms from inverters cause problems are variable speed drives (VSD) and grid connected power sources. In VSDs a sinusoid with varying fre-quency is required as a reference to the inverter. Harmonically distorted reference waveforms (generated via DLT method) would obviously deteriorate the quality of output power feeding
1316 IEEE TRANSACTIONS ON POWER ELECTRONICS, VOL. 18, NO. 6, NOVEMBER 2003
the motor. As a consequence, increased heating in inverter fed machines would lower efficiency and decrease operational life. Another problem caused by harmonics is torque oscillations in machine shafts. In multi-mass drive systems with low damping, torsional resonance could lead to fatigue and shaft breakage. An example is given in [6] where an interharmonic of 350 kW was responsible for fatigue failure of a 775 MVA Kramer drive. In power systems, grid connected inverters are now widely used to supplement power requirements. These inverters work in a similar way to that used in VSDs except that they feed power to a synchronised grid. Harmonics produced by grid connected inverters excite resonance and result in overvoltages and overcurrents, accelerating thermal ageing of insulation in devices connected to the grid. A more significant problem is caused in power systems by sideband frequency components occurring below the fundamental (subharmonics). Modern line transformers (especially armophorous core type) with high levels of permeability are very sensitive to even small levels of dc [7]. Therefore dc and low frequency components injected to the grid will result in line transformer saturation.
Current standards limit dc currents injected to the grid to, 5 mA (G77 [8]) and 0.5% (IEEE [9]) of the fundamental current component. Here, it is worth noting that, as the number and power ratings of grid-connected inverters increase, the damage caused by low amplitude current subharmonics may be considerable.
II. DIGITALREFERENCEWAVEFORMSYNTHESIS
In the widely used PWM scheme for single phase inverters, a reference sinusoid is compared with a triangular carrier wave and is used to generate the switching signals for the inverter bridge. Different techniques to generate the sine reference are proposed in the literature. Detailed analysis of these techniques and their relative merits is outside the scope of this paper but the interested reader could find them in [10], [11]. Table I of [10] identifies a trade-off between three main criteria, which are fundamental to the reference waveform synthesis problem. They are:
1) waveform quality; 2) run-time efficiency; 3) allocated memory.
Comparing these methods, the DLT method has been shown to provide a good compromise between efficiency and accuracy. Therefore this method is yet by far the most commonly used method for reference waveform generation in inverters, partic-ularly those employing low-cost microcontrollers.
III. DIRECTLOOK-UPTABLE(DLT) METHOD
A table of values of a complete sine wave cycle with an angle resolution is stored in memory. The sinusoidal waveform is generated by accessing the table at a given rate Hz. The frequency of the synthesised waveform is determined by the amount by which the table index is incremented in each sample period. Suppose the table index is accessed in
in-crements of at the rate of Hz. This would produce a sine wave of fundamental frequency
(1)
The maximum value of this is bounded by , which is the limit of to avoid aliasing. The synthesized waveform is a set of discrete values, given by
(2)
Note that although is in general a real number, the actual table index used must be an integer.
A. Non-Integer Implementation
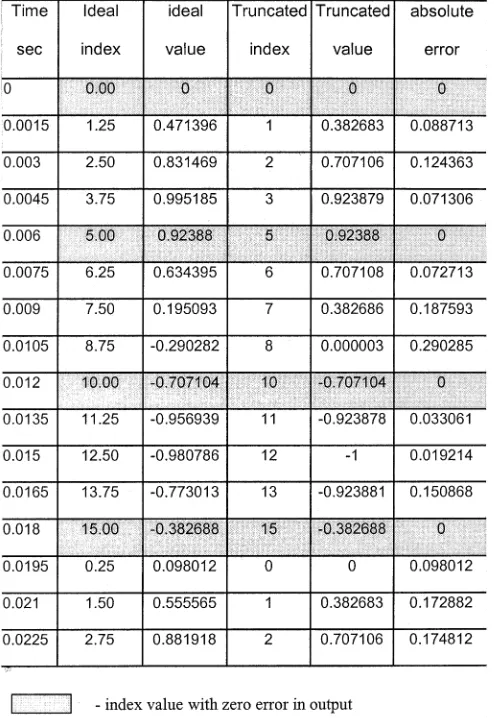
Consider a particular case of an inverter sourcing power to the grid. The synchronised inverter will be prone to grid fre-quency fluctuations, typically of %. The synchronization vice (say a PLL) determines the grid voltage frequency and de-mands a sinusoidal reference to be generated via the look-up table. However, since the table access algorithm can only work with integer index values, a truncation of will be done to the nearest whole number. Therefore, table values will be clocked out with a nonuniform phase increment resulting in a harmon-ically distorted sinusoidal waveform. Table I and Fig. 1 show a case where a look-up table is accessed in noninteger incre-ments. The truncated index column of the table shows the effect of nonuniform sampling due to the noninteger value.
B. Analysing the Non-Uniform Sampling Effect
Referring to Table I, one could observe that frequencies which result in noninteger values, produce the effect of nonuniform sampling of a sinusoid.
A noninteger can be decomposed to
(3)
where W, L, M are integers and L, M are relative prime numbers (i.e., they share no common factors)
for the case in Table I: .
Consideration of Table I shows that the truncated index coin-cides with the ideal index with a period of samples (or s). This interesting observation explains that, as is increased, the frequency of the output samples being equal to that of the ideal waveform becomes less, thus increasing the level of dis-tortion of the synthesized waveform. The disdis-tortions manifest itself in the form of different frequency components. These fre-quency components are split in to 4 groups, which are defined in Table II, [12].
Fig. 1. Comparision of synthesised waveforms for a noninteger table increment(1) value. Solid line shows the exact value and the symbols show the result obtained from the truncated index.
A mathematical derivation describing SNR as a function of and was provided by Jenq in [2].
The formula has been modified to accommodate TD instead of SNR to measure the quality of the signal
(5)
where
(6)
is the amplitude of the fundamental component. Substituting , i.e., for an integer value of
(7)
This verifies that distortion due to nonuniform index sampling in the synthesized waveform is not expected for an integer value of .
IV. EXPERIMENTALRESULTS
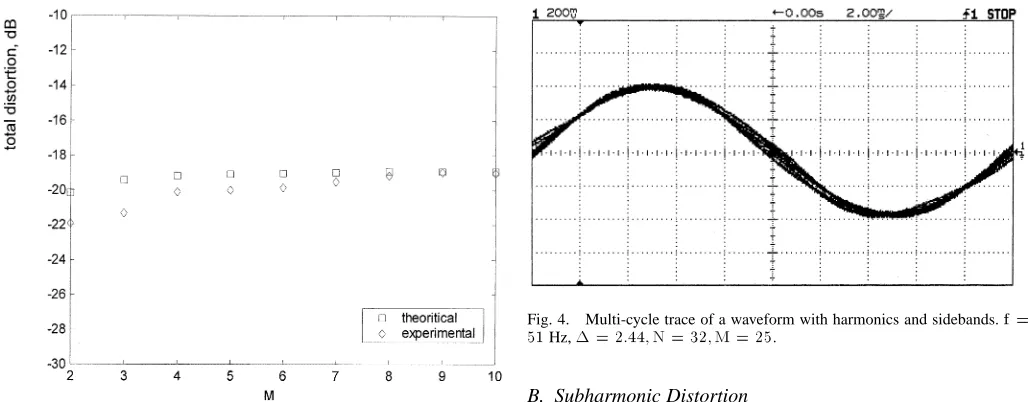
An experimental set-up based on a DLT algorithm imple-mented in code and run on a TMS 320 C31 platform was used to verify the theoretical concepts in Section III. Distor-tion analysis was done using the real time FFT funcDistor-tion of a HP 54602B oscilloscope. TD was experimentally determined by substituting measured distortion component amplitudes in (4). Fig. 2 shows the observed TD of the waveform as a function of M for a table of length . It is seen that TD of the wave-form remains constant at dB for values of M greater than 4. Fig. 3 shows TD of the waveform with relation to the word
TABLE I
TABLELOOK-UPSIMULATION FORf = 52:082 81 Hz,
f = 666:6 Hz, N = 16; = 1:25
TABLE II
DEFINITION OF THEVARIOUSHARMONICFREQUENCYCOMPONENTS
length of the table length, N for . (With the increase in N, the differences between subsequent table entry values decrease, reducing waveform distortion. The experimental data is in good agreement with the predicted curves of (5) and (6).
[image:4.612.305.552.101.460.2]1318 IEEE TRANSACTIONS ON POWER ELECTRONICS, VOL. 18, NO. 6, NOVEMBER 2003
[image:5.612.39.556.60.261.2]Fig. 2. Comparison of theoretical and real time total distortion data (TD) as a function ofM for N = 64.
Fig. 3. Comparison plots of theoretical and real time total distortion data (TD) as a function of table length,N, for M = 4.
A. Interharmonic Distortion
The generation of interharmonics can be explained as fol-lows: Consider a waveform being generated through Table I. It is clear that only each Mth sample is error free. Therefore the resulting disparity in the rate of sampling produces a sinusoid with a dynamic ripple (or jitter effect) seen in the time domain. The repetition interval of the jitter is s. This jitter ef-fect results in interharmonic distortion and interharmonic com-ponents can be seen separated by Hz in the frequency do-main. A sample of the waveform stored in the oscilloscope for 2 s is shown in Fig. 4. Note that a look up table of 32 elements was used to deliberately exaggerate the jitter effect.
Fig. 4. Multi-cycle trace of a waveform with harmonics and sidebands.f = 51 Hz, 1 = 2:44; N = 32; M = 25.
B. Subharmonic Distortion
Interharmonics occur above and below existing harmonics, of which a particular case would be an interharmonic below the fundamental frequency. These subharmonics are key factors in assessing low frequency distortion of inverter power sources. A subharmonic of significant amplitude below the line frequency would be highly undesirable. Higher order harmonics are less problematic since they are absorbed by the low pass filter char-acteristics of motors and power grids sourced by inverters and can in any case be easily removed by filtering. In this section, analytical formulas are derived and a method is proposed to de-termine occurrence of subharmonics, their numbers, relative po-sitions and amplitudes.
1) Sufficient Condition for the Occurrence of Subhar-monics: As shown by Jenq [2], each side-band/harmonic is separated by Hz. Thus the frequency of the kth harmonic may be written as
(8)
where is an integer for subharmonic frequency components
(9)
Combining (1), (3), (8), and (9)
(10)
The condition for at least one frequency component to be below the fundamental is therefore
(11)
For given values of , and N (3) can be used to calculate values of M, W, and L. Subharmonics occur if the inequality given in (11) holds true.
[image:5.612.45.296.333.548.2]3) Relative Positions in the Frequency Spectrum: Given values for k, M, , and , the value of can be found from (8). 4) Maximum Harmonic/Interharmonic Component Ampli-tudes: A full mathematical model of the harmonic structure of the synthesised waveform was derived by Jenq [2] as
(12)
where is the amplitude of the kth harmonic and is the value of modulo M.
The proof is given by Jenq [2] that, for , the sub-harmonic components in the frequency domain are merely in-terchanged. The scrambling of these harmonics/interharmonics
due to the change in will cause some
fre-quency components to lie in the subharmonic region. Fine har-monic structure analysis in [2] shows that the maximum value
of occurs when .
Therefore a simplified version of (12), for , is used as the base to calculate maximum possible amplitudes of the harmonic/interharmonic/subharmonic components
(13)
Using the observations made in [2], i.e., TD increases with M and for reasonably large N, (13) may be reduced to
(14)
Equation (14) provides a useful estimate of the maximum am-plitude of harmonic/interharmonic/subharmonic components as a function of table length N.
In most cases where inverters feed drives, power grids or other sensitive loads, regulations to limit subharmonic distortion are strict. Effective suppression of subharmonics can clearly be achieved by increasing table length N. However, this becomes infeasible in cost effective inverters based on micro controllers where memory requirements are restricted. A solution is there-fore proposed to identify the minimum length of the look-up table suppressing subharmonic distortion.
V. ELIMINATION OFSUBHARMONICDISTORTION
The fundamental criterion for the elimination of subhar-monics from a sinusoid generated via nonuniformly sampled look-up table may be deduced from (11)
(15)
[image:6.612.340.515.61.125.2]Although (15) provides an absolute determination of N, values of M and L are not deterministic and may vary over a virtually infinite range. It is evident from (15), that there is only a discrete set of synthesizable frequencies, free from subharmonic distor-tion. All other synthesized waveforms of frequencies violating (15) would contain subharmonic frequency components. It is therefore desirable to seek a method that allows determination of N as a function of required frequency , independent of L and M. This can only be achieved if values taken by L and M are restricted in accordance with (15). A convenient and a very
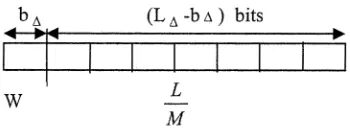
Fig. 5. Binary representation of incremental table index1.
practical method for restricting the values of M is to represent as a binary fraction.
(15) is re-written using (1) as
(16)
Taking logarithms on both sides, an inequality relating word lengths of N, M, and is obtained as
(17)
(18)
where, word length , Word length
contains the number of bits re-quired to represent the fractional binary value of . An example of binary representation of (3), in a 8 b micro-controller is shown in Fig. 5. Allocation of bits for the integer part and fractional part is arbitrary.
Given the above representation it is clear that, occurrence of sub-harmonics can be avoided in a sinusoid, generated via a look-up table accessed in nonuniform increments, if:
The minimum word length describing the table length , is 1 bit more than the word length of the incremental table index .
VI. EFFECT ON SYNTHESIZABLE FREQUENCY
RESOLUTION,
It is important to have adequate frequency resolution to pro-duce a reference waveform with an accurate frequency relative to the demanded inverter frequency. Mismatch in frequencies would obstruct the smooth flow of power between the inverter and the grid. The results of the previous section demonstrate that effective suppression of subharmonics can be achieved by restricting the synthesisable frequencies to a discrete set. Using the binary representation described above the number of discrete frequencies is limited to half the number of table elements. Al-though a larger number of frequencies can always be achieved by increasing table length, this is not always a cost-effective so-lution. Therefore, a method is proposed to determine the max-imum frequency resolution achievable with a given table length whilst retaining full suppression of subharmonic components.
Consider a typical application of a sinusoid generated via a look-up table as a reference signal for a grid connected inverter. fs and N are chosen so that the table is accessed in single steps , generating a base frequency of say 50 or 60 Hz. In a real grid the frequency rarely stays constant and may typically be an arbitrary value within Hz (2% deviation). A synchro-nising device, say a PLL, will extract information of the varying frequency of the grid and generate a sinusoidal reference signal to the inverter. For this case
1320 IEEE TRANSACTIONS ON POWER ELECTRONICS, VOL. 18, NO. 6, NOVEMBER 2003
where
(20)
Using (19) and (20)
(21)
The minimum frequency deviation relative to the base frequency is obtained as
(22)
Referring to Fig. 5, it is seen that the LSB of the binary word determines the resolution of change in
(23)
Substituting (23) in (22), an expression for frequency resolution is found as
(24)
Equation (24) relates the frequency resolution , N and the word length of of a DLT generated reference sinusoid free from subharmonic distortion.
VII. EXAMPLE
Consider the PLL of a grid connected inverter, locked in to a grid frequency of 50.5 Hz. Assume the sinusoidal reference waveform is generated using a look-up table of 32 elements ac-cessed at 1.6 kHz. The length of the look-up table is purposely chosen low to highlight subharmonic components.
• Using (1), , i.e.,
. • Using (11),
Therefore subharmonics would occur.
• Using (10), , i.e.,
.
• Using (8), to calculate subharmonic frequencies
[image:7.612.307.554.63.178.2]maximum subharmonic amplitude dB.
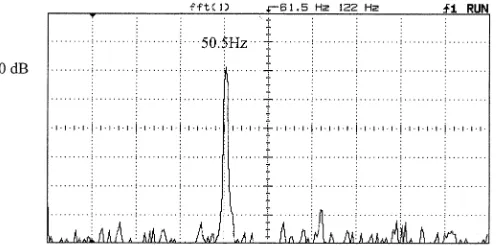
Fig. 6. Frequency spectrum of a synthesized waveform violating condition (11) resulting in subharmonic distortion.f = 50:5 Hz, N = 32; f = 1:6 kHz, observation periodT = 2 s.
Fig. 7. Frequency spectrum of a synthesized waveform satisfying condition (11), hence no subhanrmonic distortion. f = 50:5 Hz, N = 256; f = 1:6 kHz, observation period T = 2 s.
The Frequency spectrum of the waveform generated in real-time is shown in Fig. 6. Harmonic amplitudes are nor-malized to the fundamental (0 dB) and the vertical scale is 10 dB/div. All of the subharmonic frequencies shown are in agreement with the calculated values.
• Mitigation of Subharmonic Components
Using , condition (11) is satisfied and there-fore the frequency spectrum of the sythesized waveform, shown in Fig. 7, is free from subharmonic distortion. • Subharmonic Amplitudes
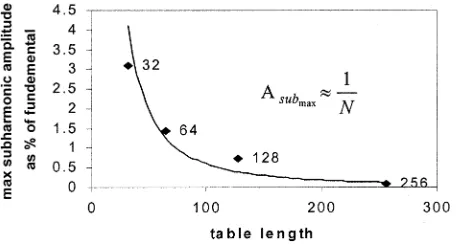
Tests were performed for four different table lengths and the experimental values of maximum subharmonic amplitudes determined. Fig. 8 shows the maximum am-plitudes plotted as a function of table length along with the theoretical data obtained from (14). Close agreement between the experimental and theoretical data verifies the utility of (14) as a design tool.
• Frequency Resolution
If now, the user needs to achieve a frequency resolution of say Hz without the generation of subhar-monics, then, by re-arranging (24), the minimum length of the look-up table may be determined
(25)
[image:7.612.306.554.242.365.2]Fig. 8. Experimental variation of maximum subharmonic amplitude with table length N. Solid line shows theoretical variation given by (14).
VIII. CONCLUSION
This paper has investigated harmonic, interharmonic and sub-harmonic distortion in inverter sinewave reference waveforms due to nonuniform sampling of a direct look up table. The ef-fect of table length on the maximum amplitude of the distortion component has been established and a mathematical model de-scribing the occurrence of subharmonics, their numbers and fre-quencies has been derived. Although, in general, the occurrence of subharmonic components is not deterministic, a constrained set of sythesizable frequencies may be found that is free of sub-harmonic distortion. The conditions for complete subsub-harmonic suppression have been determined in terms of the binary word lengths of look-up table parameters and applied to determine the minimum look-up table length that would avoid subharmonic distortion whilst achieving a given frequency resolution. A de-tailed example with experimental results has been used to verify the theoretical analysis. The results of this paper will be of use in specifying look-up tables for reference waveform generation in inverters, particularly those based on low cost micro-controllers.
REFERENCES
[1] D. Baker and V. Agelidis, “Phase-locked loops for microprocessor with reduced complexity voltage controlled oscillator suitable for inverters,” Proc. IEEE PEDES’98 Conf., vol. 1, pp. 464–469, 1998.
[2] Y. Jenq, “Digital spectra of nonuniformly sampled signals digital look-up tuneable sinusoidal oscillators,” IEEE Trans. Instrum. Meas., vol. 37, pp. 358–362, June 1988.
[3] S. Mehrgardt, “Noise spectra of digital sine-generators using the table look-up method,” IEEE Trans. Acoust. Speech Signal Process, vol. 31, pp. 1037–1039, Apr. 1983.
[4] D. L. Duttweiler and G. Messerschmitt, “Analysis of digitally gener-ated sinusoids with application to A/D and D/A converter testing,” IEEE Trans. Commun., vol. 26, pp. 669–675, May 1978.
[5] D. A. Grant, M. Stevens, and J. A. Houldsworth, “The effect of word length on the harmonic content of microprocessor-based PWM wave-form generators,” IEEE Trans. Ind. Applicat., vol. 21, pp. 218–225, Jan./Feb. 1985.
[6] R. Yacamini, “Power system harmonics, part 4—Interharmonics,” IEE Power Eng. J., pp. 185–193, 1996.
[7] , “Power system harmonics, part 3—Problems caused by distorted supplies,” IEE Power Eng. J., pp. 233–238, 1995.
[8] Recommendations for the connection of single-phase inverter-connected photovoltaic (PV) generators up to 5 kVA to public distribution net-works, Engineering Recommendation G77: 2000, 2000.
[9] Recommended practice for utility interface of photovoltaic (PV) systems, Standard P929, Dec. 1998.
[10] “Loughborough Sound Images plc,” Tech. Rep., 2003.
[11] M. Mirkazemi-Moud, T. C. Green, and B. W. Williams, “Analysis and comparison of real-time sine-wave generation for PWM circuits,” IEEE Trans. Power Electron., vol. 8, pp. 46–47, Jan. 1991.
[12] P. Syam P, P. K. Nandi, and A. K. Chattopadhay, “Improvement in power quality and a simple method of subharmonic suppression for a cyclocon-verter-fed synchronous motor drive,” Proc. Inst. Elect. Eng., vol. 149, no. 4, pp. 292–301, 2002.
Tusitha Abeyasekera received the M.Sc. degree
(with honors) in electromechanical engineering from Kiev Polytechnic Institute, Ukraine, in 1999 and is currently pursuing the Ph.D. degree in power quality improvements for grid connected PV inverters at the University of Newcastle upon Tyne, U.K.
In Kiev, his work was focused on sliding mode control of induction motor drives. Since then he has been working with the Power Electronics, Drives and Machines Group, University of Newcastle upon Tyne. His main research interests are in inverter control for utility and drive applications, power quality issues, nonlinear control, and multilevel inverters.
C. Mark Johnson (S’89–M’91) received the B.A.
degree in engineering and the Ph.D. degree in elec-trical engineering from the University of Cambridge, U.K., in 1986 and 1991, respectively.
From 1990 to 1992, he was a Research Associate at the University of Cambridge, investigating GTO thyristors for traction applications. In 1992, he was appointed Lecturer at the University of Newcastle, U.K., where his research included the design, analysis, and characterization of power semicon-ductor devices, resonant power conversion, and instrumentation. From 1998 to 2001, he managed the U.K. National Programme on Silicon Carbide Electronics and in 2000 he became Reader of Power Electronics at the University of Newcastle. In 2003, he was appointed Research Professor of Power Electronic Systems in the Electrical Machines and Drives Research Group, University of Sheffield, U.K. He continues to research power semiconductor devices, power device packaging, power module technologies and power electronic applications. His specialist interests include power electronics for hostile environments and the thermal and electromagnetic management of power electronic systems.
David J. Atkinson received the B.Sc. and Ph.D.
de-grees in electrical and elctronic engineering from the University of Newcastle upon Tyne, U.K., in 1978 and 1991 respectively.
He is currently a Senior Lecturer in the Drives, Power Electronics and Machines Group, Department of Electrical and Electronic Engineering, University of Newcastle upon Tyne. His research interests in-clude electrical drive systems, real time estimation and control, power electronics, wind and solar en-ergy. Prior to his university appointment, he had spent 17 years in the electronics industry including periods with NEI Electronics and British Gas Corporation.
Matthew Armstrong received the M.Eng. degree
from the University of Newcastle upon Tyne, U.K., in 1998.