Visualisation
Ayesh Alshukri, Frans Coenen, Yang Li, Andrew Redfern and Prudence W.H. Wong
AbstractOnline brand reputation is of increasing significance to many organisa-tions and institutes around the globe. As the usage of the www continues to increase it has become the most commonly used platform for users and customers of services and products to discuss their views and experiences. The nature of this www dis-cussion can significantly influence the perception and hence the success of a brand. Brand Reputation Mining (BRM) is a process to help brand owners to know what is being said about their brand online. This paper proposes a BRM framework to pro-vide support for enterprises wishing to conduct brand reputation management. The proposed framework can be generically applied to collect, process and display the reputation of different brands. A key feature is the visualisation facilities included to allow the display of the results of reputation mining activities. The framework is fully described and illustrated using a case study. The concepts expressed in this paper have been incorporated into the “LittleBirdy” brand reputation management product commercially available from Hit Search Ltd.
1 Introduction
Brand reputation has always been an important issue with respect to many organi-sations (both commercial and non-commercial), particularly in the context of con-sumer facing organisations. Recommendation and “word-of-mouth” are an impor-tant factor in how organisations are perceived and can have a subsimpor-tantial influence
Ayesh Alshukri and Andrew Redfern. e-mail:{AAlshukri, ARedfern}@hitsearchlimited.com Hit Search, Liverpool Innovation Park, L7 9NG.
Ayesh Alshukri, Frans Coenen, Yang Li and Prudence W.H. Wong. e-mail:{a.alshukri, coenen, y.li48, pwong}@liverpool.ac.uk. Dept of Computer Science, University of Liverpool, L69 3BX.
on the success, or otherwise, of an organisation; it is easy to tarnish a brand if neg-ative social activities are associated with it [9]. With the advent of the www, and the prolific use of social media, it has become very important for organisations to manage their online reputation. A growing percentage of users maintain that blogs and online fora are credible ways of finding out about products and services [9]. Or-ganisations that wish to preserve their reputation are therefore interested in knowing “what is being said about them” on social media. However, the increasing predomi-nance of Consumer Generated Content (CGC) on the www (examples include blogs, news forms, message boards and web pages/sites), makes it virtually impossible for organisations to manually monitor the reputation of their brand based on human effort alone [11]. One solution is to automate the process.
This paper proposes a framework for conducting effective Brand Reputation Mining (BRM). In this context BRM is concerned with the identification of “men-tions” expressed across electronic (social) media with respect to a particular com-pany, institution or organisation, and determination of the sentiment of such men-tions. The information gathered from such a BRM activity can be used by organ-isations to: (i) compare their performance against competitors, (ii) assess specific marketing strategies and (iii) gauge how a particular product or service is received in the market place. The successful conduct of BRM entails three broad challenges: (i) the identification and collection of mentions on www media (for example with respect to social networks, blogs and news sites); (ii) the application of data mining techniques to the gathered information in order to determine the sentiment associ-ated with opinions expressed in the form of mentions or to group mentions according to the views expressed; and (iii) the presentation of the data mining results obtained in a manner that allows it to be acted upon. In the case of the third challenge visu-alisation techniques are seen to be the most appropriate solution. However, such vi-sualisation also presents a significant challenge concerned with how best to present the data in a meaningful manner.
The proposed BRM framework can be generically applied to collect, process and display the reputation of brands belonging to organisations. The framework in-cludes mechanisms for the collection of information from www sources such as social media, news and blogs. The framework also includes mechanisms for mining the collected data, this includes: (i) the application of sentiment and opinion mining techniques and (ii) the discovery of topical groupings (using hierarchical cluster-ing). The most significant element of the framework is a collection of visualisation options whereby the BRM outcomes can be displayed so that users can effectively digest the collected information and obtain a view concerning their brand in the context of online media. The framework has been incorporated into a commercial brand reputation management system called LittleBirdy (www.littlebirdy.buzz).
2 Related Work
Social media is providing a new form of communication platform which is both unregulated and unofficial. By definition social media content is outside of the di-rect control of organisations [3]. However, social media activity can also provide substantial opportunities for organisations. For example the ability for organisations to be speedily aware of, and able to identify, disgruntled customers according to activity on social media is seen to be particularly beneficial in that organisations can quickly implement some action in an attempt to safeguard their product [2]. Another example is the swift identification of the use of copyrighted material on www fora such as YouTube (for video sharing), Flikr (for photograph sharing) and SlideShare (for presentation sharing), amongst many others [2]. BRM is therefore seen as an important aspect of the modern commercial world. It is thus not surpris-ing that there has been substantial recent work directed at BRM. Examples can be found in [4, 11, 9, 8, 10, 5].
The main focus of the work presented in Morinaga [4] is to determine the repu-tation of a company/brand by focusing on mining online opinions concerning their products. By using collected texts it is assumed that factual information about a product is not required, concentrating on opinion only so as to focus on the experi-ence of a product that individuals are writing about. The main distinguishing factor between Morinaga’s work and the BRM framework presented in this paper is the data mining approach. Morinaga does use sentiment analysis, but there is no topic discovery element as included in the BRM framework (which uses a hierarchical clustering approach for topic discovery).
In the work by Ziegler et al [11] a system is described that uses RSS (Rich Site Summary) feeds to collect news related to large corporations. The feeds are cate-gorised using taxonomies from the DMOZ open directory project www.dmoz.org. The BRM framework presented in this paper focuses on current trends in social media and blogs amongst other sources of information. This differs from Ziegler’s work where the focus of the reputation mining effort is directed at large corporations and only uses news feeds as the information source (no social media). It is argued that restricting BRM activity to news feeds may not be the most appropriate method of collecting brand mentions, particularly if we wish to focus on user opinions.
3 Formal Description
This section presents a formal description of the BRM problem. Amention of a particular brand comprises a body of text collected from an online social media site of some form. We use the notationmito indicate a particular mention. A data set comprisingnmentions, collected over a period of time, is denoted using the notation
M={m1,m2,· · ·,mn}. The content of each mentionmiis represented using a feature
vectorFi(how this is generated will become clear later in this paper) founded on
a feature-space model [7]. Each dimension in the feature space represents some attributeai whereby each attribute can take two or more values (if it could take
only one value it would be a constant and therefore not of interest with respect to the BRM). We indicate the set of values for an attributeai using the notation ai.V ={v1,v2,· · ·}, we indicate a particular valuevj associated with a particular
attributeaiusing the notationai.vj. Thus we have a global setAof attribute-value
pairs. Thus eachFiis a subset ofA(Fi⊂A). The complete data setMis therefore
represented by a set F of feature vectors such that F={F1,F2,· · ·Fn} (note that
there is a one to one correspondence betweenMandF). The first challenge is thus to translateMintoF.
OnceF has been established the next stage is to apply some sentiment min-ing to the content ofF. For each vector encoded mention inF we wish to attach a sentiment value. A coarse sentiment scoring was conducted using the label set {positive,negative,neutral}. Thus for each mentionmi∈M there exists a
corre-sponding sentiment labelsi∈S(whereS={positive,negative,neutral}). The most
appropriate sentiment label is derived using a classification algorithm which relies upon the features inFto assign a label to each mention. Details of the classification algorithm is presented in section 4.2.1.
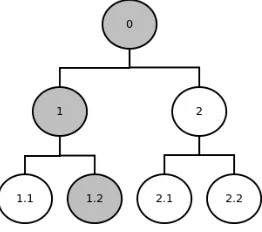
Fig. 1 Example of a BRM hierarchical clustering
The next stage in the proposed BRM framework (see below) is to describe the identified mentions in terms of a hierarchical structure using a hierarchical cluster-ing algorithm that uses the similarity of the features fromFfor each mention. Thus for each mentionmi∈M there exists a “path” in the hierarchyP={c1,c2,· · ·cx},
wherexdenotes the number of levels in the hierarchy andcidenotes the cluster ID
[image:4.612.236.367.417.533.2]1 represents the complete collection of mentions (so the setM) and is indicated by cluster 0. Level 2 shows the complete collection of mentions segmented into two groups, cluster 1 and cluster 2. Level 3 shows that clusters 1 and 2 have been further segmented into two sub-groups each indicated by the notation 1.1, 1.2, 2.1 and 2.2 respectively. Thus a mention that is a member of cluster 1.1 is also a member of cluster 1 and of course cluster 0 (as the latter contains all mentions). Figure 1 also shows a path (highlighted) associated with a particular mention,P={0,1,1.2}. Fur-ther details concerning the hierarchical clustering algorithm is presented in Section 4.2.2. It should be noted that this structure is independent of the sentiment score assigned to each mention, thus each cluster in the hierarchy will contain mentions that feature different sentiment labels.
4 Brand Reputation Mining Framework
This section presents details of the BRM framework which has been developed in order to address the challenges of BRM (as presented in Section 1 above). The framework comprises three stages: (i) data collection, (ii) data mining and (iii) vi-sualisation. Each of these is discussed in detail in the following three sub-sections.
4.1 Data Collection
Two main approaches are used for data collection. The first is a server side RSS reader and the second a social media related Application Programming Interface (API’s). Both approaches were utilised in order to collect and gather mentions at regular time intervals. For the first relevant RSS feeds need to be identified with respect to the brand in question. Examples include news website RSS feeds and in-dustry specific feeds which are updated on a regular basis. Social media platforms offer access, via an API, so that relevant mentions can be obtained based on a sub-mitted query. The query in this case needs to include terms related to the brand in question, for example brand name or related products and services.
The data is then processed and added to the collection of mentionsM(at the start
M= /0) in such a way that eachmi∈M has associated with it details of: (i) the
source it was gathered from and (ii) the time it was gathered. Gathering data from the web inevitable leads to duplication and noise. For this reason a parsing function was applied to each chunk of collected data in order to act as a filter to “clean” the received data before storage. This function first confirmed that the mentions in the currently collected data “reference” the brand in question, if not these mentions were removed. The parsing function then searched for and removed duplicate mentions in the data. Finally it checked that the remaining mentions weren’t already included in
cloud database. The collection process continues in this manner with new data being collected at regular intervals, mentions that have expired (are older than some user specified time span) are removed fromM so as to preventM from containing out of date information and/or scaling to a size where it can no longer be processed in almost real time. Once a reasonably sized collectionMhas been obtained it can be processed, analysed and viewed at any time.
4.2 Data Mining
The objectives of the data mining stage were: (i) to conduct sentiment analysis and (ii) the grouping of mentions into related topics. To achieve these objectives two data mining techniques were used. The first technique comprised a sentiment classifier using the class label set{positive,negative,neutral}. The second technique was a hierarchical clustering algorithm which was used to identify groupings of related topics in a hierarchy structure. This idea was to segment the data into related topics on a level by level basis. Grouping the mentions into topics allows for top level analysis to be done. For example identifying what the currently most popular topics related to a particular brand are and what the comparative preponderance of these topics is. Further details of these two processes are given below in the following two sub-sections.
4.2.1 Sentiment Analysis
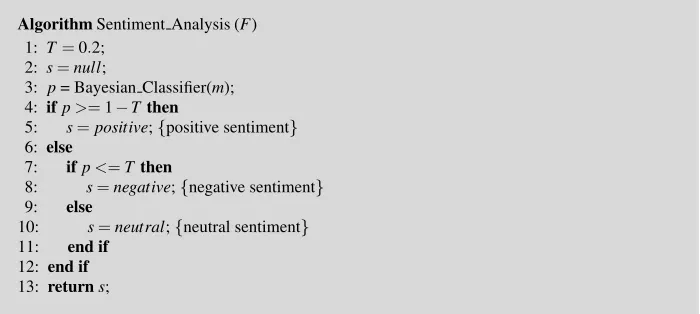
The sentiment analysis method used was based on an off the shelf, Naive Bayesian, sentiment classifier called uclassify (www.uclassify.com). The data set used to train the classifier was 40,000 Amazon product reviews from 25 different product genres [1]. This sentiment classifier was selected because: (i) it was directly related to the application of BRM, (ii) preliminary testing indicated that the recorded accuracy was acceptable compared with other sentiment classifiers considered, and (iii) the training data uses the same critical language style as that of someone commenting on a brand or service. The uclassify classifier requires input in the standard feature vector format, this a setFof the form described above. The classifier returns a value between 0 and 1, where 1 indicates a positive sentiment and 0 a negative sentiment. Table 1 shows the pseudo code for allocating a sentiment labels, taken from the setS={positive,negative,neutral}, to a mentionm. The input is a feature vector
F describing mentionm (as defined above). The output is a sentiment labelsto be associated with the mention. The sentiment mining algorithm first determines the polarity value associated with the mention m(line 3), the second part of the algorithm then determines the sentiment class label to be assigned to the mention using the polarity valuepand a thresholdT. Ifp≥1−T (line 4) thens=positive
AlgorithmSentiment Analysis (F) 1: T=0.2;
2: s=null;
3: p= Bayesian Classifier(m); 4: ifp>=1−Tthen
5: s=positive;{positive sentiment} 6: else
7: ifp<=Tthen
8: s=negative;{negative sentiment} 9: else
10: s=neutral;{neutral sentiment}
11: end if
12: end if
[image:7.612.126.476.96.253.2]13: returns;
Table 1 Pseudo code for the sentiment analysis algorithm.
used in the context of the work presented in this paper. Although a sentiment class label set of size three was used it is clear from the above that a larger number of class labels (depending on the application domain and end user requirements) could equally well have been adopted.
4.2.2 Hierarchical Clustering
The purpose of the hierarchical clustering, as noted above, is to group mentions into a hierarchical format such that each mention belongs to one cluster in each level of the hierarchy. This idea is to reduce the potentially large number of mentions that may have been identified by “compartmentalising” them into smaller groups which can be readily understood and further analysed. In other words the purpose of the clustering is to identify topic hierarchies within the collectionM. Once topic clus-ters have been identified statistical analysis can be conducted with respect to each cluster (topic or sub-topic). To obtain the desired hierarchical clustering a divisive (top-down) hierarchical clustering algorithm was used, the alternative would be a conglomerative (bottom-up) hierarchical clustering. Divisive hierarchical clustering operates in a breadth first manner by repeatedly dividing the candidates at each level and each branch of the growing hierarchy intokclusters. In effect it can be thought of as an iterativekmeans process.
configuration. Experiments were conducted using a variety of values forkand it was found thatk=3 produced the most effective results with respect to BRM. Proceduredivisive cluster (M,k)
1: if(|M|<k)then
2: exit 3: end if
4:C=set ofkclusters{c1,c2, . . . ,ck}
5: if(Silhouette Coefficient(C)>σ)then
6: exit 7: end if
8: for allci∈Cdo
9: M0=subset ofMinci
10: divisive cluster (M0,k)
11: end for
Table 2 Pseudo code for the hierarchical clustering procedure.
Once the hierarchical clustering had been completed each cluster was allocated a label designed to describe its content. This was done by extracting the words that appeared most frequently in the feature vectors representing the mentions contained in a given cluster and identifying the words whose occurrence count was above some threshold or if there were more than three frequently occurring words selecting the top 3. The identified words thus constituted the cluster label.
4.3 Visualisation
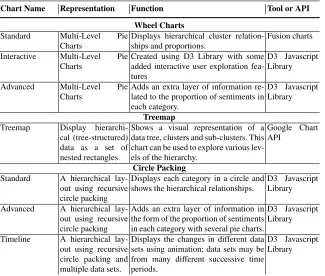
The following section presents details on the visualisation stage of the BRM frame-work. The objective of the visualisation stage is to effectively communicate the brand reputation patterns and new knowledge that has been determined in the pre-vious data mining stage (Section 4.2). The approach used to achieve this was to cre-ate a sequence of charts and diagrams, in a dashboard style interface, which made the information easily digestible by the end users of the system in a visually ap-pealing manner. The dashboard interface comprised several different visualisations, these individual visualisations can be categorised as follows: (i) Wheel Charts, (ii) Treemaps and (iii) Circle Packings. Each category of visualisation was developed in order to highlight a certain aspect of the data mining effort. The complete list of data mining visualisations is given in Table 3. Each of the visualisations is described in more details below.
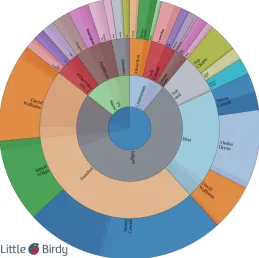
TheStandard Wheel Chartshows all clusters (with labels) in one visualisation. The Inner core of the wheel shows all the data; while each ring, moving to the outer edge, shows the sub clusters (identified by the hierarchical clustering) of the previous ring. This chart can be used to instantly see a comparison of the number of mentions in each of clusters.
Table 3 A list and description of the visualisation techniques provided with the BRM framework
Chart Name Representation Function Tool or API
Wheel Charts
Standard Multi-Level Pie Charts
Displays hierarchical cluster relation-ships and proportions.
Fusion charts
Interactive Multi-Level Pie Charts
Created using D3 Library with some added interactive user exploration fea-tures
D3 Javascript Library
Advanced Multi-Level Pie Charts
Adds an extra layer of information re-lated to the proportion of sentiments in each category.
D3 Javascript Library
Treemap
Treemap Display hierarchi-cal (tree-structured) data as a set of nested rectangles
Shows a visual representation of a data tree, clusters and sub-clusters. This chart can be used to explore various lev-els of the hierarchy.
Google Chart API
Circle Packing
Standard A hierarchical lay-out using recursive circle packing
Displays each category in a circle and shows the hierarchical relationships.
D3 Javascript Library
Advanced A hierarchical lay-out using recursive circle packing
Adds an extra layer of information in the form of the proportion of sentiments in each category with several pie charts.
D3 Javascript Library
Timeline A hierarchical lay-out using recursive circle packing and multiple data sets.
Displays the changes in different data sets using animation; data sets may be from many different successive time periods.
D3 Javascript Library
a cluster the chart is transformed so that this cluster becomes the “root node” in the centre of the chart. This allows for fast exploration of the hierarchical clustering outcomes. Large volumes of data can be explored by navigating clusters and sub-clusters in this manner.
TheAdvanced Wheel Chartdisplays the hierarchical clusters within each level as segments of a wheel. The cluster size of each sentiment category is displayed as a variation of the main colour for each cluster. Adding the sentiment information as an extra layer of data, means this chart can be used as an alternative interpretation to the wheel charts above while still maintaining the advantages of viewing large data sets effectively.
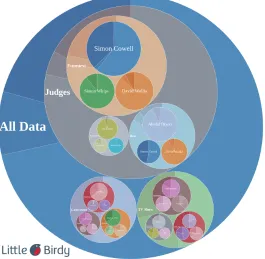
TheStandard Circle Packing Chartis constructed by representing the clusters within a level of the hierarchy as a pie chart. An algorithm is then used to recursively display all clusters and sub-clusters in one chart.
TheAdvanced Circle Packing Chartis constructed based on the standard circle packing chart but in this case adding an extra layer of information which shows the sentiment categories and their relative cluster sizes.
TheTimeline Circle Packing Chartis a variation of the advanced circle pack-ing chart described above, but with an animation element. This chart can display mentions at various points in time. This chart can also display changes to cluster sizes and sentiment categories as the chart cycles over various points.
5 Case Study
The most appropriate mechanism for gaining an appreciation of the operation of the BRM framework is by considering an example. This section therefore presents a case study which uses the presented BRM framework as applied to a specific “real world” brand reputation problem. Section 5.1 describes the scenario used and how the data set was derived. Section 5.2 presents the resulting visualisations produced by the BRM framework with respect to the brand used in this case study.
5.1 Data set
The particular data set used as a focus for the case study is the popular TV talent show “Britain’s Got Talent” (BGT); other countries have a similar show. The show provides a forum for members of the public to audition, a panel of judges select the best acts which then go on to the next stage where each week a number of contestants get voted off; this continues until there is one winner. This particular brand was selected as it is an example of a popular brand that has a significant presence on social media where “debates” are conducted concerning the antics of the contestants, presenters and the panel of judges. The collated BGT data set comprised 14,280 Twitter mentions, collected from April to June 2013.
5.2 Results
This sub-section describes the outputs from using the BRM framework with respect to the BGT brand. The first part of this sub-section presents the results from the hierarchical clustering algorithm. The second part concentrates on the visualisation of the combined hierarchical clustering and sentiment analysis.
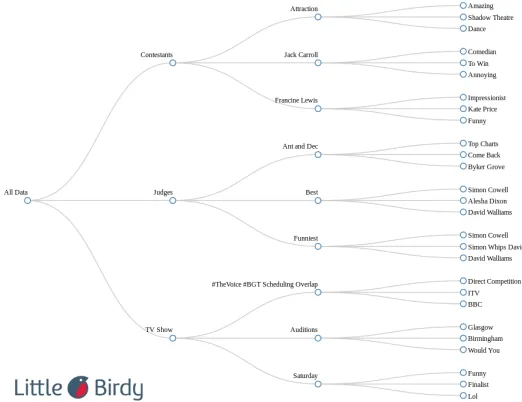
The hierarchical clustering algorithm was applied to the BGT data set. The re-sulting output is shown in Figure 2. From the figure it can be seen that the clustering algorithm identified some clear groupings regarding the BGT dataset. In particular it can be seen that the BGT brand has a clear set of top level sub topics related to the judges, contestants, presenters and the TV show itself. From the sub-clusters it can be seen that the TV show topic contains sub-topics regarding dissatisfaction with the scheduling overlap of BGT and another popular TV talent show (“The Voice”). With respect to the generic application of the BRM framework, this could be a particu-lar brand with clusters showing the most popuparticu-lar talking points reflected on social media. This could also highlight issues with competitor’s products or services.
Fig. 2 Illustration of the hierarchical clusters within the BGT data set.
TheAdvanced Wheel Chartis shown in Figure 3. The chart shows all the hi-erarchical clusters and the cluster sizes with respect to each sentiment. The cluster with the most fragmented sub-clusters can be seen very easily (clusters at the top of the chart in Figure 3). The “TV show” and “Contestant” clusters have smaller sized sub-clusters representing more in-depth topics, for instance certain locations for au-ditions, and so on. The larger clusters represent topics of much broader interest. These cluster topics can be related to a more general aspect of the BGT brand.
[image:11.612.166.427.300.501.2]that may have had a previously unknown association with the brand. An example in the BGT case is that of the presenters topping the music charts with a re-released song. The sentiment categories are displayed in a pop-up box when the user hovers over a cluster.
Fig. 3 Advanced Wheel Chart for the BGT data set.
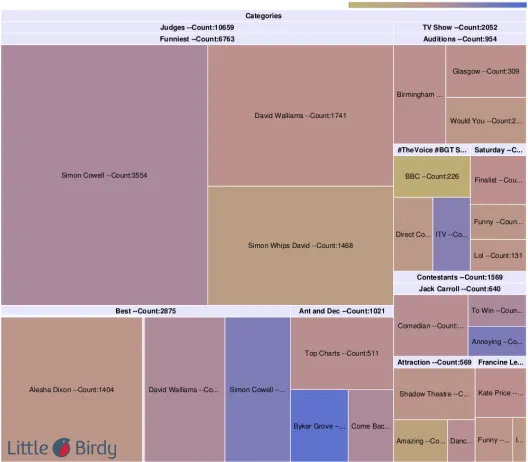
TheTreemap Chartis shown in Figure 4. The chart shows blocks of varying sizes and colours. The size is a reflection of the number of mentions, colour is used to indicate the overall sentiment category of a cluster, in this case red is neg-ative while blue is positive. This chart very clearly highlights the sentiment of the most popular clusters within the hierarchy. For example it can be seen that the “Si-mon Cowell” cluster (top right) has an overwhelming negative sentiment while the “Byker Grove” (a no longer running TV show in which the presenters were fea-tured) cluster (bottom left) has mostly positive sentiment. The Treemap chart allows the user to quickly make a comparison of the clusters and their associated sentiment at a single glance. Thus it can be seen that the popularity of the judges is indicated by the size and colour of the blocks, this is shown in the case of judge “Simon Cowell” (negative sentiment) and “Byker Grove” (positive sentiment).
[image:12.612.170.429.148.406.2]Fig. 4 Treemap Chart for the BGT data set.
and sentiment categories as the chart is “cycled” through time. It can thus be used to display changes in cluster size and sentiment of the various cluster topics over (say) a number of weeks. In terms of more generic brand reputation mining this can be considered as a mechanism for displaying change in brand perception over time.
6 Conclusion
[image:13.612.169.433.98.329.2]Fig. 5 Circle Packing Chart for the BGT data set.
References
1. J. Blitzer, M. Dredze, and F. Pereira. Biographies, bollywood, boom-boxes and blenders: Domain adaptation for sentiment classification.ACL, 2007.
2. A. M. Kaplan and M. Haenlein. Users of the world, unite! The challenges and opportunities of Social Media.Business Horizons, 53(1):59–68, January 2010.
3. W. G. Mangold and D. J. Faulds. Social media: The new hybrid element of the promotion mix.Business Horizons, 52(4):357–365, July 2009.
4. S. Morinaga, K. Yamanishi, K. Tateishi, and T. Fukushima. Mining product reputations on the web. InThe eighth ACM SIGKDD international conference on Knowledge discovery and data mining, pages 341–349. ACM New York, NY, USA, 2002.
5. M. Morzy. New Algorithms for Mining the Reputation of Participants of Online Auctions. InFirst International Workshop, WINE 2005, volume 52, pages 112–121, Hong Kong, China, 2005. Springer Berlin Heidelberg.
6. P. J Rousseeuw. Silhouettes: a graphical aid to the interpretation and validation of cluster analysis.Journal of computational and applied mathematics, 1987.
7. G. Salton, A. Wong, and C. S. Yang. A vector space model for automatic indexing. Commu-nications of the ACM, 18(11):613–620, November 1975.
8. F. Skopik, H. Truong, and S. Dustdar. Trust and reputation mining in professional virtual communities.Web Engineering, pages 1–15, 2009.
9. S. Spangler, Y. Chen, and L. Proctor. COBRA Mining web for corporate brand and reputation analysis.Web Intelligence and Agent Systems, pages 246—-254, 2009.
10. J. Yi and W. Niblack. Sentiment mining in WebFountain. InProceedings. 21st International Conference on Data Engineering, ICDE 2005, pages 1073 – 1083, 2005.
[image:14.612.170.435.96.355.2]