1
A Dissertation on
A PROSPECTIVE RANDOMIZED COMPARATIVE STUDY OF
USG GUIDED RADIAL ARTERY CANNULATION BY LONG AXIS
AND MODIFIED SHORT AXIS TECHNIQUE
submitted to
TAMILNADU DR. M.G.R. MEDICAL UNIVERSITY
In partial fulfillment of the requirements For the award of the degree
M.D. (Branch-X)
ANAESTHESIOLOGY
GOVERNMENT STANLEY MEDICAL
COLLEGE & HOSPITAL
THE TAMILNADU DR. M.G.R. MEDICAL UNIVERSITY
CHENNAI, TAMILNADU
2
DECLARATION BY THE CANDIDATE
I, Dr. AISHVARYA SHREE N, solemnly declare that the dissertation, titled ‘A PROSPECTIVE RANDOMIZED COMPARATIVE STUDY
OF USG GUIDED RADIAL ARTERY CANNULATION BY LONG
AXIS AND MODIFIED SHORT AXIS TECHNIQUE’, is a bonafide work done by me during the period of AUGUST 2017 to SEPTEMBER 2017 at Government Stanley Medical College and Hospital, Chennai under the expert guidance of Prof. Dr. SEVAGAMOORTHY, M.D., D.A., Professor, Department Of Anaesthesiology, Government Stanley Medical College & Hospital, Chennai.
This dissertation is submitted to The Tamil Nadu Dr. M.G.R. Medical University in partial fulfillment of the rules and
regulations for the M.D. degree examinations in Anaesthesiology to be held in May 2018.
Chennai-1
3
CERTIFICATE BY THE GUIDE
This is to certify that the dissertation titled, ‘A PROSPECTIVE RANDOMIZED COMPARATIVE STUDY OF USG GUIDED
RADIAL ARTERY CANNULATION BY LONG AXIS AND
MODIFIED SHORT AXIS TECHNIQUE’, is a genuine work done under my supervision and guidance, by Dr. AISHVARYA SHREE N, for the partial fulfillment of the requirements for M.D. (Anaesthesiology)
Examination of The Tamil Nadu Dr. M.G.R. Medical University to be held in May 2018
Prof. Dr.SEVAGAMOORTHY, M.D., D.A.,
Professor of Anaesthesiology,
Department of Anaesthesiology & Critical care, Stanley Medical College & Hospital,
4
CERTIFICATE BY THE HOD
This is to certify that the dissertation titled, ‘A PROSPECTIVE RANDOMIZED COMPARATIVE STUDY OF USG GUIDED
RADIAL ARTERY CANNULATION BY LONG AXIS AND
MODIFIED SHORT AXIS TECHNIQUE’, is a genuine work done by
Dr.AISHVARYA SHREE N, under the expert guidance of
Prof.Dr.SEVAGAMOORTHY, M.D., D.A., for the partial fulfillment of
the requirements for M.D. (Anaesthesiology) Examination of The Tamilnadu Dr. M.G.R. Medical University to be held in May 2018.
Prof. Dr. Prof.DR.KUMUDHA LINGARAJ, M.D., D.A.
The Head of the department,
Department of Anaesthesiology &Critical care,
Stanley Medical College & Hospital.
5
CERTIFICATE BY THE DEAN
This is to certify that the dissertation titled, ‘A PROSPECTIVE
RANDOMIZED COMPARATIVE STUDY OF USG GUIDED
RADIAL ARTERY CANNULATION BY LONG AXIS AND
MODIFIED SHORT AXIS TECHNIQUE’, presented herein by
Dr.AISHVARYA SHREE N, is an original work done in the Department of Anaesthesiology, Government Stanley Medical College and Hospital, Chennai in partial fulfillment of regulations of the Tamil Nadu Dr. M.G.R. Medical University for the award of degree of M.D. (Anaesthesiology) Branch X, under the supervision and guidance of Prof.
Dr.SEVAGAMOORTHY, M.D., D.A., during the academic period
2015-2018.
Prof. Dr.S.PONNAMBALA NAMASIVAYAM M.D., D.A.,DNB,
DEAN,
Government Stanley Medical College & Hospital,
6
ACKNOWLEDGEMENTS
I wish to express my sincere thanks to Prof.Dr.S. PONNAMBALA
NAMASIVAYAM M.D., D.A., DNB., Dean, Government Stanley Medical College and Hospital for having permitted me to utilize the facilities of the hospital for the conduct of the study.
My heartfelt gratitude to thank Prof.DR.KUMUDHA LINGARAJ, M.D., D.A., Professor and Head, Department of Anaesthesiology, Government Stanley Medical College and Hospital for her motivation, valuable suggestions, expert supervision, guidance and for making all necessary arrangements for conducting this study.
I thank Prof.Dr. SEVAGAMOORTHY M.D.,D.A., for his constant encouragement, guidance and support.
I thank Prof. Dr. V.NALINI, M.D, D.A., for her constant encouragement and support.
I thank Prof.Dr NAHEED AZHAR, M.D., for his constant motivation, immense support and valuable suggestions in carrying out this study. I thank Prof.Dr.DHANASEKARAN,M.D.,D.A., for his constant support and encouragement throughout the study.
7
parameshwari and Dr. Arun who had evinced constant and keen interest in the progress of my study right from the inception till the very end and were instrumental in the msuccessful completion of my study.
I thank Dr. Venkatesan for helping me in the statistical analysis. My sincere thanks to all the post graduates who helped me during this study period.
I thank the staff nurses and the theatre personnel for their cooperation and assistance.
8
9
S.NO TOPIC P.NO
1. INTRODUCTION 11
2. AIM AND OBJECTIVES 12
3. PRINCIPLES INVOLVED IN IABP MONITORING 13 4. COMPONENTS OF THE IABP SYSTEM 14 5. PRINCIPLES INVOLVED IN ULTRASONOGRAM 31 6. ANATOMY OF THE RADIAL ARTERY 41 7. INDICATIONS FOR IABP MEASUREMENT 44 8. CONTRAINDICATIONS FOR IABP MESUREMENT 45 9. COMPLICATIONS OF IABP MEASUREMENT 46
10. MODIFIED ALLENS TEST 48
11. TECHNIQUES OF RADIAL ARETRY
CANNULATION 49
12. REVIEW OF LITERATURE 54
13. MATERIALS AND METHODS 59
14. RESULTS AND ANALYSIS 66
15. DISCUSSION 85
16. LIMITATIONS 90
10
18.
ANNEXURES
a) BIBLIOGRAPHY b) PROFORMA
c) ETHICAL COMMITTEE APPROVAL LETTER d) PATIENT INFORMATION SHEET
e) INFORMED CONSENT FORM f) PLAGIARISM CERTIFICATE g) MASTERCHART
11
INTRODUCTION
Intra-arterial blood pressure (IABP) measurement is often considered to be the gold standard for blood pressure measurement. Percutaneous radial artery cannulation is a procedure done commonly in operating room and in the intensive care units. Thus a thorough understanding of the relevant anatomy, procedural skills and the complications of the procedure is essential.
The first recorded arterial cannulation was performed in 1714 by the reverend, Stephen Hales. Continuous recording of arterial blood pressure during the perioperative period with small plastic catheters was first described in 1949 by Peterson et all. He inserted them into the brachial artery through a metal needle. In 1953, the Swedish radiologist Sven Seldinger described the now used catheter over guide wire technique. Radial artery is most commonly chosen for arterial cannulation for its ease of access and high success rate. Any failure during cannulation requires multiple attempts but this may cause arterial spasm making any further attempt difficult.
12
and enhanced tissue penetration for identification and desired intervention is available.
The ultrasound guidance for radial artery cannulation had been shown to increase the rate of cannula insertion success in the first attempt thus reducing complications.
AIM AMD OBJECTIVES
The aim of this study is to compare the traditional long axis approach with the modified short axis approach for radial
artery cannulation.
PRIMARY OBJECTIVES
1. success of First insertion attempt 2. Cannulation time
SECONDARY OBJECTIVES
1.ultrasonic location time 2 . Number of attempts
3 .Number of redirections
13
GENERAL PRINCIPLS INVOLVED IN ARTERIAL PRESSURE
MONITORING
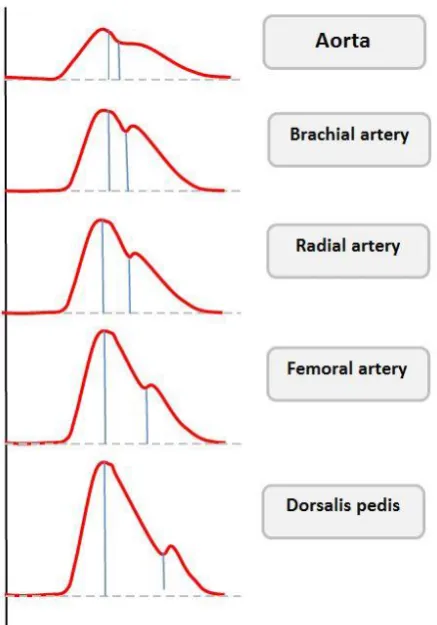
The measurement of arterial pressure waveform is to be done in ascending aorta. The measurement in peripheral arteries differs from central aorta. The systolic pressure in the dorsalis pedis artery is higher than in the radial artery ,which is in turn higher than that in the aorta1. The pulse waveform gets distorted like the disappearance of certain high frequency components that is the dicrotic notch. There is also increase in the systolic peak pressure, decrease of the lowest diastolic pressure (fig:1). This modification of the waveform is caused by the change in diameter of the vessels and their elasticity and also because of the
14
fig:1 variations in arterial wave contour from central to peripheral arteries
COMPONENTS OF AN IABP MESURING SYSTEM
When the artery is cannulated a direct measurement of blood pressure can be obtained with the help of an infusion system, transducer and recorder.
Intra-arterial cannula:
15
the risk of arterial thrombus formation. Although non-ported venous cannulas can be used, (non-ported to reduce the risk of inadvertent injection) there are a number of specially designed arterial cannulas available. The risk of arterial thrombus formation is directly proportional to the diameter of the cannula, hence small-diameter cannulas are used (20-22g), however, this may increase damping in the system. The radial artery is the most commonly used site of insertion as it usually has a good collateral circulation and is easily accessible.
Fluid filled tubing:
This is attached to the arterial cannula, and provides a column of non-compressible, bubble free fluid between the arterial blood and the pressure transducer for hydraulic coupling. Ideally, the tubing should be short, wide and non-compliant (stiff) to reduce damping – extra 3-way taps and unnecessary lengths of tubing should be avoided where possible. This tubing should be colour coded or clearly labelled to assist easy recognition and reduce the risk of intra-arterial injection of drugs. A 3-way tap is incorporated to allow the system to be zeroed and blood samples to be taken.
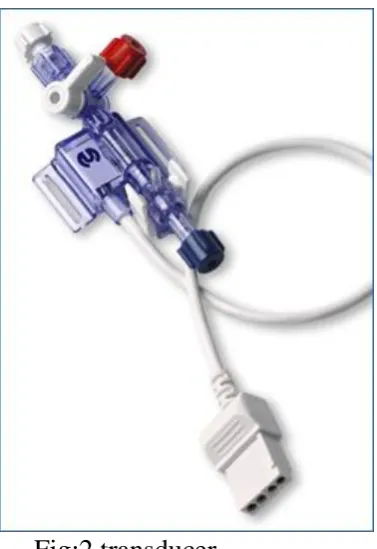
Transducer:
16
Infusion/flushing system:
A bag of either plain 0.9% saline or heparinised 0.9% saline is pressurised to 300mmHg and attached to the fluid filled tubing via a flush system. This allows a slow infusion of fluid at a rate of about 2-4ml/hour to maintain the patency of the cannula. A flush system will also allow a high-pressure flush of fluid through the system in order to check the damping and natural frequency of the system and to keep the tubing clear.
Signal processor, amplifier and display :
17 Fig:2 transducer
PHYSICAL PRINCIPLES INVOLVED:
Sinewave:
[image:17.596.94.283.68.343.2]A wave is a disturbance that travels through a medium, transferring energy but not matter. One of the simplest waveforms is the sine wave (fig:3) . These may be thought of as the path of a point travelling round a circle at a constant speed and are defined by the function y = sin x.
18
Sine waves may be described in terms of their amplitude – their maximal displacement from zero, their frequency which is the number of cycles per second (expressed as Hertz or Hz), their wavelength, which is the distance between two points on the wave which have the same value (e.g. two crests or troughs) and their
phase, which is the displacement of one wave as compared with another – expressed as degrees from 0 to 360.
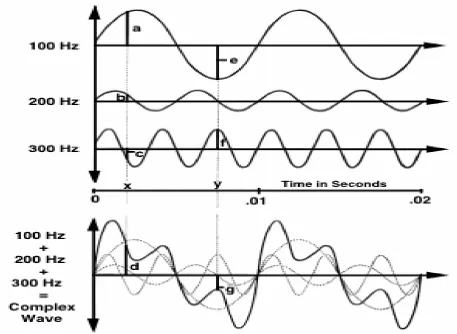
Sine waves are of particular importance as any waveform may be produced by combining together sine waves of differing frequency, amplitude and phase. Another way of looking at this is that any complex wave can be broken down into a number of different sine waves.
Fourier Analysis :
19
a series of harmonic waves. These are smaller waves whose frequencies are multiples of the fundamental frequency (fig 4).
The process of analyzing a complex waveform in terms of its constituent sine waves is called Fourier Analysis. In the IABP system, the complex waveform is broken down by a microprocessor into its component sine waves, then reconstructed from the fundamental and eight or more harmonic waves of higher frequency to give an accurate representation of the original waveform.
20 Fig:4 fourier analysis
21
NATURAL FREQUENCY AND RESONANCE
Every material has a frequency at which it oscillates freely. This is called its natural frequency. If a force with a similar frequency to the natural frequency is applied to a system, it will begin to oscillate at its maximum amplitude. This phenomenon is known as resonance.
Resonant systems may be very useful. The basilar membrane in the cochlear of the ear is an example of a biological system that works on the principles of natural frequency and resonance. The basilar membrane at the apex of the cochlear has a lower natural frequency than at the base. Sound waves with lower frequencies will therefore cause the basilar membrane to resonate and oscillate maximally at the base of the cochlear, whilst high frequency sound waves will cause the basilar membrane at the base of the cochlear to resonate, allowing the ear to differentiate between sounds of different pitch. However, resonant systems may also be very destructive.
22
If the natural frequency of an IABP measuring system lies close to the frequency of any of the sine wave components of the arterial waveform, then the system will resonate, causing excessive amplification, and distortion of the signal. In this case, an erroneously wide pulse pressure and elevated systolic blood pressure would result. It is thus important that the IABP system has a very high natural frequency – at least eight times the fundamental frequency of the arterial waveform (the pulse rate). Therefore, for a system to remain accurate at heart rates of up to 180bpm, its natural frequency must be at least: (180bpm x 8) / 60secs = 24Hz.
The natural frequency of a system is determined by the properties of its components. It may be increased by:
• Reducing the length of the cannula or tubing
• Reducing the compliance of the cannula or diaphragm • Reducing the density of the fluid used in the tubing • Increasing the diameter of the cannula or tubing
23
24
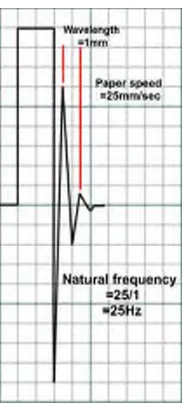
Fig:5 Finding out the natural frequency by a fast flush test
Transducer:
A transducer is any device that converts energy from one form into another and are usually used for measurement or monitoring.
Pressure transducers are used in IABP systems. These convert the arterial pressure waveform into an electrical signal that can then be measured, processed and displayed.
25
commonest method is with a strain gauge. Strain gauges are based on the principle that the electrical resistance of wire or silicone increases with
increasing stretch. The flexible diagram is attached to wire or silicone strain gauges and then incorporated into a Wheatstone bridge circuit in such a way that with movement of the diaphragm the gauges are stretched or compressed, altering their resistance.
Strain gauges have now evolved into such tiny devices that they can be used within cannula tips – such as in some ICP monitors. These systems are, however, prone to fibrin deposition and baseline drift. They cannot be calibrated after insertion and so become less accurate with time.
26
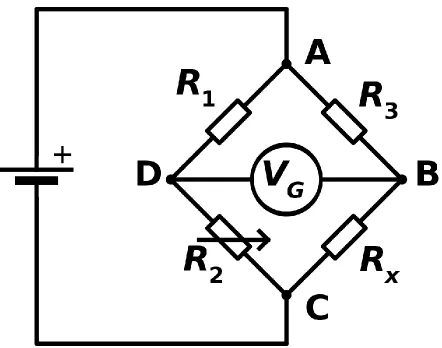
The Wheatstone Bridge:
The Wheatstone bridge is a circuit designed to measure unknown electrical resistance. Classically, these were arranged with three resistors of known resistance and one of variable resistance (the strain gauge). When the ratio of the resistors on the known side of the circuit (R2/R1) equals the ratio on the other side of the circuit (R3/Rx) the bridge is balanced, no current will flow and no potential difference will be measured by the galvanometer (VG). When the resistance of the strain gauge (Rx) changes due to pressure applied to the attached diaphragm, the two sides of the bridge become unbalanced and a current flows. The resulting potential difference is measured by the galvanometer and is proportional to the magnitude of the pressure applied.
27
[image:27.612.72.514.202.550.2]gauge Wheatstone bridge (fig 6). It also compensates for any temperature change as all of the strain gauges are affected equally (temperature will affect the resistance of a strain gauge so in the single gauge setup, a change in temperature will skew readings).
28
Damping :
Anything that reduces energy in an oscillating system will reduce the amplitude of the oscillations. This is termed damping. Some degree of damping is required in all systems (critical damping), but if excessive (overdamping) or insufficient (underdamping) the output will be adversely effected (fig 7). In an IABP measuring system, most damping is from friction in the fluid pathway. There are however, a number of other factors that will cause overdamping including:
• Three way taps
• Bubbles and clots • Vasospasm
• Narrow, long or compliant tubing • Kinks in the cannula or tubing
29
and low DBP, as in a resonant signal. A compromise between over and under-damping must be therefore be found.
[image:29.612.79.531.359.585.2]If a brief burst of energy is applied to a critically damped system, for example quickly flushing an IABP system, after displacement, the wave returns to the baseline, without any overshoot. Critical damping is therefore defined as the minimal amount of damping required to prevent any overshoot. The damping co-efficient in a critically damped system is 1. However, this does result in a system that is relatively slow to respond.
30
Levelling and zeroing:
Zeroing:
For a pressure transducer to read accurately, atmospheric pressure must be discounted from the pressure measurement. This is done by exposing the transducer to atmospheric pressure and calibrating the pressure reading to zero. Note that at this point, the level of the transducer is not important. A transducer should be zeroed several times per day to eliminate any baseline drift.
Levelling:
The pressure transducer must be set at the appropriate level in relation to the patient in order to measure blood pressure correctly. This is usually taken to be level with the patient’s heart, at the 4th intercostal space, in the mid-axillary line. Failure to do this results in an error due to hydrostatic pressure (the pressure exerted by a column of fluid – in this case, blood) being measured in addition to blood pressure. This can be significant – every 10cm error in levelling will result in a 7.4mmHg error in the pressure measured; a transducer too low over reads, a transducer too high under reads.
31
PRINCIPLES INVOLVED IN THE ULTRASONOGRAM:
Ultrasound waves are generated by piezoelectric crystals in the handheld probe. These crystals generate an electrical current when a mechanical stress is applied to them. This is called the piezoelectric effect. The ultrasound probe acts as both a transmitter and receiver . The probe cycles between generating ultrasound waves 1% of the time and “listening” for the return of ultrasound waves or “echoes” 99% of the time. Using the piezoelectric effect, the piezoelectric crystals in the handheld probe convert the mechanical energy of the returning echoes into an electrical current, which is processed by the machine to produce a two-dimensional grayscale image that is seen on the screen. The image on the screen can range from black to white. The greater the energy from the returning echoes from an area, the whiter the image will appear.
Hyperechoic areas have a great amount of energy from returning echoes and are seen as white. Hypoechoic areas have less energy from returning echoes and are seen as gray. Anechoic areas without returning echoes are seen as black
32
Acoustic impedance is the resistance to the passage of ultrasound waves, the greater the acoustic impedance, the more resistant that tissue is to the passage of ultrasound waves. The greatest reflection of echoes back to the probe comes from interfaces of tissues with the greatest difference in acoustic impedance.
The ultrasound transducer:
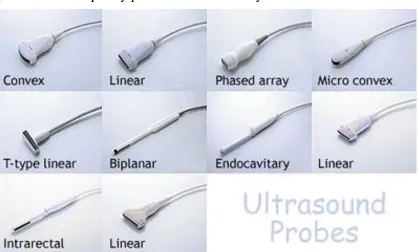
[image:32.612.75.494.392.644.2]Ultrasound transducers, can be categorized based on their frequency range, low frequency vs. high frequency, and the shape of the probe, curved vs. linear. The high-frequency probes are linear array probes(fig 8). They have less tissue penetration but good near-field image resolution. low-frequency probes. Low-frequency probes are curved array .
Fig: 8 different types of Ultrasound transducers
33
Depth :
The depth of tissue imaged can be adjusted on the machine. Low-frequency probes will be able to image deeper tissue depths than high-frequency probes. With a linear array probe, as the depth is increased, the image on the screen will appear narrower and structures will appear smaller, but the width of the field of view is relatively constant.
Frequency:
Variable-frequency probes allow changes in frequency within a narrow range. An 8 to 13 MHz probe allows selection of frequency between 8 and 13 MHz. The lower frequencies are used for deeper structures and the higher frequencies are used for more superficial structures.
Gain:
34
Time gain compensation (TGC):
This allows selective control of gain at different depths. Ultrasound waves returning from deeper structures have undergone greater attenuation. To compensate for the loss of signal intensity, TGC allows for stepwise increase in gain to compensate for greater attenuation of ultrasound waves returning from deeper structures. Time gain compensation controls should be moved to the right in a stepwise fashion to “amplify” the returning signal from the deeper structures.
Color-flow Doppler:
35
The more parallel the probe is to the direction of flow, the easier it is for the ultrasound machine to detect flow.
Pulse-wave Doppler:
Pulse-wave Doppler provides flow data from a small area along the ultrasound beam. The area to be sampled can be selected by the operator. Once pulse-wave Doppler is selected, the image is frozen and the operator selects the area to be sampled. The pulse-wave information is displayed graphically at the bottom of the screen as well as heard.
Resolution:
Resolution is the ability to distinguish two close objects as separate and this is very important in ultrasound. There are two types of resolution – axial and lateral.
Axial resolution:
36
emitted intermittently as the probe has to wait and listen for the returning echoes.
Pulse: a few sound waves of similar frequency.
Pulse length: the distance a pulse travels.
Pulse repetition frequency: the rate at which pulses are emitted per unit of time.
Lateral resolution:
37
Artifacts:
Reverberation artifact:
The processing unit in the ultrasound machine assumes echoes return directly to the processor from the point of reflection. Depth is calculated as D¼VT, where V is the speed of sound in biological tissue and assumed to be 1,540 m/sec, and T is time. In a reverberation artifact, the ultrasound waves bounce back and forth between two interfaces (in this case the lumen of the needle) before returning to the transducer. Since velocity is assumed to be constant at 1,540 m/sec by the processor, the delay in the return of these echoes is interpreted as another structure deep to the needle and hence the multiple hyperechoic lines beneath the block needle.
Mirror artifact:
A mirror artifact is a type of reverberation artifact. The ultrasound waves bounce back and forth in the lumen of a large vessel (subclavian artery). The delay in time of returning waves to the processor is interpreted by the machine as another vessel distal to the actual vessel.
Bayonet artifact:
38
differences in the speed of ultrasound through different biological tissues. The delay in return of echoes from tissue that has slower transmission speed, coupled with the processor’s assumption that the speed of ultrasound is constant, causes the processor to interpret these later returning echoes from the tip of the needle traveling in tissue with slower transmission speed as being from a deeper structure and thus giving a bayoneted appearance. If the tip is traveling through tissue that has faster transmission speed, then the bayoneted portion will appear closer to the transducer.
Acoustic enhancement artifact:
Acoustic enhancement artifacts occur distal to areas where ultrasound waves have traveled through a medium that is a weak attenuator, such as a large blood vessel. Enhancement artifacts are typically seen distal to the femoral and the axillary artery.
Absent blood flow:
39
Acoustic shadowing:
Tissues with high attenuation coefficients, such as bone, do not allow passage of ultrasound waves. Therefore any structure lying behind tissue with a high attenuation coefficient cannot be imaged and will be seen as an anechoic region.
NEEDLE INSERTION:
In plane technique:
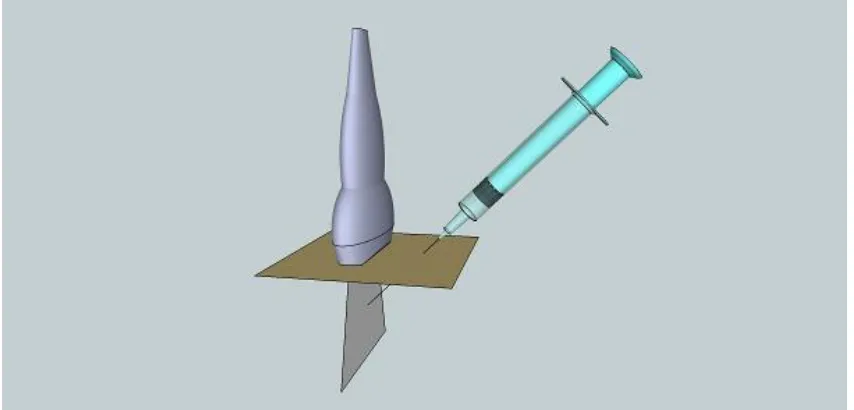
[image:39.612.73.407.530.687.2]The needle is inserted in the same plane as the ultrasound beam. The path of the needle should be entirely within the beam of ultrasound(fig 9). The more parallel is the needle to the (shallower the angle of insertion) probe, the more easily it will be visualized. Inserting the needle right next to the probe will make the angle of insertion steep and will lead to poor visualization of the needle.
40
The width of the ultrasound beam can be compared to the width of the credit card. When the needle is partially within the beam and partially outside it is said to be partial plane. The part of the needle at the edge of the beam appears as the tip which can lead to dangerous events. Hence this technique must be avoided.
Out of plane technique:
[image:40.612.71.498.386.591.2]Here the needle is perpendicular to the beam of ultrasound (fig 10). The needle is seen as a small hyperechoeic dot on the screen. The steeper the angle of insertion the easier it is to find the tip of the needle.
41
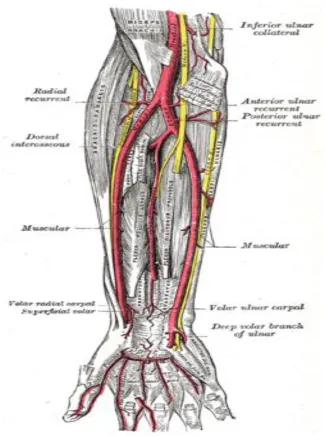
ANATOMY OF THE RADIAL ARTERY:
The radial artery originates just below the elbow as a branch of brachial artery. It then courses along the lateral margin of the forearm until it reaches the wrist. In the upper forearm the artery is deep to the body of the supinator longus muscle. In the mid forearm, down to the level of the wrist4, the
artery lies between the tendons of supinator longus and flexor carpi radialis. Variations in both the origin and course are well described. The most common one being the artery originating just superior to the elbow, but also it may originate much higher in the arm. High origination from the brachial artery is reported in up to 12% of cases while 5% of people have its origination within the axilla.
42 fig:11 course of the radial artery in forearm
43
44
INDICATIONS FOR RADIAL ARTERY CANNULATION:
1) Surgeries where severe bloods loss is anticipated7
2) In patients where beat to beat monitoring of blood pressure is essential e.g. patients with arrhythmias, ischemic heart disease
3) Places where noninvasive method fails e.g. morbidly obese, severe burns 4) Surgeries where serial ABGs are needed e.g. neurosurgery, cardiothoracic
surgery, prolonged duration
45
CONTRAINDICATIONS FOR RADIAL ARTERY CANNULATION8,9:
Absolute:
1) Diseases that cause inadequate circulation to the extremities e.g. raynauds syndrome, thrombo angitis obliterans, buergers disease
2) Infections over the site of cannulation
Relative:
46
COMPLICATIONS
Infection:
Infection is a potential complication common to all of the invasive monitoring10. It is caused by infected skin site, bad aseptic technique
during insertion, poor maintenance of the indwelling catheter, prolonged duration of cannulation, non-disposable transducer domes, contaminated arterial blood gas syringes, dextrose flush solution11,12.
The catheter is to be removed only when infection at the cannulation site or catheter-related bloodstream infection is confirmed. Lymphangitis streaks or cellulitis due to catheter infection require systemic antibiotic therapy.
Skin necrosis:
Skin necrosis is probably caused by thrombosis of radial artery with proximal advancement of thrombosis to its cutaneous branches.
Thrombosis and distal ischemia :
47
cannulation. The incidence of thrombosis is not affected by the technique of cannulation. It is found that pretreatment with aspirin can reduce this complication.
Embolization:
This is caused by flushing forcefully the particulate matter or air into the arterial catheter. Cerebral embolization most commonly arises from axillary catheters but can also arise from brachial and radial artery catheter. Factors associated with increased risk of embolization are speed of injection, volume of the flush solution and proximity of intraluminal tip of catheter to central circulation16,17,18.
Hematoma and neurologic injury:
Formation of hematoma at the arterial puncture site can be prevented by applying direct pressure after puncture or correction of the underlying coagulopathy. Posterior puncture in iliac or femoral arteries can lead to massive hemorrhage in the retroperitoneal area. Surgical consult might rarely become necessary19,20.
Nerve damage:
48
IMPORTANCE OF PERFORMANCE OF MODIFIED ALLENS TEST
The modified allens test measures the arterial competency and is performed before radial artery cannulation.
Procedure:
Ask the patient to clench their fist. If they are not able to do it we can close their hand tightly. Using our fingers occlusive pressure is applied to the ulnar and radial arteries to obstruct the blood flow to the hand. Complete occlusion is evidenced by the blanching of the palms. If not, then the arteries are completely occluded. Now the pressure over the ulnar artery is released and the test is interpreted as follows.
Positive modified allens test:
If the ulnar artery has good blood flow, then the hand will flush within 5 to 15 seconds21. This is considered a positive test.
Negative modified allens test:
49
TECHNIQUES OF RADIAL ARTERY CANNULATION
Conventional technique:
[image:49.612.76.296.543.705.2]The distal portion of the forearm is the area of maximal pulsation for radial artery. Here it is palpated between the radius and the tendon of the flexor carpi radialis. The catheter is directed towards the artery at an 30-45° angle, with the bevel of the needle upwards. Once pulsatile flow appears within the cannula, the needle is brought closer to the hand to an angle of approximately 15° - 30° and advanced 0.5 mm farther into the lumen of the artery, and the catheter threaded into the artery(fig 12). Successful placement of the catheter is confirmed by observing a transduced arterial blood pressure waveform. Since the artery is not visible on the skin surface carrying out a correct puncture is challenging. Further more advancement of the catheter requires greater technical skill than making a puncture. Thus these difficulties has led to different aides and modifications for radial artery cannulation.
50
Aid for radial artery cannulation:
1) Radial artery cannulation has been performed by a guidewire-assisted technique in which after the artery is punctured and confirmed by a flashback of blood, a guidewire is advanced into the arterial lumen. Then the needle is removed and the arterial catheter is advanced over the guidewire. Once the catheter enters into the artery, the guidewire is removed and the catheter fixed to the forearm. This method of a guidewire-assisted radial artery cannulation technique has been preferred than a direct technique mainly in pediatric patients. This technique is easy and safe.
Fig:13
2) Identification of vessel using trans illumination technique has also been used for radial artery cannulation in children.
[image:50.612.201.413.374.534.2]51
2mm intervals until backflow is observed has been described. The radial artery cannula is then inserted just distal to hypodermic needle. The hypodermic needle is removed from the artery as the catheter is being placed.
4) Pressure curve directed technique has also been described. The radial artery cannula attached to pressure transducer after flushing it. This assembly is then inserted for radial artery cannulation in conventional technique. The arterial waveform suggests successful arterial cannulation.
5) The ultrasound-guided technique has also been used. The radial artery is localized by ultrasound and the cannula is advanced to perforate the skin slightly distally to the transducer. It is then directed towards the vessel in an angle of approximately 45°. The further advancement is guided by minimal ultrasound scanning of the artery and its close vicinity. When the cannula appeared to be within the vessel, the transducer is removed and catheterization is done.
52
Fig:14 ultrasound Doppler probe
7)‘Liquid stylet' for percutaneous radial artery cannulation has been reported. A syringe with 3 ml saline is attached tightly to a 20gauge cannula whose distal end is located in the radial artery. When pulsatile backflow of blood is present 1-2 ml of blood is aspirated without moving the cannula, confirming location of the cannula in the vessel lumen. Slowly and steadily 1-3ml of fluid is injected from the syringe with one hand while the other slowly advances the catheter into the vessel lumen behind the “liquid stylet” created by the injection. When the hub of the catheter reaches the surface of the skin, 1-2 ml of blood is again aspirated to confirm location of the catheter tip in the artery.
53
Modified techniques:
The radial artery can also be cannulated in the dorsum of the hand where it emerges from the anatomical snuff box instead of usual volar aspect. The advantage of this method is the preservation of the palmer branch of radial artery and thus sparing the collateral vessels and so less chance of digital ischemia.
Antegrade radial arterial cannulation has been used for pressure monitoring successfully after the cut down approach. This was attempted after failed retrograde cannulation of the radial artery. During this, pressure measurement was of ulnar artery via palmer arch. antegrade arterial cannulation can be successfully used when radial arteries are obstructed and retrograde blood flow is observed during failed cut down attempts at standard retrograde arterial cannulation.
54
REVIEW OF LITERATURE
RANDOMIZED CONTROL TRIALS:
A meta-analysis conducted by xiang-dong et all reviewed 13 trials with 2402 patients22. Their findings were as follows; the dynamic
2D ultrasound compared with traditional palpation technique significantly reduced the first attempt failure. Using a 2D ultrasound further reduced mean attempts to success, mean time to success and complications. Doppler ultrasound has no benefit on first attempt failure compared with traditional palpation. Compared with palpatory method, USG guided radial artery cannulation was associated with a 84% improvement in first attempt success. They summarized that ultrasound guidance is superior to traditional palpatory method for radial artery cannulation even in small children and infants.
Study by Levin et al showed the first attempt success rate with USG to be 62% compared to the 34% using palpatory method alone in 69 adult patients who underwent elective surgery23.
55
Schwemmer et al25, studied infants posted for major
neurosurgery. They reported a success rate of 100% in the USG group, compared to 80% in the palpation group. The first-pass success rate was 67% in the USG group and 20% in the palpation group. The higher success rate of USG group may be due to the ability to visualize even small vessels by ultra sound.
However, there are some randomized controlled trials that have produced equivocal results. USG did not help in faster catheterization of radial artery in 152 pediatric patients by anesthesiologists who were inexperienced in both palpation and USG techniques. Also, the percentage of successful catheterization, total number of attempts and number of catheters used did not differ significantly between the groups. But in many instances where an inexperienced operator failed to cannulate by palpation method, an experienced ultrasound operator could successfully place it with USG. (Ganesh et al26)
In 112 patients undergoing puncture of femoral artery for interventional investigations, Dudeck et all27 found that USG should be used to access the femoral artery in patients with leg circumference of 60 cm or more, or in patients with weak arterial pulse. In those patients, procedure time was reduced compared to traditional palpation techniques.
56
CASE SERIES:
Techniques of USG have progressed from initial phase of Doppler ultrasound to advanced modalities like B-mode and color duplex US.
Xiuyan li et all28 conducted a study in 88 ICU shock patients. They were randomized into a palpation group and the ultrasound group for the radial artery cannulation. Here the out of plane approach was first used to observe the diameter, depth, trajectory and the surrounding tissues. Then the in-plane approach was used for arterial cannulation. The dose of vasopressors and the mean arterial pressure were not statistically significant in both the groups. Even in hemodynamically compromised patients the success rate of first puncture was significantly higher in the ultrasound group than in the palpatory group. The failure rate and puncture duration were shorter in the ultrasound group. Incidence of hematoma were significantly lower in the ultrasound group. This study concluded that radial artery cannulation with out of plane orientation an in-plane guidance tends to combine the advantages of both the methods that significantly improved the success rate for first puncture and reduced the incidence of complications.
Amna et all29 compared the ultrasound guided
57
no statistically significant difference in mean time for cannulation and number of cannulas used in both groups. They concluded by saying more expertise was needed to obtain improved results.
Nagabhushan et all30, showed an enhanced
cannulation of radial artery and a reduced need for arterial cut-down in patients who were hypotensive or with absent or barely palpable pulses26.
CASE REPORTS:
There are several case reports of the usage of USG for arterial cannulation.
Kannan et all31 described a case report of USG guided brachial artery catheterization when traditional attempts failed. Catheterization was possible in a single attempt and arterial pulsations were well visualized despite the presence of extensive interstitial fluid.
White et all32 found high level of evidence for
58
Berk et all33 concluded that the cannulation time
was shorter in long axis in plane group compared to short axis out of plane group. The arterial cannulation by long axis in plane approach increase the rate of cannula insertion success in the first attempt (76%) compared to short axis out of plane approach (57%). They also found that the long axis in pane approach results in shorter cannulation time and decreased incidence of complications.
Ganesh et all34 conducted a study to compare
ultrasound guided radial artery cannulation with traditional palpation technique in pediatric population. The operator was successful at the first attempt cannulation in only 66% and 69% in the palpation and ultrasound groups respectively. There were no statistically significant differences between the groups with respect to time, number of attempts and no of cannula used for catheterization.
Zhe feng et all conducted a study to compare modified short axis out of plane with long axis in plane technique. The cannula insertion success on the first attempt in the modified group is statistically
59
METHODOLOGY
STUDY DESIGN:
Prospective, randomized study
INCLUSION CRITERIA:
1. Age 20 to 80 years
2. ASA I – III PS in all consented patients posted for surgical procedures requiring arterial cannulation for continuous blood pressure measurement
EXCLUSION CRITERIA:
1.Peripheral vascular disease 2.Haemorrhagic shock
3.Coagulation disorders 4.obesity(BMI>30Kg/m2)
5. negative modified Allen’s test
GROUPS GROUP L
Radial artery cannulation done by long axis ( in plane) approach
60
Radial artery cannulation done by modified short axis (out of plane) approach
RECRUITMENT:
Patients were recruited from the operation
procedure list. Randomization was done using a computer-generated table.
INFORMED CONSENT: In English and vernacular language( tamil)
PROPOSED DURATION OF THE STUDY: six months
DATA COLLECTION PROCEDURES:
After institutional Ethics Committee approval and informed written consent, 120 ASA I-IV patients were selected for the study based on the inclusion and exclusion criteria. Patients were randomized into two groups i.e. group L & group S using computerized random number.
On arrival of the patient in the operating room monitors like pulse oximeter, non- invasive BP and ECG were connected and baseline values (values taken just before the start of the procedure) recorded. An IV access was obtained in the arm using a 18G cannula.
61
of 2%ligncaine. The ultrasonic probe with disposable sterile covers of 18MHZ frequency was used to identify the radial artery.
MODIFIED SHORT AXIS OUT OF PLANE APPROACH:
62 Fig: 15 short axis out of plane approach
Fig;16 modified short axis out of plane approach
[image:62.612.91.400.398.631.2]63
LONG AXIS IN PLANE APPROACH:
After identifying the artery in the long axis view and measuring its inner diameter and the depth of artery from skin, the arterial cannula needle(18G) was inserted steeply downward at the midpoint of the short axis of the ultrasonic probe. Entry into the artery was confirmed by visualizing the backflow of blood into the needle. Then the angle of needle was lowered to 15 degrees and pushed proximally for 2 to 3mm.The needle core was then extracted and the cannula pushed into the radial artery and fixed to the skin.
64
Fig:17 long axis in plane approach
OBSERVATIONS:
DEPTH OF ARTERY FROM SKIN: The ultrasonic depth of the radial artery from skin was measured in cm.
CANNULATION TIME: The start of skin puncture to the display of arterial waveform on the monitor was measured in seconds
65
ATTEMPT: The Cannula withdrawn till skin and punctured at a different site was considered one attempt
REDIRECTION: The cannula directed at a different angle at the same puncture site was considered redirection
COMPLICATIONS:
VASOSPASM: when there was > 30% reduction in the inner diameter of the radial artery
HAEMATOMA: when a visible swelling appears over the puncture site
POSTERIOR WALL PUNCTURE: After the appearance of flash of blood in the chamber when continuous backflow was not present.
66
RESULTS AND ANALYSIS
DATA ANALYSIS:
The collected data were analysed with IBM.SPSS statistics software 23.0 Version. To describe about the data descriptive statistics frequency analysis, percentage analysis was used for categorical variables and the mean & S.D were used for continuous variables. To find the significant difference between the bivariate samples in the Independent groups the Unpaired sample t-test was used. To find the significance in categorical data Chi-Square t-test was used. In all the above statistical tools the probability value .05 is considered as significant level.
[image:66.612.70.436.452.656.2]THE GROUP DISTRIBUTION:
Fig:18
Group distribution
67
COMPARISON OF DEMOGRAPHIC PROFILE BETWEEN THE TWO
GROUPS:
AGE:
AGE GROUP L GROUP S
<50YEARS 47 40
>50 YEARS 11 22
P value is 0.206 (not significant)
Fig:19
0% 10% 20% 30% 40% 50% 60% 70% 80% 90% 100%
Group L Group S
Agerange
68
SEX:
SEX GROUP L GROUP S
MALE 21 22
FEMALE 37 40
P VALUE IS 0.934(NOT SIGNIFICANT)
Fig: 20
0% 20% 40% 60% 80% 100%
Group L Group S
Gender
69
THE OVERALL GENDER DISTRIBUTION BETWEEN THE TWO
GROUPS:
Fig: 21
COMPARISON OF BASELINE HEMODYNAMIC PARAMETERS BETWEEN THE TWO GROUPS:
PARAMETER GROUP L (mean)
GROUP S (mean)
P VALUE PULSE 78.86 79.56 0.657 SBP 124.14 125.16 0.502
DBP 78.62 79.84 0.297
PULSE RATE:
Gender distribution
70 Fig:22
NON- INVASIVE BLOOD PRESSURE:
Fig:23
70 72 74 76 78 80 82
Group L Group S
Pulse rate
120 121 122 123 124 125 126
Group L Group S
[image:70.612.182.430.431.610.2]71 Fig:24
Thus, the baseline parameters like pulse rate, the systolic and diastolic blood pressure are comparable between the two groups and there is no statistically significant difference. P value is >0.05.
70 72 74 76 78 80 82
Group L Group S
72
COMPARISON OF INNER DIAMETER OF RADIAL ARTERY:
PARAMETER GROUPS MEAN Std.DEVIATION P VALUE
INNER DIAMETER OF RADIAL ARTERY
GROUP L 2.6672 ±0.34 0.455 GROUP S 2.6642 ±0.28
Thus, there is no statistically significant difference between the two groups in terms of inner diameter of radial artery. P value is >0.05 Fig:25 2.00 2.10 2.20 2.30 2.40 2.50 2.60 2.70 2.80
Group L Group S
[image:72.612.187.443.345.550.2]73
COMPARISON OF DEPTH FROM SKIN TO THE RADIAL ARTERY:
PARAMETER MODIFIED SA-OOP
GROUPMean (SD)
LA-IP approach
Mean(SD)
P value Mean difference
Depth from skin to
radial artery (n cm)
0.6323±0.1696 0.6371±0.2157 0.893 0.00481
[image:73.612.72.590.418.642.2]
The results were not statistically significant for the difference of depth from skin to artery when comparing the modified SA-OOP and LA-IP groups. P value is 0.893.
Fig: 26 .600 .605 .610 .615 .620 .625 .630 .635 .640
Group L Group S
74
COMPARISON OF ULTRASONIC LOCATION TIME AND
CANNULATION TIME BETWEEN THE TWO TREATMENT GROUPS:
PARAMETER MODIFIED SA-OOP GROUP Mean ± SD
LA-IP group Mean ± SD
P VALUE
ULTRASONIC LOCATION TIME (SECONDS)
4.34 ± 0.809 8.41 ±1.109 0.000
CANNULATION TIME(SECONDS)
75
[image:75.612.107.548.232.497.2]The mean values of ultrasonic location time in the modified SA-OOP approach and LA-IP approach were 4.34s and 8.41s respectively. Thus there is a mean decrease of 4.075s. P value for ultrasonic location time is 0.000. Hence it is statistically significant.
Fig:27
0 1 2 3 4 5 6 7 8 9
Group L Group S
76
[image:76.612.144.507.298.515.2]The mean values of cannulation time in the SA-OOP approach and LA-IP approach is 10.06s and 14.59s respectively there is a mean difference of 4.522s. the P value for cannulation time is 0.000 which is statistically significant.
Fig:28
0 2 4 6 8 10 12 14 16
Group L Group S
77
COMPARISON OF NUMBER OF ATTEMPTS BETWEEN THE TWO
GROUPS:
NO OF
ATTEMPTS
Modified SA-OOP group
n (%)
La-IP GROUP n (%)
P value
1 95.2 87.9 0.294
2 4.2 10.3
3 0.0 1.7
[image:77.612.70.388.527.731.2]Compared to LA-IP approach the SA-OOP approach tends to have higher rate of attempt one and lower rate of attempt two. The P value is 0.294 which is >0.05 and hence it is statistically not significant.
Fig: 29 80% 85% 90% 95% 100%
Group L Group S
No ofattempts
78
COMPARISON OF NUMBER OF REDIRECTIONS IN BOTH THE
GROUPS:
Number of redirections
MODIFIED SA-OOP APPROACH n (%) LA-IP APPROACH n (%) P value
0 1.7 72.6 0.000
1 39.7 25.8
2 48.3 1.6
3 10.3 0
The number of redirections in modified SA-OOP approach is significantly lower when compared to LA-IP approach. The P value is 0.000 and hence it is statistically significant.
0% 20% 40% 60% 80% 100%
Group L Group S
No of redirections
79
COMPARISON OF COMPLICATIONS BETWEEN THE TWO GROUPS
VASOSPASM:
VASOSPASM MODIFIED SA-OOP GROUP n (%)
LA-IP GROUP n (%)
P value
PRESENT 0 3.4 0.232
ABSENT 100 96.6
[image:79.612.125.489.430.616.2]There is no statistically significant difference in the formation of vasospasm between the two groups. P value is 0.0232.
Fig:31
94% 96% 98% 100%
Group L Group S
Vasospasm
80
HAEMATOMA FORMATION:
HAEMATOMA MODIFIED SA-OOP
APPROACH n (%)
LA-IP APPROACH n (%)
P VALUE
PRESENT 3.2 5.2 0.672
ABSENT 96.8 94.8
There is no statistically significant difference between the two groups with respect to hematoma formation. P value is 0.672.
92% 93% 94% 95% 96% 97% 98% 99% 100%
Group L Group S
Hematoma
81
POSTERIOR WALL PUNCTURE:
POSTERIR WALL PUNCTURE MODIFIED SA-OOP APPROACH n (%) LA-IP APPROACH n (%) P value
PRESENT 8.1 0 0.058
ABSENT 91.9 100
[image:81.612.73.540.135.332.2]There is no statistically significant difference between the two groups with respect to posterior wall puncture. P value is 0.058.
Fig:33 0% 20% 40% 60% 80% 100%
Group L Group S
Posterior wall puncture
82
OVERALL PERCENT OF COMPLICATIONS USING ULTRASOUND
GUIDED RADDIAL ARTERY CANNULATION
VASASPASM:
[image:82.612.123.489.298.495.2]In this study, the total number of cases (including group L and group S) that presented with vasospasm were 1.7%
Fig:34
Vasospasm
83
HEMATOMA FORMATION:
[image:83.612.125.488.264.459.2]In this study the total number of cases (including group L and group S) that presented with hematoma formation were 4.2%
Fig:35
Hematoma
84
POSTERIOR WALL PUNCTURE:
In this study the presence of total number of cases (including group L and group S) that presented with posterior wall puncture were 4.2%
Fig:36
Posterior wall puncture
[image:84.612.123.490.234.424.2]85
DISCUSSION:
Arterial cannulation is the gold standard for continuous invasive blood pressure monitoring. Radial artery is the most commonly chosen site for this purpose. Ultrasound in this setting is commonly used to increase the success rate of needle placement and to reduce the complications. Ultrasound has become the ‘third eye’ of the clinicians. With the emergence of high resolution ultrasonic apparatus and improvement in ultrasonic probes the ultrasound guided procedures are on the rise.
As discussed earlier there are two basic needling approaches using ultrasound- the short axis out of plane approach and the long axis in plane approach both of which have their own merits and demerits.
Successfully cannulating the artery means accurately puncturing the blood vessel and advancement of the catheter into the artery. Several factors affect both these steps. if the diameter of the radial artery is small, puncturing accurately becomes difficult. when the artery is deeper, it might warrant multiple attempts. When the needle is placed only inside the part of the vessel or on the vessel wall catheter advancement results in failure.
86
palpatory methods. Though few, studies comparing the advantages and disadvantages of the different needling techniques were conducted.
In this study the demographic profile (age and sex) and the baseline vital parameters (pulse and blood pressure) before cannulation had no statistically significant difference.
The diameter of the radial artery and the depth of the artery from skin were also not statistically significant. These parameters can affect the ultrasonic location time and cannulation time.
Berk et all compared the LA IP and SA-OOP approach. They reported that the LA-IP approach resulted in increased first attempt success (76%) compared to SA-OOP approach (51%). In our study, the modified SA-OOP approach was compared with the LA-IP approach. the first attempt success was 95.2% for modified SA-OOP approach compared to 87.9% for the LA-IP approach. Thus, the modified SA-OOP approach reduces the number of subjects requiring two or more attempts.
87
Kyung song et ell conducted a study that compared short axis and long axis approach in children. The imaging time in long axis group was significantly longer because the transducer was rotated, from the short axis to the long axis view to capture the whole artery. Zhe feng quan et all concluded that the modified short axis OOP approach significantly decreases the mean ultrasonic location time. In our study, Ultrasonic location time was lesser with the SA-OOP group when compared with the LA-IP group. The results were statistically significant. When performing an ultrasound guided radial artery cannulation, the artery is placed in the center of the screen. Technically, the modified SA-OOP approach has an advantage over the LA-IP approach in finding the artery more easily. This is by ascertaining the location of the artery using the developing line on the screen.
88
approach, the modified SA-OOP approach has higher rate of success in attempt one. The number of redirections is also significantly lower in the modified SA-OOP group. Thus the decrease in ultrasonic location time and cannulation time are direct results of the modification made to the SA-OOP approach. Due to the thickness of the ultrasound beam when the needle travels outside the vessels while still in section range of ultrasound probe overlapping images appear giving a illusion that the needle is inside the vessel in LA-IP approach, thus increasing the number of redirections and attempts.
As with the successful arterial cannulation preventing complications is also equally important. Studies by moon et all showed a 34% incidence of posterior wall puncture in both LA-IP and SA-OOP groups. In our study though there was no statistically significant difference between the two groups, the incidence of posterior wall puncture is slightly higher in the modified S-OOP group. In the LA-IP approach the overall path of the needle and its tip is clearly seen and hence penetration of the posterior wall is prevented.
89
Other complications like hematoma formation and vasospasm were not statistically significant between the two groups.
Thus with this modification to the SA-OOP approach, puncturing of artery is done with greater accuracy. This reduces multiple attempts and redirections, increases the first attempt success rate and reduces the rate of complications.
90 LIMITATIONS
This is a single study and so the sample size was kept small (120 patients). Probably a multicenter study with a greater sample size can better establish the superiority or inferiority of one method over another.
The learning curve for the techniques like ultrasound sound guided procedures is slow. The cannulations were done by anaesthesiologists with less experience.
Morbidly obese or patients with acute hemodynamic disturbances were excluded from this study. If those cases were included, the effectiveness of the USG could have been more widely evaluated.
91
CONCLUSION
In our prospective randomized comparative study of USG guided radial artery cannulation by long axis and modified short axis technique, we conclude that the decrease in ultrasonic location time and cannulation time for the modified SA-OOP technique are the direct results of the modifications. The incidence of success in the first attempt was higher in the modified SA-OOP approach with decrease in the incidence of complications compared to the LA-IP approach.
92
93
BIBLIOGRAPHY
1) Remington JW. Contour changes of the aortic pulse during propagation. Am J Physiol 1960; 199:331.
2) Allen EV (1929) Thrombo-angiiis obliterans. Methods of diagnosis or chronic occlusive arterial lesions distal to the wrist, with illustrative cases. Am J Med Sciences 178:237-44.
3) Wright IS (1952) Vascular diseases in clinical practice. 2nd ed. Chicago: The Year Book Publishers Inc. 14. Johnson D, Ellis H (2005) Pectoral girdle and upper limb. In: Standring S, ed. Gray’s
4) Johnson D, Ellis H (2005) Pectoral girdle and upper limb. In: Standring S, ed. Gray’s anatomy. 799–942 New York: Elsevier Churchill Livingstone.
5) 16. De Garis CF, Swartley WB (1928) The axillary artery in white and negro stocks. Am J Anat 41:353-397.
6) Johnson D, Ellis H (2005) Pectoral girdle and upper limb. In: Standring S, ed. Gray’s anatomy. 799–942 New York: Elsevier Churchill Livingstone
94
8) Milzman D, Janchar T (2004) Arterial Puncture and Cannulation. In: Roberts J, Hedges J. Clinical Procedures in Emergency Medicine. 4th ed. Philadelphia: W.B. Saunders 384-399. 35.
9)Mitchell JD, Welsby IJ (2004) Techniques of arterial access. Surgery 22:3-4. 10) Rijnders BJ, Van Wijngaerden E, Wilmer A, et al. Use of full sterile barrier precautions
during insertion of arterial catheters: A randomized trial. Clin Infect Dis 2003; 36:743.
11)Sherertz RJ. Update on vascular catheter infections. Curr Opin Infect Dis 2004; 17:303.
12) O'Grady NP, Alexander M, Dellinger EP, et al. Guidelines for the prevention of intravascular catheter related infections. Centers for Disease Control and Prevention, MMWR Recomm Rep 51(RR-10), 2002:1.
13) Goldstein RD, Gordon MJV. Volar proximal skin necrosis after radial artery cannulation. N Y State J Med 1990; 90:375.
14) Wyatt R, Glaves I, Cooper DJ. Proximal skin necrosis after radial artery cannulation. Lancet 1974; 1:1135.
95
16) Chang C, Dughi J, Shitabata P, et al. Air embolism and the radial arterial line. Crit Care Med 1988; 16:141.
17) Weiss M, Balmer C, Cornelius A, et al. Arterial fast bolus flush systems used routinely in neonates and infants cause retrograde embolization of flush solution into the central
arterial and cerebral circulation. Can J Anaesth 2003; 50:386–391.
18) Murphy GS, Szokol JW, Marymont JH, et al. Retrograde blood flow in the brachial and axillary arteries during routine radial arterial catheter flushing. Anesthesiology 2006;
105:492–497.
19) Zavela NG, Gravlee GP, Bewckart DH, et al. Unusual cause of hypotension after cardiopulmonary bypass. J Cardiothorac Vasc Anesth 1996; 10:553.
20) Qvist J, Peterfreund R, Perlmutter G. Transient compartment syndrome of the forearm after attempted radial artery cannulation. Anesth Analg 1996; 83:183. 21)WHO guidelines on drawing blood: best practice in phlebotomy
Geneva: world health organization; 2010
22)xiang dong wu, wan-jie gu, fei wang. Ultrasound guidance facilitates radial artery cannulation. Original research, pulmonary procedures,2016
96
24) Shiver S, Blaivas M, Lyon M. A prospective comparison of ultrasound-guided and blindly placed radial arterial catheters. Acad Emerg Med 2006; 13:1275–1279 25) Schwemmer U, Arzet HA, Trautner H, et al. Ultrasound-guided arterial
cannulation in infants improves success rate. Eur J Anaesthesiol 2006; 23:476– 480.
26) Ganesh A, Kaye R, Cahill AM, et al. Evaluation of ultrasound-guided radial artery cannulation in children. Pediatr Crit Care Med 2009; 10:45–48
27) Dudeck O, Teichgraeber U, Podrabsky P, Haenninen EL, Soerensen R, Ricke J. A randomized trial assessing the value of ultrasound-guided puncture of the femoral artery for interventional investigations. Int J Cardiovasc Imaging 2004; 20:363–368
28)xiuyan li, Guizhen Fang ultrasonic technology improves radial artery puncture and cannulation in intensive care unit shock patients med sci monitor, 2016; 22:2409-2416
29) Amna, saira Mehboob, comparison of ultrasound guided radial artery
cannulation with conventional palpation technique.EC anaesthesia 2.2(2015):85-89 30) Nagabhushan S, Colella JJ, Wagner R. Use of Doppler ultrasound in
performing percutaneous cannulation of the radial artery. Crit Care Med 1976; 4:327.
97
32) White ENR, Mitchell MM, Prakash O. Measurement of arterial pressure after cardiopulmonary bypass with a long radial artery catheter. J Cardiothorac Anesth 1990; 4:19.
33) derya berk, yavuz gurkan. Usg guided radial artery cannulation: long axis versus short axis approaches. J clin monit comput (2013) 27:319-324
34) Ganesh A, Kaye R, Cahill AM, et al. Evaluation of ultrasound-guided radial artery cannulation in children. Pediatr Crit Care Med 2009; 10:45–48.
26)McLeskey CH, Mims GR. Doppler-assisted radial artery cannulation. Anesthesiology 1982; 57:A25.
28) Sandhu NS. The use of ultrasound for axillary catheterization through pectoral muscles: a new anterior approach. Anesth Analg 2004; 99:562–565. 29)Sandhu NS. Use of ultrasonography as a rescue technique for failed radial artery
cannulation. J Clin Anesth 2006; 18:138–141.
30) Triffterer L, Marhofer P, Willschke H, et al. Ultrasound-guided cannulation of the great saphenous vein at the ankle in infants. Br J Anaesth 2012; 108: 290–4. 31) Pirotte T, Veyckemans F. Ultrasound-guided subclavian vein cannulation in infants and children: a novel approach. Br J Anaesth 2007; 98: 509–14.