promoting access to White Rose research papers
White Rose Research Online
Universities of Leeds, Sheffield and York
http://eprints.whiterose.ac.uk/
This is an author produced version of a paper published in Superlattices and Microstructures
White Rose Research Online URL for this paper: http://eprints.whiterose.ac.uk/3377/
Published paper
Ceccarelli, S., Wenus, J., Skolnick, M.S. and Lidzey, D.G. (2007) Temperature dependent polariton emission from strongly coupled organic semiconductor
Temperature dependent polariton emission from strongly coupled
organic semiconductor microcavities
Samira Ceccarelli, Jakub Wenus, Maurice S. Skolnick and David G. Lidzey*
Department of Physics and Astronomy, The University of Sheffield, Hicks Building,
Hounsfield Road, Sheffield S3 7RH, United Kingdom
*Author for correspondence: e-mail [email protected], Phone: +44 (0) 114 222 3501, Fax: +44 (0) 114
222 3555
Abstract. We investigated the absorption and photoluminescence (PL) of J-aggregates of a cyanine dye both in a thin film format and when used as the active layer in a strong-coupled microcavity. We show that as temperature is reduced, the absorption linewidth of the J-aggregates narrows and shifts to higher energy. When the J-aggregate is placed in a microcavity we find that the energy of the polariton modes also shifts to higher energies as temperature is reduced. We compare the intensity of PL emission from the upper and lower branches at resonance as a function of temperature, and find that it can be described by an activation energy of 25 meV. PL emission spectra at resonance also suggest that uncoupled excitons inside the microcavity populate the upper polariton branch states.
Keywords: Strong coupling, exciton, organic microcavities, J-aggregates, absorbance, photoluminescence, reflectivity, temperature dependence.
Introduction. Strong-coupling can be achieved at room temperature in microcavities
containing organic semiconductors due to the enhanced binding energy of Frenkel
excitons. Apart from one recent study [1], most work on this topic has been restricted to
room-temperature measurements [2, 3]. In this paper, we characterize the
photoluminescence emission (PL) from microcavities containing J-aggregates of a
cyanine dye at temperatures between 80 K and 300 K and show evidence of the
population of the upper polariton branch from uncoupled excitons.
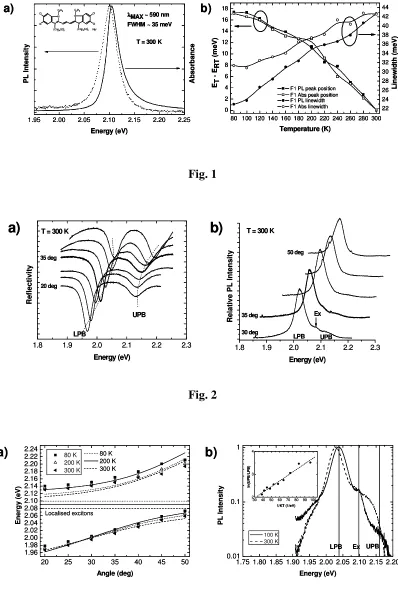
Experimental methods. In the top left corner of Fig. 1a we show the chemical structure
of the cyanine dye F1 used in the experiment. This material has been characterised in
thin-film format [4] and when incorporated into a microcavity [5, 6]. For control optical
measurements, the dye was dissolved in a water-based gelatine solution and spin-coated
on a glass substrate. To fabricate microcavities, the F1 dye/gelatine solution was
spin-cast onto a DBR (consisting of 9 pairs of SiN/SiO2) grown by plasma enhanced
chemical vapour deposition (PECVD) on a quartz substrate. A top silver mirror was
structures having a Q-factor of 70. Samples were mounted in a nitrogen-cryostat and
characterized between 80 K and 300 K. PL was generated from each structure using
either a GaN laser emitting at 405 nm with a power of 2.5 mW or a He-Cd laser
emitting at 442 nm.
Results and discussion. Fig. 1a shows the absorbance and PL of J-aggregates of dye F1
measured at 300 K. The J-aggregates absorb and emit at around 590 nm (2.1 eV). Both
absorbance and PL spectra have linewidth of around 35 meV with a Stokes shift of 4
meV between absorption and emission. As the ambient temperature is reduced to 80 K,
the absorbance and PL both shift to higher energies as shown in Fig. 1b. This
energy-shift is accompanied by a narrowing of the absorption and emission linewidth.
Figure 2a shows the results of angle-resolved reflectivity measurements on
microcavities containing dye F1. Here, reflectivity spectra were recorded at 300 K for
various external-viewing angles between 25º and 50º. It can be seen that the cavity
undergoes anti-crossing around the peak J-aggregate absorption energy, demonstrating
that it operates in the strong-coupling regime. Exciton-photon resonance occurs at 35º
(where polariton branches have a minimum energy separation) and corresponds to a
Rabi-splitting energy of 130 meV. Angle resolved PL spectra recorded at 300 K are
shown in Fig. 2b. The spectrum recorded at resonance is marked in bold. Here, we
identify emission from both the upper polariton branch (UPB) and the lower polariton
branch (LPB). We also highlight the emission from uncoupled excitons (Ex).
In Fig. 3a we show the dispersion curves obtained from angle resolved
reflectivity measurements at 80 K, 200 K and 300 K. In the same figure we plot
dispersion curves calculated on the basis of a two-level model. It can be seen that at all
temperatures, anticrossing is observed between the UPB and LPB. We note that the
Rabi-splitting energy does not change appreciably indicating that the J-aggregate
be seen however that the dispersion curves shift to higher energy as the temperature is
reduced. This energy shift is consistent with the temperature-dependent shift of the F1
aggregates: in particular, we observe the same 20 meV energy shift between 80 K and
300 K in the dispersion curves as is observed in the control films of F1 J-aggregates
(see Fig. 1b).
In Fig. 3b we plot the emission from the cavity at resonance at 100 K and 300 K,
with both spectra normalized to the intensity of the LPB. Emission from uncoupled
excitons at 100 K can be clearly seen. The energy of the UPB and LPB approximately
coincide with that measured in reflectivity (to within 20 meV). It can be seen that the
UPB intensity reduces as temperature is reduced. In the figure inset, we make an
Arrehnius plot of the ratio of upper to lower branch emission intensity against 1/KT.
The data follow a straight line, having a gradient (equivalent to an activation energy) of
25 meV. This energy is close to the peak energy separation between the UPB and the
uncoupled exciton energy, which are separated by 35 meV. Note that this agreement is
further improved when we take into account that the uncoupled exciton and UPB have a
linewidth (at 300 K) of 42 and 33 meV respectively. This suggests that the UPB is in
part populated through scattering from uncoupled exciton states.
Conclusions We have measured the absorption and PL of J-aggregate excitons as a
function of temperature both in control thin films and in a strong-coupled microcavity.
We find that both the uncoupled excitons and the polariton modes show the same
energy shift as the temperature is varied between 80 K and 300 K. The PL emission
intensity from the upper and lower polariton branches recorded at resonance suggests
that upper branch states are populated by uncoupled excitons.
[1] P. Schouwink, J. M. Lupton, H. von Berlepsch, L. Dahne, R.F. Mahrt, Phys. Rev. B
66 (8) (2002).
[2] D. G. Lidzey, D. D. C. Bradley, T. Virgili, A. Armitage, M. S. Skolnick, S. Walker,
Phys. Rev. Lett. 82 (16) (1999) 3316-3319.
[3] D. G. Lidzey, A. M. Fox, M. D. Rahn, and M. S. Skolnick, V. M. Agranovich, S.
Walker, Phys. Rev. B 65 (19).
[4] H. von Berlepsch, T.C. Böttcher, A. Ouart, C. Burger, S. Dähne, and S. Kirstein, J.
Phys. Chem. B 104 (2000) 5255−5262.
[5] J. Wenus, L.G. Connolly, D.G. Lidzey, Phys. Stat. Sol. (c) 2 (2005) 3899−3902.
Figures captions.
Figure 1. a) Absorbance (solid line) and PL (dashed line) at 300 K of J-aggregates of
cyanine dye F1 dispersed in gelatine matrix in a thin film spin-coated on a glass
substrate. Top left corner: Chemical structure of dye F1. b) Energy shift of peak energy
ET at temperature T relative to peak energy ERT at 300 K (left axis) and spectra
linewidth (right axis) as a function of temperature for absorbance (open symbols) and
PL emission (solid symbols).
Figure 2. a) Angle resolved reflectivity spectra at 300 K for microcavity containing
J-aggregates of dye F1: the spectrum at resonance (i.e. 35º) has been marked with a
thicker line. Dashed lines show the anticrossing behaviour of the polariton modes. b)
Angle resolved PL spectra at 300 K: resonance spectrum at 35º is marked in bold.
Figure 3. a) Dispersion curves from angle resolved reflectivity measurements at
temperature: 80 K, 200 K, 300 K. Symbols refer to experimental data, lines (dispersion
curves and localised excitons) to theoretical two-level model results. b) PL spectra at
35º (resonance) at 100 K and 300 K: LPB, exciton and UPB energy for 100 K are
marked. Inset: Arrhenius plot of ratio of upper to lower polariton branch emission
intensity as a function of 1/KT: symbols refer to experimental data and dashed line is
the best linear fit.
Fig. 1
[image:7.595.95.493.83.694.2]Fig. 2
Fig. 3
1.8 1.9 2.0 2.1 2.2 2.3
UPB 30 deg R e la ti v e P L I n te n s it y Energy (eV) 35 deg 50 deg
T = 300 K
LPB Ex
1.8 1.9 2.0 2.1 2.2 2.3
UPB R e fl e c ti v it y Energy (eV) 20 deg 35 deg
T = 300 K
LPB
a)
b)
1.8 1.9 2.0 2.1 2.2 2.3
UPB 30 deg R e la ti v e P L I n te n s it y Energy (eV) 35 deg 50 deg
T = 300 K
LPB Ex
1.8 1.9 2.0 2.1 2.2 2.3
UPB R e fl e c ti v it y Energy (eV) 20 deg 35 deg
T = 300 K
LPB
a)
b)
20 25 30 35 40 45 50
1.96 1.98 2.00 2.02 2.04 2.06 2.08 2.10 2.12 2.14 2.16 2.18 2.20 2.22 2.24 80 K 200 K 300 K E n e rg y ( e V ) Angle (deg) 80 K 200 K 300 K Localised excitons
30 40 50 60 70 80 90 100 2 3 4 ln (U P B /L P B ) 1/KT (1/eV)
a)
b)
1.75 1.80 1.85 1.90 1.95 2.00 2.05 2.10 2.15 2.20 0.01 0.1 1 UPB 100 K 300 K P L I n te n s it y Energy (eV) LPB Ex
20 25 30 35 40 45 50
1.96 1.98 2.00 2.02 2.04 2.06 2.08 2.10 2.12 2.14 2.16 2.18 2.20 2.22 2.24 80 K 200 K 300 K E n e rg y ( e V ) Angle (deg) 80 K 200 K 300 K Localised excitons
30 40 50 60 70 80 90 100 2 3 4 ln (U P B /L P B ) 1/KT (1/eV)
a)
b)
1.75 1.80 1.85 1.90 1.95 2.00 2.05 2.10 2.15 2.20 0.01 0.1 1 UPB 100 K 300 K P L I n te n s it y Energy (eV) LPB Ex
1.95 2.00 2.05 2.10 2.15 2.20 2.25
T = 300 K
λ λ λ λ
MAX ~ 590 nm FWHM ~ 35 meV
P L I n te n s it y Energy (eV) A b s o rb a n c e 22 24 26 28 30 32 34 36 38 40 42 44
80 100 120 140 160 180 200 220 240 260 280 300 0 2 4 6 8 10 12 14 16 18
F1 PL peak position F1 Abs peak position
ET ER T ( m e V ) Temperature (K) F1 PL linewidth F1 Abs linewidth
L in e w id th ( m e V ) a) b) N N+ Cl Cl C2H5 N N Cl Cl C2H5
(C H2)4SO3- (C H2)4SO3- Na+
1.95 2.00 2.05 2.10 2.15 2.20 2.25
T = 300 K
λ λ λ λ
MAX ~ 590 nm FWHM ~ 35 meV
P L I n te n s it y Energy (eV) A b s o rb a n c e 22 24 26 28 30 32 34 36 38 40 42 44
80 100 120 140 160 180 200 220 240 260 280 300 0 2 4 6 8 10 12 14 16 18
F1 PL peak position F1 Abs peak position
ET ER T ( m e V ) Temperature (K) F1 PL linewidth F1 Abs linewidth
L in e w id th ( m e V ) a) b)
1.95 2.00 2.05 2.10 2.15 2.20 2.25
T = 300 K
λ λ λ λ
MAX ~ 590 nm FWHM ~ 35 meV
P L I n te n s it y Energy (eV) A b s o rb a n c e 22 24 26 28 30 32 34 36 38 40 42 44
80 100 120 140 160 180 200 220 240 260 280 300 0 2 4 6 8 10 12 14 16 18
F1 PL peak position F1 Abs peak position
ET ER T ( m e V ) Temperature (K) F1 PL linewidth F1 Abs linewidth
L in e w id th ( m e V ) a) b) N N+ Cl Cl C2H5 N N Cl Cl C2H5