White Rose Research Online URL for this paper: http://eprints.whiterose.ac.uk/94793/
Version: Accepted Version
Article:
Dwyer-Joyce, R.S., Sayles, R.S. and Ioannides, E. (1994) An investigation into the mechanisms of closed three-body abrasive wear. Wear, 175 (1-2). pp. 133-142. ISSN 0043-1648
https://doi.org/10.1016/0043-1648(94)90176-7
Article available under the terms of the CC-BY-NC-ND licence (https://creativecommons.org/licenses/by-nc-nd/4.0/)
eprints@whiterose.ac.uk https://eprints.whiterose.ac.uk/
Reuse
Unless indicated otherwise, fulltext items are protected by copyright with all rights reserved. The copyright exception in section 29 of the Copyright, Designs and Patents Act 1988 allows the making of a single copy solely for the purpose of non-commercial research or private study within the limits of fair dealing. The publisher or other rights-holder may allow further reproduction and re-use of this version - refer to the White Rose Research Online record for this item. Where records identify the publisher as the copyright holder, users can verify any specific terms of use on the publisher’s website.
Takedown
If you consider content in White Rose Research Online to be in breach of UK law, please notify us by
An Investigation into the Mechanisms of
Closed Three Body Abrasive Wear
R.S. Dwyer-Joyce, R.S. Sayles, & E. Ioannides
Tribology Section, Imperial College, Exhibition Road, London SW7
2BX.
Contacting components frequently fail by abrasion caused by solid contaminants in the lubricant. This process can be classified as closed three body abrasive wear process. The mechanisms by which trapped particles cause material removal are not fully understood. This paper describes tests using model elastohydrodynamic contacts to study these mechanisms.
An optical ehl rig has been used to study the deformation and fracture of ductile and brittle lubricant borne debris. A ball on disk machine was used to study the behaviour of the particles in partially sliding contacts. Small sized diamond particles were used as abrasives since these were thought not to breakdown in the contact; wear could then be directly related to particles of a known size.
The particles were found to embed in the softer surface and scratch the harder. The mass of material worn from the ball surface was approximately proportional to the particle sliding distance and abrasive concentration. Small size particles tumbled through the contact; whilst larger particles ploughed. Mass loss was found to increase with abrasive particle size. Individual abrasion scratches have been measured and related to the abrading particle.
A simple model of the abrasive process has been developed and compared with experimental data. The discrepancies are thought to be the result of the uncertainty about the entrainment of particles into the contact.
1. Introduction
Abrasive wear can be classified into two-body and three-body categories [1]. Two-body
wear occurs when a pair of opposing surfaces interact abrasively, such as in grinding,
tool cutting, or when a rough surface abrades a smoother surface by asperity cutting.
This process has been studied extensively by experimenters using model cutting tools
[2] or abrasive papers [3,4]. Models have been developed using slip line field solutions
to determine material flow around sliders [5,6]; these can, however, only model plastic
flow for a 2D indentor.
Three-body abrasive wear occurs when particles (known as third bodies) are interposed
between the two surfaces. This can be further divided into open and closed variants.
Open three-body wear occurs when the two surfaces are far apart or when only one
surface is involved in the wear process; this type of wear occurs for example in earth
moving equipment where soil particles abrade the shovel faces. Closed three-body wear
occurs when the abrading particles are trapped between two surfaces which are close to
each other. The particles may imbed in one of the surfaces and cause wear on the
opposing surface. Experimenters have largely concentrated on the open variation
studying, the wear of two lightly loaded annular rings fed with abrasive [7]; or the wear
of a rotating disk loaded with a column of abrasive [8].
A common cause of failure of lubricated contacting components, such as gears or rolling
bearings, is through wear caused by lubricant borne debris. The solid particles become
entrained into the contacts, spanning the protective oil film, and damaging one or both of
the elements. In some cases these surface dents will be large enough to initiate rolling
contact fatigue [9]. Continual material removal by many smaller debris damage actions
will lead to loss of tolerance and excessive vibration. The process whereby a particle
becomes trapped between two surfaces, and removes material from one or both, can be
classified as closed three body abrasive wear.
The experiments described in this paper were prompted by a desire to understand how
these entrained particles lead to material removal, and to develop a clearer understanding
of the closed three body abrasive wear process. Two test devices were used, both model
contacts operating in the elastohydrodynamic lubrication (ehl) regime. The first, an
optical ehl rig, was used to study the deformation and breakdown of solid particles in the
entry to a rolling contact. The second, a simple ball on disk machine, was used to
2. Particle Deformation or Breakdown in Concentrated Contacts
Replacing one element of a contacting pair with glass provides a useful way of studying
the behaviour of entrained particles. An optical ehl rig was used to visualise ductile and
ceramic particles entering a rolling contact . Figure 1 is a schematic diagram of the
apparatus. Lubricant mixed with solid particles was fed onto the rotating disk and
became entrained into the contact. Light supplied to the contact divides at the
semi-reflective layer. Part is reflected at the layer whilst the rest is reflected at the ball surface.
These two rays re-combine to form an interference pattern. This is viewed through the
microscope tube. A short duration flash camera or high speed video camera can be used
to capture images of particles entering the contact . Full details of this method and more
[image:4.612.154.470.300.515.2]comprehensive results can be found in [10,11].
Figure 1. Schematic diagram of the optical elastohydrodynamic apparatus.
Ductile particles were flattened in the inlet region and the deformed platelets entered the
contact. Brittle particles fractured in the inlet and the fragments entered the contact.
Tougher ceramics tended to fracture later in the entry region leaving larger fragments.
Small size ceramic particles (like 5 µm silicon carbide or 6 µm diamond) did not
fracture and were entrained into the contact. As ceramic particles are reduced in size the
number and size of the surface flaws reduces; smaller particles therefore tend to be
stronger. An ultimate size exists such that the particle will not fracture but pass through
the contact largely undamaged [10]. Figures 2 and 3 show short duration flash
photographs of lubricant debris particles in the contact. The pictures show a pattern of
white light source
belt driven by geared motor at stable speed
glass disk
ball bearing support
microscope tube
1" steel ball
spring loading onto disk
coloured fringes which reveal the separation of the rolling elements by the lubricant
film. Debris has been introduced into this lubricant. Figure 2 shows flattened copper
particles in the contact (four are visible in the photograph). Figure 3 shows silicon
carbide particles (appearing as countless black specks) in the contact and entry region.
Figure 2. Short duration flash photograph of originally 35 µm copper spheres in a rolling
contact. Entry direction left to right.
Figure 3. Short duration flash photograph of 5 µm silicon carbide particles in a rolling
contact. Entry direction left to right.
These experiments provide useful information on how particles behave in the region of a
rolling contact, but give little details about the wear process likely to be occurring once
the deformed or fractured particle enters the contact. A ball on disk apparatus was used
to study this aspect.
3. Particle Behaviour in a Rolling/Sliding Contact.
The second set of tests were performed using a ball on disk machine. A schematic of the
apparatus is shown in Figure 4. The disk is mounted on a shaft held by ball bearings in a
pivoting housing. The ball is located on a second shaft held in a fixed housing. The ball
is supported by three small roller bearings whilst the drive from the shaft is transmitted
through a tongue and groove coupling. Dead weights were applied to the loading arm
causing the disk, mounted in the pivoting housing, to be loaded onto the ball. The shafts
Figure 4. Schematic elevation view of the ball on disk apparatus.
The test specimens were components from standard rolling element bearings; a 1" ball
(hardness 840 HV) and the inner raceway from a cylindrical roller bearing (hardness
760 HV). Small size diamond particles (deBeers grade MDA) were chosen as test
abrasives. The size ranges used were 0-0.5 µm, 0.5-1.0 µm, 1.0-2.0 µm, 2.0-4.0 µm, and
3.0-6.0 µm. From the optical ehl experiments it was thought that these particles would
not suffer fracture in the contact. Wear and surface scratches could therefore be directly
related to a particle of known size and shape.
The abrasive powders were thoroughly mixed with the test lubricant (Turbo T68, a pure
mineral stock with no EP additives) and fed directly into the ball and disk constriction.
Typically the specimens were run for 10 minutes, at various slide roll ratios, to give
18,000 revolutions of the ball. The load was chosen to give a peak contact pressure of
2 GPa. The surfaces of the ball and disk were examined using an optical microscope and
a surface profilometer. The quantity of material lost from the ball surface was estimated
from the geometry of the wear scar. Several tests at low debris concentrations were
carried out to generate a few easily discernible wear scratches; surface profiles of
individual scratches were recorded.
3.1. The Effect of Slide Roll Ratio
Investigation of the rolling element surfaces showed pits on the disk surface whilst the
balls were scratched. This behaviour was independent of the magnitude or direction of pulleys connected to
motors pivot point
fixed housing housingpivoting
ball support assembly
the slide roll ratio1. The particles appear to be held in the softer surfaces whilst
scratching the harder. Neither element showed evidence of abrasive particles remaining
embedded in the surface after the tests.
This mechanism whereby abrasive particles are locked in one surface whilst they abrade
another has been observed by other experimenters. Possibly, the first of whom being
Leonardo Da Vinci. He describes, in the Codex Madrid [12], metal water wheel axles
being worn by wear chips embedded in the wooden supporting bush. In more recent
times, Ronen and Malkin [13] and Broeder and Heijnekamp [14] experimented on the
wear of journal bearings by lubricant contaminated with abrasive particles. Both
investigators found that increasing the relative shaft hardness tended to increase shaft
wear. Williams & Hyncica [15] noted the same effect using a foil bearing apparatus.
They developed a model of an idealised abrasive grit trapped between two surfaces.
They showed how particles could tumble through a contact (this is discussed later) and
how particles could embed in the soft surface and wear the harder counterface.
Increasing the slide roll ratio caused the length of the grooves on the balls to increase
(the disk was only dented in all cases). Figure 5 shows photomicrographs of the ball
wear tracks for five different slide roll ratios using 4-6µm diamond abrasive.
Figure 5. Photographs of the wear tracks from ball tested with diamond abrasives at
various slide roll ratios (a) 0%, (b) -10%, (c) -25%, and (d) -40%.
The length of the grooves (in the direction of motion) corresponded approximately with
the distance a single particle would slide in the contact (determined from the slide roll
ratio and the contact width in the direction of motion).
Figure 6 shows a surface profile of a typical wear track transverse to the rolling
direction. The width of the track (perpendicular to the direction of motion) is close to the
width of the contact patch. The mass of material removed from the ball surface was
estimated from these surface profiles.
1 Defined here as 2(u
b-ud)/(ub+ud) where ub and ud are the ball and disk surface speeds
Figure 6. Surface profile of a typical wear track on a ball surface. Recorded in the
[image:8.612.119.498.397.633.2]transverse direction.
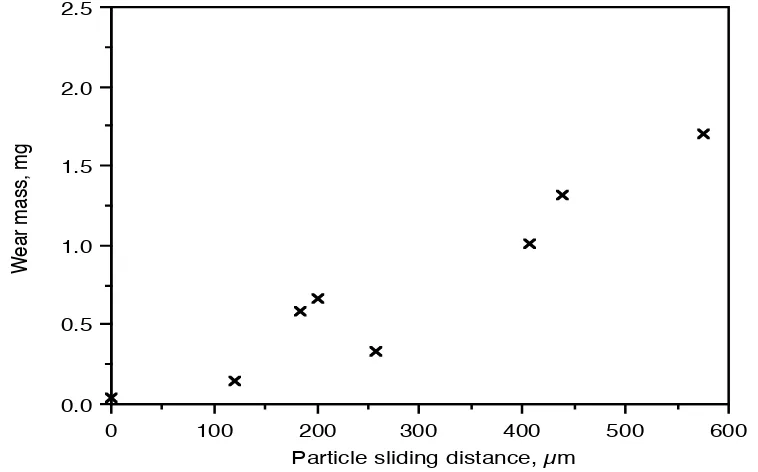
Figure 7 shows the variation in abrasive mass loss plotted against the particle sliding
distance. It is suggested that the scatter is largely caused by the difficulty in maintaining
a constant concentration of abrasive powder in the lubricant. The particles readily drop
out of suspension; continual and thorough mixing is required.
Figure 7. Plot of mass loss from the ball surface against sliding distance (determined
from the slide roll ratio and contact width). Test conditions 50 mg/l diamond abrasive
2-4 µm, ball speed 30 rps.
3 µm
1 mm
600 500
400 300
200 100
0 0.0 0.5 1.0 1.5 2.0 2.5
Particle sliding distance, µm
W
ea
r
ma
ss,
Within the scatter2 the mass loss appears to be approximately linear with sliding
distance. The particles are held in one surface and generate a groove in the opposing
counterface; material is removed from this ploughed groove. This data suggests the
quantity of material removed from this groove is proportional to the groove length. This
feature is in common with the two body asperity ploughing and cutting tool type wear
modes. It can also be inferred that the increase in slide roll ratio does not affect the
entrainment of these particles into the contact. Wan and Spikes [16] showed that large
size (up to 30 µm) particles could be rejected from partially sliding contacts; this effect
does not appear to have occurred with these smaller particles.
3.2. The Effect of Particle Concentration
Increasing the concentration of debris particles has little effect on the separation of the
rolling elements. Individual particles are small, and the load to fully embed them into the
contacting surfaces is a small fraction of the total load applied to the elements. Thus, any
particle entrained becomes immediately embedded. Even at relatively high
concentrations the particles cannot support enough load to separate the rolling elements.
Reference [17] describes an experiment where the optical ehl apparatus was used to
verify this; 5 µm silicon carbide concentrations were increased to 50 wt% without the
elements being separated and the lubricant film becoming lost. This has important
implications when one considers the wear process. Most wear mechanisms are load controlled, such that increasing the load causes the abrasive or indentor to penetrate further into its counterface resulting in more material removal. The closed three body
wear mechanism is essentially geometry controlled, increasing the load does not cause particles to embed deeper, but causes an increase in contact area and therefore more
particles to be entrained.
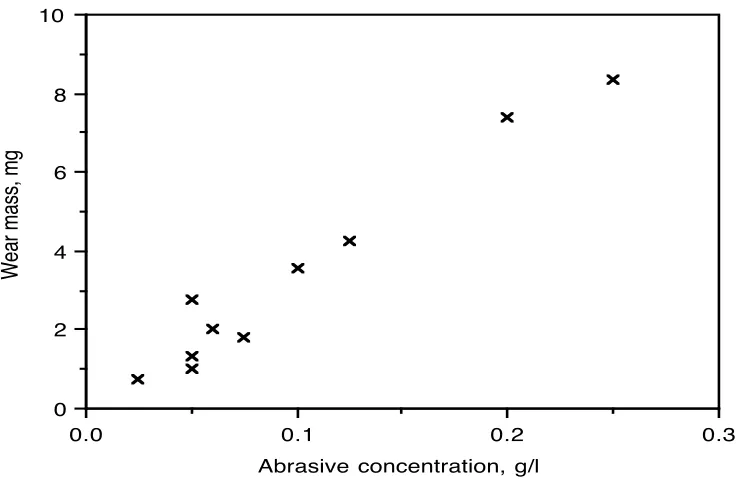
Figure 8 shows the results of a series of tests on the effect of abrasive concentration on
wear. The load, abrasive, and slide roll ratio were kept constant. Again the mass lost
from the ball was determined from the geometry of the wear scar.
2 The repeatability of the results was examined by carrying out five tests under the same
Figure 8. Plot of mass loss from the ball surface against abrasive concentration. Test
conditions -30% slide roll ratio, 2-4 µm diamond abrasive, ball speed 30 rps.
Within the scatter in the data, the mass loss appears to be proportional to the abrasive
concentration. Thus, an increase in the concentration does not alter the wear mechanism;
each particle appears to be acting independently. This is not surprising when one
estimates the number of particles likely to be present in the contact at any one time. The
volume of oil in the contact, in these experiments, is typically 1.3x10⁻⁴ mm3. Even at the
highest concentration used in these tests this volume would contain less than one
abrasive particle. Thus, if one can quantify the material removal by a single particle, and
determine how many particles enter the contact, it should be possible to predict the total
mass loss.
3.3. The Effect of Particle Size
Some experiments were performed using a range of particle sizes under the same contact
and lubrication conditions, with a slide roll ratio of -30%. The photographs included as
Figure 9 show the wear tracks on the ball surface.
Figure 9. Photographs of the wear tracks from ball tested with diamond abrasives of
various size at a slide roll ratio of -30% (a) 0-0.5 µm, (b) 0.5-1.0 µm, (c) 1.0-2.0 µm, (d)
2.0-4.0 µm, and (e) 3.0-6.0 µm.
0.3 0.2
0.1 0.0
0 2 4 6 8 10
Abrasive concentration, g/l
W
ea
r
ma
ss,
The smallest sized particles did little damage to the surface. The central lubricant film
thickness is calculated (using the Dowson and Higginson equation) as 0.44 µm. The few
scratches present are probably caused by larger particles in the mix or by abrasion
during start-up or stopping when a lubricant film has not been generated.
The next two size bands (photographs (b) and (c) in Figure 9) show an interesting
phenomenon. The wear track shows two distinct regions, a central region where mostly
dents are present, and outer regions where the surface is grooved. The particles appear to
be tumbling through the central region and plough at the sides. The reason for this
becomes clear when one considers the nature of the lubricant film. The film consists of a
central plateau and a surrounding ÔhorseshoeÕ of lower thickness. Thus the particles at
the outer edges of the track are rolled over in a region of thin film; more of their bulk is
embedded in the contacting surfaces and the particles tolerate relative sliding motion by
ploughing through the ball surface. In the central region less of the material is embedded
and the particles tend to tumble through the contact. Figure 10 schematically
[image:11.612.150.466.364.632.2]demonstrates this behaviour.
Figure 10. Schematic representation of the ball wear track from the test with 0.5-1.0 µm
diamond abrasive powder alongside its ehl film.
Some grooves are present in the central region, again, these are probably caused by
larger particles in the abrasive size band, or by some particles sliding in the thin film regions of thin film
central film particles tumbling
particles grooving
region to the rear of the contact. It is true that slightly more sliding occurs in these outer
bands (microslip from the geometry of the contact). To check that this increase in sliding
was not responsible for the above feature, the test was repeated at a higher slide roll
ratio. The wear track was similar to that from the previous test (although with longer
grooves in the outer regions); no change in the width of these ploughing and tumbling
regions was visible.
For larger diamond abrasive sizes (photographs (d) and (e) in Figure 9) the transition is
no longer present. Ploughing is occurring across the whole contact width.
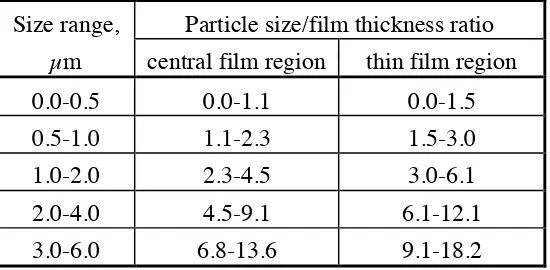
Williams and Hyncica [15] also noted this ploughing and tumbling process in their foil
bearing experiments. They suggest that for tumbling to occur the ratio of particle size to
lubricant film thickness must be less than about 2. At ratios greater than this value the
mechanism will be ploughing. Table 1 shows this ratio of particle size to film thickness,
for each of the size bands for the thin and central film regions, for these experiments. It
is clear that the particles in the central region for the 0.5-1.0 µm and 1.0-2.0 µm size
band may be in this tumbling regime; whilst ploughing is likely at the edges.
Size range, Particle size/film thickness ratio
µm central film region thin film region
0.0-0.5 0.0-1.1 0.0-1.5
0.5-1.0 1.1-2.3 1.5-3.0
1.0-2.0 2.3-4.5 3.0-6.1
2.0-4.0 4.5-9.1 6.1-12.1
[image:12.612.189.464.379.514.2]3.0-6.0 6.8-13.6 9.1-18.2
Table 1. Ratio of particle size to lubricant film thickness for each size band of diamond
abrasive used in the tests. Calculated central lubricant film thickness 0.44 µm.
Recently, Fang et al [18] describe experiments to study the motion of sand particles
trapped between surfaces. They noted that the shape of the particles also influence their
tendency to tumble or plough. Sharper sand grains were found to be more likely to
plough than rounded grains. It is also possible that the relative hardness of the rolling
elements may affect this tumbling behaviour.
These particle size tests were also repeated at higher concentrations. The mass loss
used in these tests are unlikely to have broken down in the contact; thus the plot
[image:13.612.134.500.144.375.2]represents a true relationship between particle size and the wear caused by that particle.
Figure 11. Ball mass loss plotted against approximate particle size for three diamond
abrasive concentrations.
The wear mass increases with particle size; each of the concentrations shows a similar
trend (again the wear mass is approximately proportional to the abrasive concentrations).
The chain dashed vertical line shown on Figure 11 represents the lubricant film
thickness. The plain dashed line represents an estimated threshold for particle tumbling
from reference [14]. Some reduction in wear is seen at these thresholds. The abrasive
particles used were graded into size bands (the data plotted on the graph is an estimate of
the mean particle size) thus abrupt changes in the slopes of the curves would be not
expected. Thus, the wear mass shown for a (mean) particle size equal to the film
thickness is likely to have been caused by the larger particles in the size range. The form
of this graph is discussed further in section 5 where comparisons with theoretical
predictions are drawn.
4. The Nature of Abrasion Scratches
Short duration low concentration tests (25 mg/l) were performed to generate a few wear
scratches on the ball surfaces. These were then measured using a surface profilometer;
5 4 3 2 1 0 0 2 4 6 8 25mg/l 50mg/l 200mg/l
Abrasive particle size, µm
Figure 12 shows a section through three typical scratches. The scratches were generally
of low slope with some raised shoulders.
Figure 12. Surface profiles of sections through typical abrasion scratches.
Buttery & Archard [19], in their work on the mechanisms of abrasive wear in grinding
abrasion operations classify scratches in terms of the three areas as shown in Figure 13a.
Figure 13. (a) The Buttery and Archard [19] representation of an idealised scratch.
(b) An idealised abrasive particle generating a scratch.
They then suggest that the area of the material removed from the abraded surface is given by (A3-A2). (Although this treatment neglects the plastic flow of material into the side walls of the scratch). They further define a factor, ζ representing the removed
material as a fraction of the material displaced;
(1)
This is then used in a model to predict the wear by the action of abrasive paper or a
grinding wheel. In these three body wear experiments the size of the abrasive particles is
known, since they do not deform in the contact. So, perhaps a more useful expression
might be; 0.2 µm
5 µm
A3
A2 A1 A2
δ surface 1
surface 2 abrasive
particle
Ac
h
(a) (b)
ζ= (A
[image:14.612.119.512.286.438.2](2)
where the material removed from the surface is expressed as a fraction, f of the cutting area of the abrasive particle. The cutting area of the particle is obtained from an assumed
cubic3 particle geometry and the film thickness, as shown in Figure 13b. So, if the
hardness of the two rolling elements is the same then;
(3)
In these tests the ball and disk hardnesses were slightly different, but probably close
[image:15.612.143.481.474.552.2]enough such that this eqution will hold. Thus given a fraction, f and an abrasive particle size, the wear attributable to each particle can be estimated.
Table 2 shows the average depth and width of the scratches generated by three different
sizes of diamond abrasive (sample size 15 standard deviations approximately 30% of the
mean). In all cases the largest scratches in a profile were measured to distinguish them
more clearly from other surface roughness effects. These scratches were likely to have
been caused by the larger particles in the size range. Therefore, the factor f is calculated using the maximum particle size in the range as δ in equation (2) for the determination of Ac. Particles less than 2 µm in size generated scratches which were too small to measure using a conventional stylus profilometer.
Particle Size, µm 2 - 4 3 - 6
Scratch depth, µm 0.3 0.9
Scratch width, µm 3.4 5.0
Particle cutting area Ac, µm2 from eqn (3) 6.9 16.3 Material removal fraction, f from eqn (2) 0.1 0.15
Table 2. Geometry of abrasive scratches generated by two abrasive particle sizes. The
scratch area is compared with cutting area of the particle.
The fraction, f is an indication of how much of the abrasive particle embedded area is removed as a wear chip. A large increase in particle size has not resulted in a significant
increase in the material removal factor, f . If the cutting particles are of similar shape,
3 Optical microscopy suggests that the abrasive particles are fairly close to cubic in
shape.
f =
(A3−A2)
Ac
Ac = δ √ 2 −
h 2 #
$ %&
and microstructural effects can be neglected, then the plastic flow process should be
independent of size and one might expect this to be the case.
5. Discussion
Rabinowitz et al [7] give a simple ploughing model of abrasive wear. The volume of
material removed by a conical ploughing grit of semi-angle, θ is given by;
(4)
where l is the distance the grit slides, W is the supported load, and H is the hardness of the abraded surface.
This closed lubricated three body wear process is geometry controlled. Increasing the
load does not increase the depth of penetration of the abrasive particles. This somewhat
simplifies the problem, since it is now no longer necessary to know the load supported
by the abrasive (which generally causes problems in predicting wear by abrasive papers
or grinding wheels). The tests described above have shown how the wear mass is
proportional to the concentration and sliding distance. It is possible, therefore, to write a
relation for the wear volume, V;
(5)
where N is the number of particles which become entrained into the contact, Ac is the embedded cross sectional area of a particle, d is the distance each particle slides, and
f is the material removal factor defined by equation (2).
A prediction for the number of particles, N to enter the contact can be made by determining the total volume of oil which passes through the contact and assume the
particles enter in direct proportion to their concentration in the bulk. The sliding
distance, d can be obtained from the kinematics of the contact, noting that the particles were held in the softer surface while they scratched the counterface. When the particle is
tumbling through the contact d is modified by considering the amount of material removed as the particle rotates about its own axis between the elements undergoing
relative sliding.
If the particle does not deform in the contact (small size ceramic debris), the cutting area, Ac can be readily obtained from the particle geometry and a predicted lubricant
V l =
W cot θ
πH
film thickness. For particles which breakdown in the inlet region to a contact (large size
brittle debris), it is the geometry of the fracture fragments which must be used to
determine the cutting area. Ductile debris materials deform to platelets and the cutting
area is harder to quantify; wear by these types of particles is to be the subject of future
investigations.
The material removal factor, f can be determined in one of two ways; from individual scratch measurements (as in equation (2)), or empirically using data determined from
[image:17.612.127.507.383.620.2]application specific abrasive wear tests.
Figure 14 shows three relations for abrasive mass loss with particle size. The experiment
data (re-plotted from Figure 11) is compared with the fully theoretical prediction (using f
from scratch measurements), and a semi-empirical prediction (using a value of f to make a closer fit). The multiplier, f can be used in this way as an empirical constant, specific to the abrasive wear application; to model the effect of microstructure, relative hardness,
modulus, etc. on material removal by a single abrasive particle.
Figure 14. Comparison of the experimental data with two formulations of the abrasive
wear model. Abrasive concentration 200 mg/l, slide roll ratio of -30%.
At first sight poor agreement is seen; however in any wear modelling to get within an
order of magnitude of experimental data is encouraging. Above the tumbling to
6 5
4 3
2 1
0 0 2 4 6 8 10
Abrasive particle size, µm
Ba
ll
w
ea
r ma
ss,
mg
Test data
Semi-empirical prediction
ploughing transition (at about 0.88 µm) the model predicts a reduction in wear with
increasing abrasive particle size. This occurs because in a given concentration by mass
the number of particles present increases rapidly as the particle size decreases. Thus
when a smaller abrasive particle is used the dramatic increase in the number of particles
present (proportional to the cube of the particle size) outweighs the decrease in the
particle cutting area (proportional to the square of the particle size).
The experimental data does not follow this trend. Although it would be instructive to
have further data points at larger particle sizes to see if the trend is maintained (however,
it is likely that larger particles will fracture in the contact). There are two possible causes
for this effect:
(i) Larger particles abrade proportionately more material.
(ii) Smaller particles are less likely to be entrained into the contact.
Table 2 showed the results of the scratch measurements. The fraction, f appears to be largely independent of particle size. However, these groove measurements and the
material removal fraction, f were deduced by considering a particle abrading a flat un-worn surface. It is possible that after some initial running-in period the surface will
become significantly rougher and the fraction of material removed may reduce. This
reduction may not occur in direct proportion to the particle size. This may be
responsible, in part, for the unexpected relation between wear and particle size.
In addition it is possible, that the discrepancies are also a result of some mechanism by
which larger particles are more likely to be entrained into the contact. Reference [17]
describes the use of a high speed video camera in conjunction with the optical ehl rig to
follow the motion of the abrasive particles. Small particles were seen to be swept around
the sides of the contact, whereas larger particles and those on the central flow lines were
entrained directly into the contact. Experiments are underway to study this mechanism
further.
6. Conclusions
The comparison of experimental data with this form of model on the basis of particle
size is interesting. The model is based on simple principles of abrasive wear. Some form
of non-disposable constant needs to be defined to predict absolute levels of wear. The
wear modelling. It is surprising, however, that the trend for predicted wear with particle
size is partly in contradiction with the recorded data.
Such results suggest that a major and dominating factor over this particle size range is
not present in the model. The most likely reason appears to be that the contact geometry
and film conditions are more selective in accepting certain particle sizes. The conditions
are creating a powerful particle filtration effect, which is worthy of more investigation.
The following general conclusions are drawn from the experimental studies.
(i) Ductile particles flatten and brittle particles fracture in the inlet to a rolling contact.
(ii) Small size ceramic particles pass through the contact undamaged. For this reason
fine graded diamond powder makes a useful test abrasive.
(iii) When a contacting pair were fed with contaminated lubricant, the abrasive
particles were found to embed in the softer surface and scratch the harder.
(iv) The mass of the material worn from the ball surface was found to be
approximately proportional to the sliding distance and the abrasive concentration.
(v) Small size particles were found to tumble through the contact; whilst larger
particles ploughed.
(vi) Mass loss was found to increase with abrasive particle size. A simple model has
been developed on the basis of these findings, giving order of magnitude
agreement with experimental data. A material removal constant f has been incorporated to account for the amount of material removed by a single abrasive
particle. This factor can be determined from individual scratch measurements or
from application specific data.
This information is useful in the prediction of the wear lives of components in an
environment of contaminated lubricant. Oil analysis will give particle sizes, material,
and concentration. Empirical estimates of the material removal factors can be obtained
experimentally. The operating characteristics of the contact will give the sliding distance
and lubricant film thickness. If information on the number of particles entering the
Acknowledgements
The authors would like to acknowledge the help and support of SKF ERC BV who
funded this work.
References
[1] Burwell, J. T., (1957), ÒSurvey of Possible Wear MechanismsÓ, Wear, Elsevier, Vol. 1, pp. 119-141.
[2] Kato, K., Hokkirigawa, K., Kayaba, T. and Endo, Y., (1986), ÒThree
Dimensional Shape Effect on Abrasive WearÓ, Transactions of the ASME, Journal of Tribology, Vol. 108, pp. 346-351.
[3] Goddard, J. and Wilman, H., (1962), ÒA Theory of Friction and Wear During
the Abrasion of MetalsÓ, Wear, Elsevier, Amsterdam, Vol. 5, pp. 114-135. [4] Larsen-Basse, J., (1968b), ÒInfluence of Grit Size on the Groove Formation
During Sliding AbrasionÓ, Wear, Elsevier, Vol. 11.
[5] Challen, J. M. and Oxley, P. L. B., (1979), ÒAn Explanation of the Different
Regimes of Friction and Wear Using Asperity Deformation ModelsÓ, Wear, Vol. 53, pp. 229-243.
[6] Torrance, A. A., (1980), ÒA New Approach to the Mechanics of AbrasionÓ,
Wear, Elsevier, Amsterdam, Vol. 67, pp. 233-257.
[7] Rabinowitz, E., Dunn, L. A. and Russell, P. G., (1961), ÒStudy of Abrasive
Wear under Three-Body ConditionsÓ, Wear, Elsevier, Vol. 4, pp. 345-355. [8] Misra, A. and Finnie, I., (1983), ÒAn Experimental Study of Three-Body
Abrasive WearÓ, Wear, Elsevier, Vol. 85, No.1, pp. 57-68.
[9] Lubrecht, A. A., Dwyer-Joyce, R. S. and Ioannides, E., (1991), ÒAnalysis of
the Influence of Indentations on Contact LifeÓ, Proceedings of 18th Leeds-Lyon Symposium on Tribology (Wear Particles - from the cradle to the grave), Elsevier, Amsterdam, ed. D.Dowson, C.M.Taylor, M.Godet.
[10] Dwyer-Joyce, R. S., Hamer, J. C., Sayles, R. S. and Ioannides, E., (1990),
ÒSurface Damage Effects Caused by Debris in Rolling Bearing Lubricants with a
Particular Emphasis on Friable Debris MaterialsÓ, Rolling Element Bearings - towards the 21st Century, Mechanical Engineering Publications for the I.Mech.E., pp. 1-8.
[11] Dwyer-Joyce, R. S., Hamer, J. C., Sayles, R. S. and Ioannides, E., (1991),
ÒLubricant Screening for Debris Effects to Improve Fatigue and Wear LifeÓ,
the cradle to the grave), Elsevier, Amsterdam, ed. D.Dowson, C.M.Taylor, M.Godet.
[12] Leonardo da Vinci (1493), Codex Madrid I, p. 119.
[13] Ronen, A. and Malkin, S., (1981), ÒWear Mechanisms of Statically Loaded
Hydrodynamic Bearings by Contaminant ParticlesÓ, Wear, Elsevier, Vol. 68, pp. 371-389.
[14] Broeder, J. J. and Heijnekamp, J. W., (1966), ÒAbrasive Wear of Journal
Bearings by Particles in the Oil (Apparatus, Experiments, and Observations)Ó,
Proceedings of the Institution of Mechanical Engineers, Lubrication and Wear Fourth Convention, Vol. 180 part 3K, pp. 21-31.
[15] Williams, J. A. and Hyncica, A. M., (1992), ÒMechanisms of Abrasive Wear in
Lubricated ContactsÓ, Wear, Elsevier, Amsterdam, Vol. 152, No.1, pp. 57-74. [16] Wan, G. T. Y. and Spikes, H. A., (1987), ÒThe Behaviour of Suspended Solid
Particles in Rolling and Sliding Elastohydrodynamic ContactsÓ, Transactions of the ASLE, Vol. 31, No.1, pp. 12-21.
[17] Dwyer-Joyce, R. S., (1993), ÒThe Effects of Lubricant Contamination on Rolling
Bearing PerformanceÓ, PhD Thesis, Unversity of London.
[18] Fang, L., Kong, X. and Qingde, Z., (1992), ÒA Wear Tetser Capable of
Monitoring and Evaluating the Movement Pattern of Abrasive Particles in
Three-Body AbrasionÓ, Wear, Elsevier, Vol. 159, pp. 115-120.
[19] Buttery, T. C. and Archard, J. F., (1971), ÒGrinding and Abrasive WearÓ,
List of Figures
Figure 1. Schematic diagram of the optical elastohydrodynamic apparatus.
Figure 2. Short duration flash photograph of originally 35 µm copper spheres in a rolling
contact. Entry direction left to right.
Figure 3. Short duration flash photograph of 5 µm silicon carbide particles in a rolling
contact. Entry direction left to right.
Figure 4. Schematic elevation view of the ball on disk apparatus.
Figure 5. Photographs of the wear tracks from ball tested with diamond abrasives at
various slide roll ratios (a) 0%, (b) -10%, (c) -25%, and (d) -40%.
Figure 6. Surface profile of a typical wear track on a ball surface. Recorded in the
transverse direction.
Figure 7. Plot of mass loss from the ball surface against sliding distance (determined
from the slide roll ratio and contact width). Test conditions 50 mg/l diamond abrasive
2-4 µm, ball speed 30 rps.
Figure 8. Plot of mass loss from the ball surface against abrasive concentration. Test
conditions -30% slide roll ratio, 2-4 µm diamond abrasive, ball speed 30 rps.
Figure 9. Photographs of the wear tracks from ball tested with diamond abrasives of
various size at a slide roll ratio of -30% (a) 0-0.5 µm, (b) 0.5-1.0 µm, (c) 1.0-2.0 µm, (d)
2.0-4.0 µm, and (e) 3.0-6.0 µm.
Figure 10. Schematic representation of the ball wear track from the test with 0.5-1.0 µm
diamond abrasive powder alongside its ehl film.
Figure 11. Ball mass loss plotted against approximate particle size for three diamond
abrasive concentrations.
Figure 13. (a) The Buttery and Archard [19] representation of an idealised scratch.
(b) An idealised abrasive particle generating a scratch.
Figure 14. Comparison of the experimental data with two formulations of the abrasive
Tables
Size range, Particle size/film thickness ratio
µm central film region thin film region
0.0-0.5 0.0-1.1 0.0-1.5
0.5-1.0 1.1-2.3 1.5-3.0
1.0-2.0 2.3-4.5 3.0-6.1
2.0-4.0 4.5-9.1 6.1-12.1
[image:24.612.140.484.356.435.2]3.0-6.0 6.8-13.6 9.1-18.2
Table 1. Ratio of particle size to lubricant film thickness for each size band of diamond
abrasive used in the tests. Calculated central lubricant film thickness 0.44 µm.
Particle Size, µm 2 - 4 3 - 6
Scratch depth, µm 0.3 0.9
Scratch width, µm 3.4 5.0
Particle cutting area Ac, µm2 from eqn (3) 6.9 16.3 Material removal fraction, f from eqn (2) 0.1 0.15
Table 2. Geometry of abrasive scratches generated by two abrasive particle sizes. The


![Figure 13. (a) The Buttery and Archard [19] representation of an idealised scratch. (b) An idealised abrasive particle generating a scratch](https://thumb-us.123doks.com/thumbv2/123dok_us/8097388.233248/14.612.119.512.286.438/buttery-archard-representation-idealised-idealised-abrasive-particle-generating.webp)


