Changes in Risk Perceptions Prospectively Predict Changes in Self-Reported Speeding
Stephen L. Brown
University of Liverpool
Stephen L. Brown, PhD CPsychol School of Dental Sciences
University of Liverpool Pembroke Place
Liverpool UK L3 5PS
Email: [email protected] Tel: 44 (0) 151 706 5108
Acknowledgement: The assistance of Transport SA (known as the South Australian Department of Transport during the conduct of the research), and particularly Mr. John Walker, in the collection of the data contained in this report is gratefully
Risk perception theories posit that changes in risk perception prompt subsequent changes in risk behavior. Prospective studies using observations made at three
time-points offer the capacity to test this hypothesis by observing sequential changes in both risk perceptions and behavior. A telephone survey was administered by
random-digit dialing to 255 adult Australian drivers at baseline (T1), 6 weeks (T2), and 14 weeks (T3). During weeks 2-5, a risk perception-based anti-speeding mass media campaign was conducted. The survey assessed risk perception, operationalized as the
proportion of time that driving at 70 km/h (43 mph) was perceived to be dangerous, and self-reported speeding behavior, defined as the frequency of respondents driving 5
km (3 mph) faster than the legal speed limit in built up areas. Higher T2 risk perception predicted lower T3 self-reports of speeding after controlling T1 risk
perception and T1 and T2 self-reported speeding. This can be interpreted as changes in
risk perceptions between T1 and T2 predicting changes in speeding between T2 and T3. Further analyses showed that increases in risk perception predicted lower
subsequent self-reported speeding changes, but decreases in risk perception were unrelated to those changes. Risk perception changes were unrelated to recall of exposure to the media campaign. These findings support a dynamic view of the
relationship between risk perception and self-reported behavior, and that risk perception theories can be applied to speeding.
1. INTRODUCTION
When applied to health and safety-related behavior, risk perception theories propose that people move toward the initiation of behavioral change after they perceive that
current behaviors carry a burden of risk(1). The risk perception literature is extensively used as a basis for mass-reach interventions to control risk-taking, and meta-analyses and reviews show prospective links between risk perceptions and behavioral changes
over a range of health behaviors(2,3,4). However, these links are often weak and may not apply to all health and safety behaviors(4). As risk perception theories are used to
underpin expensive and strategically important public health campaigns, it is crucial to develop a more secure empirical underpinning to the idea that inducing increases in risk perception leads to positive behavioral changes.
Road safety is one key public health area to which risk perception theory has been
applied. During 2007, 41,059 people were killed and 2.49 million injured in road crashes in the USA(5) and an estimated 1.2 million worldwide during 2004(6). Case-control studies show that vehicles involved in crashes are likely to have been
travelling at higher speeds than other vehicles using the same roads under the same conditions(7). Speed control is now a major road safety priority throughout the
world(6).
Some cross-sectional studies show support for the predicted negative association
between risk perception and speeding(8,9,10,11), although others find no
association(12,13,14). To some extent, this ambiguity is not surprising, as interpretation
associations between risk perception and behavior. Weinstein (15) shows that cross-sectional correlations can be interpreted as measures of how accurately people
perceive the riskiness of current behaviour. Thus, unless a completely new behavioral pattern is advocated, and no baseline for that behavior exists, it is not possible use a
cross-sectional design to test the proposition that risk perceptions precede behavior.
Two observation designs use baseline risk perception to predict either changes of
behavior, or subsequent behavior controlling baseline observations. These designs represent a standard approach in risk perception research because they allow
sequential interpretations. However, two observation designs treat risk as a static entity, which fails to fully test the prediction that changes in risk perception precede behavioral changes. Weinstein(15) advocates a three-observation design, where risk
perception is measured before and directly after any event that may change it. Behavior should be assessed before the event, contemporaneously with the first
measure of risk perception, and a sufficient length of time after the event to enable the post-event risk perception to cause behavioral change. The timing of the second behavior measure allows the actor time to act upon the risk perception change.
Particular importance lies in the timing of the post-event risk perception measure.
Provided that actors perceive risk accurately, reciprocal relations between risk perception and behavior means that any change in risk perception that causes
behavioral change will, in turn, be modified by the change it creates. The greater the
time-lag between the event and the second risk perception measure, the greater the prospect that this will occur. This will lead to an underestimation of the relationship
Weinstein‟s(15)
recommendation is suited to well controlled intervention contexts
where the timing of observations and events can be conducted with precision.
Achieving this precision in large-scale surveys of the driving population is obviously
more difficult. This problem may be circumvented by altering the way that risk perception is measured. Weinstein and colleagues (e.g., Weinstein, Kweitel, McCaul, et al.(16)) operationalize risk perception in terms of actors‟ perceptions of the
likelihood and severity of negative outcomes that are contingent upon behavior (usually phrased as the continuity of current behavior). Using this definition, risk
perception is a property of the interaction between risk inherent in a specific behavior and the frequency with which that behavior is engaged. These risk perception
measures will be responsive to any behavioral changes that they cause. Mills, Reyna
and Estrada(17) suggest that the responsiveness of risk perceptions to behavior can be reduced by measuring risk perceptions at a hypothetical level (e.g., „How risky is it to
exceed speed limits by X?‟). These measures allow prediction of behavior(9,16,17), but do not incorporate elements of current behaviour. Thus, they are less likely to respond to behavioral changes.
Operationalizing speeding as the perceived danger in exceeding speed limits („How
often is it dangerous to drive at 70km/h (43mph) in a 60 km/h (38mph) zone‟), this report describes a three-observation prospective study of the temporal relationship between changes in speeding-related risk perception and subsequent changes in
self-reported speeding. A baseline (T1) survey of the driving population was conducted before a mass-media campaign emphasising speeding-related crash risk. A second
weeks after T2 (T3). This provides the opportunity to link any campaign-induced risk perceptions (T2) to later self-reported speeding (T3). Evidence that risk perception
influences self-reported speeding requires that T2 risk perception negatively predicts T3 self-reports of self-reported speeding behavior, controlling T1 self-reported
speeding and risk perceptions and T2 self-reported speeding.
2. METHODS
The study was conducted in Adelaide, South Australia, from early April to mid June
1998. A media campaign, using the slogan „Think about the Impact‟, was conducted on prime-time popular television, radio and roadside billboards beginning a week before the Easter weekend. Messages stressed the danger inherent in small violations
of the speed limit, the social unacceptability of speeding and disputed common risk-mitigating excuses(9). Consequences of speed-related crashes were portrayed, but
highly distressing crash or medical imagery was avoided. A fortnight after the
campaign began, a substantive permanent increase of police resources was allocated to covert1 speed detection activities2.
Telephone interviews assessed risk perception and self-reported speeding behavior at
three time points. T1 interviews were conducted a week before the four-week media
1
Covert speed detection involves enforcement activities that are hidden from the driver.
2
campaign started. T2 interviews were conducted a week after it ended (six weeks after baseline), and T3 eight weeks after T2.
2.1 Participants
Telephone surveys were conducted by a private market research company with no professional interest in the survey outcomes. Telephone numbers were randomly
selected from a computerized version of the telephone directory. The interviewer requested permission to interview a holder of a current drivers‟ license who had driven
at least once within the previous month. In households where there were several license holders, the respondent was selected on the alternating criteria of being either the last or the next to have a birthday. When this respondent could not be contacted,
five call-backs were made before replacement in the sample. Possible recruitment biases toward participants with a permanent landline telephone and who spend greater
time in their household are acknowledged.
At T1, data were collected from 350 participants. It is difficult to fully evaluate the
degree to which this sample is representative of the driving population because a clause in the contract with the market research company prohibited release of the
number of non-respondents. At T2, 301 provided data. At T3 255 of the 301 T2 respondents of these provided data. These 255 were used in the final sample,
consisting of 120 males (47.1%) and 135 females (52.9%), with a mean of age 42.00
To assess possible dropout effects, the 255 participants who completed all phases of the study were compared with the 95 who fell out between T1 and T3, and whose data
were eliminated. A discriminant function analysis predicting study completion from age, gender, T1 Self-reported speeding and T1 Risk perception showed no multivariate prediction of dropout (χ2(4) = 4.90, Lambda = .986, Canonical Correlation = .119, p =
.298). Follow-up univariate analyses also showed no prediction of dropout.
2.2 Measures
Self-reported speeding behavior: Self-reported speeding was assessed using a single question “How often do you drive more than 5 km/h (3mph) faster than the legal speed
limit in built-up areas?” (at the time, these were predominately 60 km/h (37mph)
zones). Exceeding the limit by 5km/h (3mph) is associated with a doubling of risk(7) and is predictive of larger violations(9). The response format was; „most of the time‟, „about half or quarter of the time‟, „only occasionally‟, and „never‟. The possible range
was 0-3 with higher scores reflecting greater self-reported speeding. Self-report measures of speeding show moderate to strong correlations with observed
speeding(18,19) and are commonly used in speeding research(8,9).
Risk Perception: Risk perception appears to involve both cognitive and affective components(17,20). Single-item measures that capture both show good prediction of behaviour(16,17). The concept of dangerousness has been used to denote risk in several
road safety studies(9,21,22), and incorporates elements of emotional distress, risk and seriousness of potential outcomes(23). Respondents were asked to imagine themselves
of time that this would be „dangerous‟(9). Responses were coded as „all of the time‟, „most of the time‟, „about half or quarter of the time‟, „only occasionally‟ and „never‟.
The possible range was 0-4 with higher scores reflecting greater danger. An item pertaining to traveling at 65 (40mph) in a 60 zone was omitted after pre-testing
showed floor effects with low levels of perceived risk.
Campaign Exposure: Interpretations drawn from study findings will be strengthened if
risk perception changes can be linked to the media campaign. The extent to which participants‟ risk perceptions were linked to indicators of campaign exposure were
examined. Campaign recall provides a measure of attention and message processing, where greater specificity of recall suggests greater attention and more elaborate message processing(24). Three measures of media exposure were used at T2 only.
Firstly, participants were asked whether they were aware of existence of a media campaign. Then all participants were asked to spontaneously recall message themes. A
specific message score was compiled by the number of the following campaign themes recalled; the campaign slogan, small violations of the speed limit being dangerous, the social unacceptability of speeding and no excuses for speeding. This scale ranged 0-4,
with higher scores denoting more items recalled. A non-specific message score was compiled by drivers remembering more general themes; speeding is dangerous, speeding endangers others and „do not speed‟ (range 0-3).
Specific and General Media Recall both showed some skewness and kurtosis (skew =
1.24, kurtosis = 1.48 and skew = 1.90, kurtosis = 2.70 respectively). General Media recall was transformed by taking the square root (new Mean = 0.27, SD = 0.53, skew =
skewness and kurtosis on Specific Media recall proved resistant to transformation and the untransformed variable was used.
2.3 Procedure
Interviewers explained confidentiality and anonymity rights to respondents.
Interviewers first requested an unprompted response, and, where the response did not
exactly fit the category system, they prompted the respondent using the category system. A small trial of the questionnaire was conducted to ensure that participants‟
understanding of item meanings were consistent with the researcher‟s.
2.4 Analysis Plan
Hierarchical multiple regression was used to assess the extent to which T1-2 Risk
perception changes predict T2-3 Self-reported speeding changes. T3 Self-reported speeding was predicted from T2 Risk perception, controlling age, gender, T1 and T2 self-reported speeding and T1 risk perception. Statistical control of the T1 Risk
perception effectively yields a T1-2 change score associated with the T2 Risk perception variable. In a similar way, controlling T1 and T2 Self-reported speeding,
yields the equivalent of a T2-3 change score. Thus, the T2 residual is used to predict the T3 self-reported speeding residual. Variables were entered at four steps; firstly age, gender and T1 reported speeding, second T1 Risk perception, third T2
Self-reported speeding; and fourth T2 Risk perception. A significant change in R2 after the final step would indicate that T1-2 changes in Risk perception predict T2-3 changes in
3. RESULTS
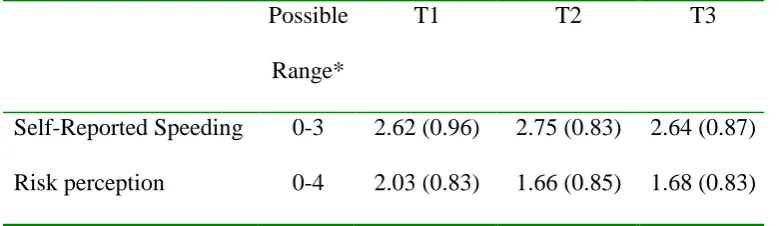
Means, SDs and frequencies of untransformed variables are shown in Table 1.
Repeated measures ANOVAs were conducted to detect temporal changes and, where significant, post hoc tests used to identify the nature of those changes. T2 observations of self-reported speeding were slightly higher than T1 and T3 (F(1,153) = 3.61,
η2
(partial) = .03, p<.05). Risk perception km fell from T1 to T2, with T3 observations remaining at the T2 level (F(1,253) = 36.88, η2
(partial) = .21 p<.01).
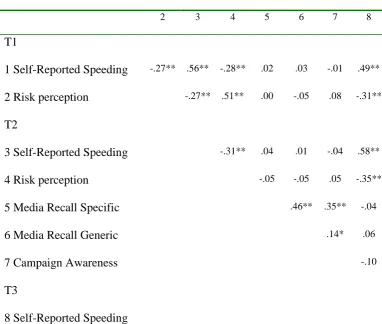
Correlations between variables at the three time points are presented in Table 2. As expected, Risk perception and Self-reported speeding were negatively correlated in
cross-section at T1 and T2, and prospectively from T1-2, T1-3 and T2-3. Neither Specific (mean=0.50, SD=0.66) nor Generic (mean=0.27, SD=0.53) Media Recall, nor
Campaign Awareness (82%, n=209, awareness) were associated with Self-reported speeding or Risk perception. This suggests that the media campaign had little effect on study variables.
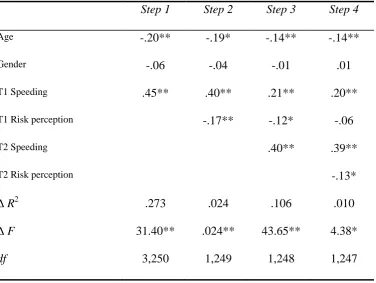
The regression equation significantly predicted T3 self-reported speeding
(R2(Adjusted)= .40 , p<.01). Changes in R2 and their significance and standardized betas for all steps are shown in Table 3. The significant 2.4% increase in explained varianceafter the addition of T1 Risk perception shows prospective prediction of
Self-reported speeding from a static risk perception variable. The significant 1.0% increase after the entry of T2 Risk perception demonstrates that T1-2 changes in Risk
From both theoretical and intervention viewpoints, it is important to understand
whether participants who increased, decreased or were stable on T1-2 risk perceptions made greater changes in T2-3 self-reported speeding. A change score was calculated
and partitioned into three dummy binomial variables representing: Downward changes in T1-2 Risk perception (n = 96) versus remaining static or upward movement; Stasis (138) versus upward or downward; and Upward (21) versus static or downward. The
previous regression was repeated three times, using each binomial variable at the fourth step instead of T2 Risk perception. This procedure was preferred to a single
analysis using dummy coding because the primary interest was in the extent to which each dummy variable could improve prediction of T3 Self-reported speeding, not the extent to which each does so independently of the others. In other words, the three analysis procedure maximizes individual standardized βs because it eliminates
variance shared between dummy variables. The upward movement binomial
significantly improved explained variance (ΔR2 = 0.010, β = -.10, F(1,247)=4.25, p <
.05), predicting decreased T3 Self-reported speeding. The other binomials did not improve explained variance in T3 Self-reported speeding (downward ΔR2 = 0.006, β =
-.01, p =.107; static ΔR2 =0.00, β = .00, F(1,247)=2.60, p =.739).
4. DISCUSSION
Risk perception theories posit that risk perception is a dynamic process, where
changes in risk perception lead to subsequent behavioral changes. There are few studies in any health or safety domain that explicitly link changes in risk perceptions
speeding related risk perceptions to lower self-reported speeding. The findings of this study showed that changes in self-reported speeding between T2-3 were predicted by
preceding T1-2 changes in the proportion of time that drivers considered it dangerous to be travelling at 70 km/h in a 60 zone. Follow-up analyses suggest that upward
movement in T1-2 risk perceptions may have been the active component in predicting self-reported speeding changes, but decreases had no relation to future self-reported speeding. Although an anti-speeding media campaign was conducted between T1-2,
perceptions of danger fell during this time, and risk perception changes were not linked to indicators of campaign recall.
The use of a three-observation design allows demonstration of a dynamic risk
perception process, where upward changes in perceived risk precede, and may cause,
reductions in risk behaviour. Although assumptions about this process underlie all theories of risk perception, this is one of the few studies to use a three observation
design to demonstrate this. This supports the prediction that increases in risk
perception precede positive health behavior changes. One downside of the findings is that changes in risk perception were not linked to the risk perception-based media
campaign, thus it cannot be claimed that a structured intervention was responsible for risk perception changes.
These findings are in line with the outcomes of several cross-sectional studies into the nature of the relationship between risk perception and self-reported speeding(8,9,10,11).
The prospective design provides stronger support for the application of risk
perception theories to speeding. Although changes in risk perceptions were not linked
have been shown to change target risk perceptions at a group level(11). Thus, although we did not show such a link, further work might demonstrate that risk perceptions
help to mediate relationships between anti-speeding campaigns and speeding reductions.
It is interesting that risk perception scores declined from T1-2 and remained at the T2 level at T3. It is unlikely that the campaign caused this pattern, as media exposure
variables were not related to risk perceptions or self-reported speeding. This may be an artefact, perhaps created by repeated measurement or related transient
environmental issues. The first interpretation appears to be unlikely, as self-reported speeding estimates did not decline in a similar way. Also, there did not appear to be differential correlations between T1 and T2 risk perceptions and other study variables
as would be expected from an artefact of multiple measurement. The cause of this reduction is unknown. Transient environmental factors, such as the weather, may
affect risk perceptions regarding speeding. None were noted during the study, although it was conducted during Autumn, where seasonal patterns may lead drivers to expect greater rainfall, making speeding more dangerous.
Although we have argued that self-reported speeding is closely associated with
observed speeding, the study must still be interpreted in the light of commonly understood limitations associated with behavioral self-reports. Also, risk was measured as the proportion of the time the respondent estimates that exceeding a
60km/h speed limit is considered to be dangerous. This measure conceptualises risk in terms of a driver‟s hypothetical, rather than actual, engagement in speeding. The
commonly used measures of outcome likelihood, the potential severity of those outcomes and emotional representations of risk. Also, the design deliberately covers a
reasonably short period of time, and it may be unwise to draw implications pertaining to the permanence of any effects observed in this study. Finally, the design of this
study allows conclusions to be drawn about sequential relations between risk perceptions and self-reported speeding. However, sequence should not be confused with cause, and the study does not provide conclusive evidence that risk perceptions
cause behavioral changes(15).
This study attempted a reasonably strict test of risk perception theory, finding prospective links between increases in risk perception and self-reported speeding reductions. This provides stronger evidence linking risk perceptions to self-reported
speeding than previous cross-sectional studies. Links were not found between risk perception changes and the anti-speeding media campaign, and further research may
help to tie changes in risk perceptions more firmly to structured interventions.
5. REFERENCES
1. Weinstein ND, Nicolich M. Correct and incorrect interpretations of correlations
between risk perceptions and risk behaviors. Health Psychology, 1993; 12: 235-245.
2. Brewer NT, Chapman GB, Gibbons FX, Gerrard M, McCaul KD, Weinstein ND.
Meta-analysis of the relationship between risk perceptions and health behavior:
3. Harrison JA, Mullen PD, Green LW. A meta-analysis of studies of the health
belief model in adults. Health Education Research, 1992; 7: 107-116.
4. van der Pligt J. Perceived risk and vulnerability as predictors of precautionary
behaviour. British Journal of Health Psychology, 1998; 3: 1-14.
5. National Highway Traffic Safety Administration. 2007 Traffic Safety Annual
Assessment – Highlights. Washington DC: NHTSA, DOT HS 811 017, 2008.
6. World Health Organization. World Report on Road Traffic Injury Prevention.
Geneva, WHO, 2004.
7. Kloeden CN, MacLean AJ, Moore VM, Ponte G. Travelling speed and the risk of
crash involvement. Canberra, Australia: Federal Office of Road Safety, CR172, 1997.
8. Adams-Guppy JR, Guppy A. Speeding in relation to perceptions of risk, utility
and driving style by British company car drivers. Ergonomics, 1995: 38:
2525-2535.
9. Brown SL, Cotton A. Risk-Mitigating Beliefs, Risk Estimates and Self-Reported
10. Fildes BN, Rumbold G, Leening A. (1991). Speed Behaviour and Drivers‟
Attitudes to Speeding. Melbourne, Australia: Monash University Accident
Research Centre, Report No. 16, 1991.
11. Rundmo T, Iversen H. Risk perceptions and driving behavior among adolescents
in two Norwegian counties before and after a traffic safety campaign. Safety Science, 2004; 42: 1-21.
12. Machin MA, Sankey KS. Relationships between young drivers‟ personality
characteristics, risk perceptions and driving behavior. Accident Analysis and Prevention, 2008; 40: 541-547.
13. McKenna FP, Horswill MS. Risk taking from the participant‟s perspective: The
case of driving and accident risk. Health Psychology, 2006; 25: 163-170.
14. Ulleberg P, Rundmo T. Personality, attitudes and risk perception as predictors of
risky driving behavior among young drivers. Safety Science, 2003; 41: 427-443.
15. Weinstein ND. Misleading tests of health behavior theories. Annals of Behavioral
Medicine, 2007; 33: 1-10.
16. Weinstein ND, Kwitel A, McCaul KD, Magnan RE, Gerrard M, GibbonsFX. Risk
17. Mills B, Reyna VF, Estrada S. Explaining contradictory relations between risk
perception and risk taking. Psychological Science, 2008; 19: 429-433.
18. Aberg L, Larsen L, Glad A, Beilinsson L. Observed vehicle speed and drivers‟
perceived speed of others. Applied Psychology: An International Review, 1997; 46: 287-302.
19. West RJ, French D, Kemp R, Elander J. Direct observation of driving, self-reports
of driver behavior and accident involvement. Ergonomics, 1993; 36: 557-567.
20. Slovic P, Peters E. Risk perception and affect. Current Directions in Psychological
Science, 2006; 15: 322-325.
21. Underwood J, Dillon J, Farnsworth B, Twiner, A. Reading the road: The influence of age and sex on child pedestrians‟ perceptions of road risk. British Journal of
Psychology, 2007; 98: 93-110.
22. Rosenbloom T, Nemrodov D, Ader B-E, Ehud E. Fear and danger appraisals of a
road-crossing scenario: A developmental perspective. Accident Analysis and Prevention, 2008; 40: 1619-1626.
23. Groeger JA, Chapman PR. Judgement of traffic scenes: The role of danger and
difficulty. Applied Cognitive Psychology, 1996; 10: 349-364.
24. Mehta A, Purvis SC. Reconsidering Recall and Emotion in Advertising. Journal of
Table 1: Means SDs and Frequencies of Study Variables (N=255).
Possible Range*
T1 T2 T3
Self-Reported Speeding 0-3 2.62 (0.96) 2.75 (0.83) 2.64 (0.87) Risk perception 0-4 2.03 (0.83) 1.66 (0.85) 1.68 (0.83)
Table II: Correlations Between Study Variables (N=255).
2 3 4 5 6 7 8
T1
1 Self-Reported Speeding -.27** .56** -.28** .02 .03 -.01 .49** 2 Risk perception -.27** .51** .00 -.05 .08 -.31** T2
3 Self-Reported Speeding -.31** .04 .01 -.04 .58** 4 Risk perception -.05 -.05 .05 -.35**
5 Media Recall Specific .46** .35** -.04
6 Media Recall Generic .14* .06
7 Campaign Awareness -.10
T3
Table III: Standardized Betas and Change in R2 After the Addition of Each Variable in
Hierarchical Regression Predicting T3 Speeding.
Step 1 Step 2 Step 3 Step 4
Age -.20** -.19* -.14** -.14**
Gender -.06 -.04 -.01 .01
T1 Speeding .45** .40** .21** .20**
T1 Risk perception -.17** -.12* -.06
T2 Speeding .40** .39**
T2 Risk perception -.13*
∆ R2
∆ F
df
.273
31.40** 3,250
.024
.024** 1,249
.106
43.65** 1,248
.010
4.38* 1,247