OPTIC GANGLION IN DIPTERAl"'\JS
Thesis by David Woods Arnett
In Partial Fulfillment of the Requirements For the Degree of
Doctor of Philosophy
California Institute of Technology Pasadena, California
1971
ACKNOWLEDGEMENTS
I would like to express my deep gratitude to Dr. Gilbert McCann for the encouragement and steadfast support given me throughout my years at the California Institute of Technology. I am also indebted to Dr. K. I. Naka for his good humor and inval-uable discussions.
I also wish to express my appreciation to M. Clay, D. Hodgetts, B. Ellert and D. Aranovich for their technical assistance and to Mrs. E. Fox for typing this manuscript.
ABSTRACT
Information processing properties of the dipteran first optic ganglion were studied by observing and analyzing the discharge behav-ior of two units in the intermediate chiasma and the slow potential behavior of two units in the first optic ganglion. Both types of chiasma units (on-off, on-maintained) were centripetal and corres-ponded to second order units in the first optic ganglion. The on-off unit was characterized by a transient discharge following the onset and cessation of a light pulse presented anywhere in the receptive field which had an elliptical configuration with average major and minor half directional sensitivity angles of 5. 5 and 4. 3 degrees, respectively. The receptive field of the on-maintained unit was composed of three roughly circular regions arranged adjacently along a line, and stimulation of the center region elicited a sustained ~discharge while stimulation of either adjacent region elicited an
off discharge. The average half directional sensitivity angle of the center~ region was 2. 5 degrees which compared well with the
acceptance angle of the photoreceptors. The orientation of the major axes of the on-off and on-maintained unit receptive fields was always that of the medio-lateral axis of the compound eye.
The on and off regions of the on
-
-maintained unit receptiveFurthermore, the off response was inhibited by~ region stimulation
if the cessation of~ region stimulation preceded, by not more than
200 msec., the cessation of off region stimulation.
The dis charge patterns of both units were independent of the
stimulus spectral wavelength, and all units studied, of both types,
possessed the same spectral sensitivity which was characterized by
two peaks of approximately equal ma;x:imum sensitivity centered at
350 mµ and 485 mµ. It was concluded that these units belonged to
the system served by photoreceptors 1-6 and that a photopigment
with two absorption peaks was responsible for the observed spectral
sensitivities. Neither unit displayed any sensitivity to the plane of
polarized light.
Positive slow potentials were recorded from the first optic
ganglion with fine micropipettes, and they were believed to originate
from the photoreceptor axons. A hyperpolarizi1:1g slow potential,
most likely of intracellular origin, was also recorded, but its
prop-erties were not studied in detail.
Based on their information processing properties, the on-off
and on-maintained units were identified with the two type I monopolar
neurons of each cartridge. A model was developed which adequately
explained the behavior of both types of units, and its structure was
compared with the known anatomical structure of the first optic
TABLE OF CONTENTS
CHAPTER TITLE PAGE
I INTRODUCTION l
II MATERIALS AND METHODS 11
III LIGHT EVOKED RESPONSES 37
IV DIRECTIONAL SENSITIVITY AND 65
RECEPTIVE FIELD ORGANIZATION
v
SPECTRAL AND POLARIZATION 108SENSITIVITY
VI FUNCTIONAL INTERACTIONS 142
VII DISCUSSION OF RESULTS 157
CHAPTER I
INTRODUCTION
The study of vision is as old as civilization itself and has not been solely the interest of scientists, but artists and philoso-phers as well. No one needs to be told how important vision is to his existence, for everyone, at one time or another, has
experi-enced a strong dependence on this sense while undergoing a
voluntary temporary loss of sight. Nearly every form of 1 ife from the single-celled amoeba to man has evolved a form of light sensi-tivity in conformity with the particular pressures of natural
selection. Elementary forms sense only the presence of light
which in some cases signals a source of food and in others an
dependent on vision in some of these animals reveals that their
eyes are able to detect other characteristics of light as well, such
as its spectral composition and polarization.
The compound eye of the fly provides a favorable
prepara-tion in which to study how the eye and the visual nervous system
are structurally and functionally organized to handle the relevant
information contained in spatial, temporal, spectral, and
polar-ized light patterns. Success in this endeavor requires a
quanti-tative approach, and the compound eye of the fly is advantageous
in this respect because its structure is highly ordered and
there-fore readily amenable to an algebraic description. The compound
eye is composed of sever al thousand independent optical elements
each being describable in terms of its optical .axis orientation and
directional sensitivity. Therefore it is possible to describe
quantitatively the stimulus presented to the compound eye in terms
of a set of equations depending only on the parameters of the optical
systems and the applied light distribution. Furthermore,
anatomi-cal studies [9, 33, 34, 50, 75, 77, 78, 79, 80] have shown that the optic
lobe of the fly is, likewise, highly structured from a relatively
small number of components (approximately one million), and
there is no evidence of any adaptive behavior in the fly.
Conse-quently, the structural rigidity and specificity make the compound
eye of the fly well suited for a quantitative description. In addition,
there is an increasing amount of information about the detailed
anatomy of the compound eye. However, the fly is not without
disadvantages, and its chief one which has been the limiting factor
in research of this type in the past is the difficulty in observing
the desired signal in the visual system due primarily to its size.
There are three basic approaches in the study of vision in
the compound eye, and each extrac_ts a distinct type of information.
The behavioral approach utilizes quantitative observations of
vision dependent behavior to answer questions pertaining to the
existence of sensitivity to particular properties of light, such as
color [16, 22, 37, 48], polarization [ 18, 23, 24, 36, 42], and
spatial-temporal organization [ 20, 51, 52], to the limits of vision [51, 70],
and to general mechanisms of vision [ 69] • This approach lumps
the functional and structural details of the compound eye and visual
nervous system into a black box having as its input the light
stimu-lus and as its output the observed behavior such as flight torque,
landing response, or phototaxis. The behavioral approach does
not provide an understanding of the neural mechanisms responsible
for the observed behaviors, but it does provide information which
is useful in the design of experiments in the other approaches.
The structural approach [9, 34, 50, 75, 77, 78, 79, 80} utilizes light
and electron microscopy to investigate the elaborate neural
struc-ture of the visual nervous system. Such an approach opens the
level. There is little doubt that a complete understanding of the
neural mechanisms of compound eye vision is impossible without
a comprehensive knowledge of the structure of the system.
Another recently developed approach [ 6, 31, 58, 59] utilizes the
method of single unit analysis. The single unit approach provides
information about light evoked neural behavior, and when
corre-lated with information from the strµctural approach makes it
possible to combine structure and function at the cellular level
to arrive at the neural mechanisms responsible for vision.
Information carried in a light pattern is expressed in terms
of its spatial-temporal organization and its spectral and
polariza-tion pattern. Due to the demands placed upon them, flying insects
developed the ability to detect certain types of information in light
patterns. Some of these types of information are also detected by
the vertebrate eye; others are specific to the compound eye and,
others are species specific. Studies [16, 24, 42, 37] using the
behavioral approach have shown that the compound eyes of many
insects are sensitive to the plane of light polarization and to
radiation whose spectrum is similar to that of humans but shifted
by approximately 100 mµ to shorter wavelengths. In fact, color
discrimination has also been demonstrated in some insects [16, 49].
Studies of the optomotor reaction in flies have revealed that their
compound eyes detect the direction of motion of a moving light
vertebrate eyes. Fast flying insects such as bees, flies, and
dragonflies must be capable of abstracting information from a
rapidly changing light environment, and studies have found that
the compound eyes of these insects have a frequency response an
order of magnitude higher than vertebrate eyes.
Recent neural anatomical studies of the fly visual system
have revealed a highly ordered structure. As a first
approxima-tion, the neural structure of the fly compound eye and optic lobe
can be divided into several serially organized subsystems which
have a morphological identity.
abstractions abstractions
Retina ls t 2nd 3rd brain
optic optic optic
ganglion ganglion ganglion
(Lamina) (Medulla) (Lobula-lobula plate)
Although existing feedback paths between subsystems are not
indi-cated, the schematic model is quite general and helpful when
considering the basic structure and function of the fly visual
system. Due to the specially developed optical and photon
absorb-ing properties of the retina, only the functionally relevant
infor-mation in the light stimulus falling on the retina is actually retained
in the multidimensional signal leaving the retina. Each subsystem
creates functionally important abstractions on these signals, such as the abstraction of information concerning the direction and rate of a moving light pattern. The consequences of these transforma-tions and abstractransforma-tions are manifested in the various light induced behaviors. As the neuroanatomists provide more structural information, refinements can be made in the model. In fact, the model could be structurally refineQ., as a great amount is already known about the elaborate structure of the retina and first optic ganglion; however, the single unit approach has not provided enough insight into the cellular functions corresponding to these refinements to justify their incorporation into the model.
The above model represents a hierarchy of information transformations. Complete understanding of how information is processed by the fly visual nervous system will only come after studies on the cellular level are made at each stage in the infor-mation processing hierarchy. Structural inforinfor-mation on the cellular level will come from histological studies, and cellular functional information will come from the analysis of single neuron behavior (slow and spike potentials) at each level of the system.
changes in response to specific types of light stimulation. Slow potential changes [56, 72, 90] have been recorded from the first optic ganglion in an attempt to elucidate the nature of the informa-tion transformainforma-tion taking place at this level. Although spike discharges have not been observed in the retina or first optic ganglion of the fly, they appear to be the mode of information transmission at higher levels of the visual nervous system. Com-prehensive studies [ 7, 8, 19, 53] have been made of a set of single units in the third optic ganglion and the brain which abstract
in-formation about the direction of moving light patterns. These studies have revealed that the units responsible for this abstrac-tion are inti1nately involved in the optomotor response mechanism. However, the exact neural mechanism of directionally selective motion detection is still unknown and can only be determined after precursory units have been studied.
·have been recorded fr.om single cells in this region. The absence of spike discharge from the first optic ganglion is perplexing be-cause it is difficult to understand how slow potentials could pas-sively transmit information to the relatively distant second optic ganglion.
The reported absence of spike discharge potentials from the first optic ganglion and the need to study the functional behavior of units presynaptic to the directionally selective motion detection units in the third optic ganglion provided the impetus for the study, reported in this thesis, of single units in the first optic ganglion. Furthermore, extensive knowledge was available about the trans-ducing properties of the retina and about the detailed structural organization of the retina and first optic ganglion. Therefore, the study of single second order units in the first optic ganglion would provide information concerning the characteristics of the signal transformation at this level which could be correlated with the existing structural evidence to provide a cellular level model ex-plaining the transformations.
By employing special recording procedures, it was possible to observe single unit discharge behavior in the intermediate
chiasma. The observed signals corresponded to output signals of the first optic ganglion. With this ability to observe output sig-nals from the first optic ganglion, several interesting questions
processing could be posed. For example,
1. How is information concerning the spectrum of the stimulus coded in the discharge patterns of these units, and is there evidence of wavelength discrimination mechanisms?
2. What transformations, if any, are made on the transduced light polarization information by the first optic ganglion?
3. What is the organization of the spatial transfor-mation?
4. What transformations are made on the temporal properties of the light stimulus?
5. How can the information transformations be ex-plained in terms of the synaptic structure of the first optic ganglion?
6. What relevance are these transformations to the abstraction of motion detection?
Chapters III, IV, V and VI, presents the results of the
experi-ments. The conclusions are discussed in the third part which
CHAPTER II
MATERIALS AND METHODS
Introduction
This chapter begins with a description of the specimen
preparation used in extracellular and slow potential recording
experiments. The following section describes the methods
em-ployed for recording extracellular spike potentials and slow
potentials, followed by a description of the stimulating equipment
used to elicit the recorded responses. The chapter concludes
with a detailed account of the methods of data analysis.
Specimen Preparation
All experiments described in this thesis utilized insects of
the order Diptera as the biological material under investigation.
Most of the data were obtained from Phaenicia sericati and
to
alesser extent Calliphora erythrocephala; however, responses
similar to those to be described for these two species were also
observed in Musca domestica and Sarcophaga. These animals
were bred and raised in our laboratory. Specimens selected for
an experiment ranged in age from 3-12 days post-emergence, and,
generally, females were selected due
to
the observation that malepreparations were less stable. No differences in neural behavior
The mechanical stability of preparations used in
extra-cellular potential recording experiments was not critical which
allowed the animals to be used intact. For such experiments, the
selected specimen was mounted intact on a special ball joint
stand by dental wax (Periphery wax) applied with a small heat
loop. The specimen was secureci in such a way that the thorax
and head were completely immobile, but the abdomen was left
free to move so that respiration was unrestricted. No anesthesia
of any type was used. The optic lobe of the right eye was exposed
by tilting the head forward by approximately 30 degrees and
re-moving a triangular flap of exoskeleton from the posterior surface
of the head. Various globular tissues were carefully removed
from the head capsule without damaging the neural tis sue or
tracheal system. Afterwards, ringer's solution [71] (9. gm
NaCl, • 2 gm KCl, • 2 gm CaC1
2, 4. gm glucose per 1000 mL
buf-fered to pH 7. 2 with phosphate buffer) was added, if required,
and a platinum indifferent electrode was secured so that it made
good electrical contact with the heamolymph circulating through
the head capsule. A preparation was judged good if only slight
pulsation of the tracheal air sacks and heamolymph could be
ob-served. In such a preparation, the retina and all optic ganglia
could be visually identified.
The mechanical stability of preparations for slow potential
were eliminated by removing the head from the thorax. The
iso-lated head was secured to the stand so that the head was rotated
by 90 degrees from its position in extracellular experiments as
described above (i. e. , the right eye was above the left eye, and
the mouthparts were to the right). The lamina and the retina were
exposed by cleanly slicing away the lateral half of the right eye;
thereby, making it possible to drive a vertically oriented
micro-pipette into the desired neural tis sue. In good preparations, the
entire length of individual ommatidia could be observed along with
a clear demarcation of the lamina ganglionaris. The platinum
indifferent electrode made contact with a small pool of ringer's
solution which wet a part of the head exoskeleton, and the
prepa-ration was placed in a high humidity environment (r. h.
>
90%) toreduce drying. It was possible to record extracellular discharge
activity, typical of that found in intact preparations, from
selec-tive motion detection units in the lobulla-lobullar plate region in
isolated head preparations.
Recording Methods
The results presented in this thesis were derived from two
types of data. Extracellular spike potentials constituted the major
type of data while slow potentials were used much less extensively.
Because the methods used to obtain both types of data differed,
they will be described separately. Several different types of
(stainless steel, tungsten, electrolyte filled glass pipettes, suction
electrodes, Wood's metal filled glass pipettes); however, etched
tungsten electrodes were found to be superior for two reasons.
First, the noise level of the microelectrode in the standard
re-cording situation was low enough to easily discriminate a 50
micro-volt pulse of . 1 msec duration. Second, the recording surface of
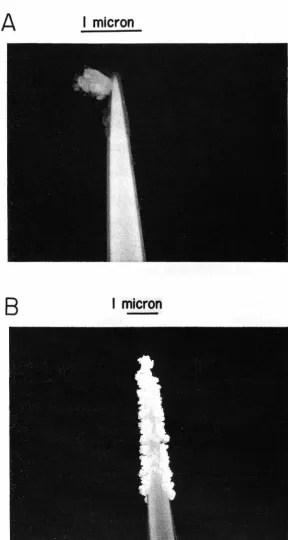
the micro electrode was relatively J.arge (2 microns) as shown by
the scanning electron micrographs of a tungsten microelectrode
in figure 2. 1 which provided a greater recording life once a single
unit had been isolated than did microelectrodes with smaller
recording surfaces.
The tungsten microelectrode was etched to the desired
shape using the procedure described by Hubel [35
J.
To reducethe inherent noise associated with a tungsten- electrolyte interface,
a platinum black surface was plated on the microelectrode tip in a
two step process. A layer of gold was first plated on the tungsten
to serve as an adhering base for the platinum surface plated in
the second step. The microelectrodes were then coated with three
layers of epoxy resin (Hysol AC4396) which served as an excellent
and strong insulator (figure 2. IA). Immediately before a
micro-electrode was to be used, the ins.ulation at the tip was removed by
passing a brief pulse of current through the microelectrode whil.e
the tip made contact with the platinum plating solution (figure 2. l B ).
A
micron
B
micron
Figure 2. 1 Scanning electronmicrographs of tungsten microelectrodes
A. Microelectrode coated with an epoxy resin insulator (and piece of
dirt)
[image:20.618.191.480.86.627.2]black was deposited on the tip. During an experiment, the
micro-electrode was positioned by a standard gear drive
micromanipula-tor. Although it was possible to determine with good accuracy the
point of microelectrode insertion into the optic lobe, it was
impos-sible to judge the depth of penetration, for the tis sue was
sufficiently compliant to allow considerable tis sue deformation
near the site of the microelectrode. penetration. Fortunately, it
was not necessary to know the location of the micro electrode tip
to any better accuracy than the specific neuropile or chiasma
penetrated.
Glass micropipettes filled with 2M potassium citrate were
used to record slow potential from the lamina and retina. The
micropipettes were drawn from capillary tubing (Corning #7740)
with a vertical puller (DKI 700c) and were filled by the standard
diffusion technique. An acceptable micropipette had a tip diameter
less than . 5 microns and a resistance of greater than 100
Meg-ohms. The micropipettes were positioned by a hydraulic
micro-manipulator which decoupled the micropipette from mechanical
perturbations introduced by the experimenter.
The discharge potentials recorded by the extracellular
microelectrodes were amplified and stored on magnetic tape as
shown in the schematic diagram of figure 2. 2. The d. c. offset
was not used during extracellular potential recording experiments,
PRE-AMP BIOELEC
NF1
DC-IOKHZ
x
4DC
OFFSET
CALIBRATION
UNIT BIOELE CA5
SPEAKER
AUDIO AMP
VARIABLE BANDPASS FILTER KROHN-HITE
300MR
x
.25 STIMULUS [ SIGNALS __ _____. AUDIO 1---"' -AMP 4 TRACE
OSCOCOPE TEKTRONIX
561A
MAGNETIC TAPE~
RECORDER
\___)
The variable bandpass filter was found to be a useful tool for enhancing the signal to noise ratio. When two extracellular microelectrodes were used, the potential recorded by the second microelectrode was processed in a similar manner. Slow poten-tials recorded with micropipettes were processed in the same
manner except that the preamplifier was direct coupled and followed by a direct coupled amplifier in pa.rallel with the capacitive
coupled differential amplifier and the variable bandpass filter. The capacitive cou:pled channel allowed higher gain for better
observation while the direct coupled channel preserved the potential waveforms and was stored on magnetic tape. The stimulus signals recorded on tape varied depending upon the experiment (wedge position, waveform of stimulus channel 1, of stimulus channel 2) and will be apparent when the experiments are later described. The signals recorded on magnetic tape were later reproduced for analysis by computer methods and for photographic purposes.
Stimulus Equipment
The light stimulus used in the course of these experiments can be characterized with respect
to
the following class es of attributes:1. Spectral composition (A)
2. Angular orientation of the plane of polarization (a) 3. Spatial attributes (multi-dimensional)
The multi-dimensionality of parameters belonging to classes 3 and 4 precluded their identification, but they will become apparent
when specific stimuli are described. Two separate stimulating
facilities were utilized to generate stimuli having the above
parameters at the control of the experimenter. One facility
illus-trated in figure 2. 3 utilizing direct stimulation was specially
designed to provide the experimenter with control of classes one
and two and will be described first. The other facility utilized
reflected light which made it possible to manipulate the parameters
of classes three and four.
The primary source of light (S
1) for the direct stimulator
was a 150 watt xenon arc lamp (Hanovia 901 Cl) driven by a
regu-lated power supply (Bausch and Lomb). The quartz condensing
system (L
1, L2) focused the light at the plane of the pinhole (Ph);
however, a frosted quartz diffuser (D
1) was inserted behind the
condensing lenses to make the intensity distribution at the pinhole
uniform and to reduce the amount of supplied light. Before
reach-ing the pinhole, the light was filtered by distilled water in a quartz
cell (C) which removed most of the infra-red component. The
light beam was interrupted by a rotary solenoid actuated shutter
(Sh), and the signal of stimulation was derived from a photodiode
(Pd) placed behind the shutter. Light passing through the pinhole
was accurately attenuated by a 4 log unit neutral density circular
wedge (Kodak, Inconel on quartz, W) which was mounted on a
~
PREPARATIONS2
p
~
Sc
L4
F&
F6 D2F3 F2 F1
L3
w
Ph
TAPE
__
RECORDER
.,
v
Sh
c
DIGITAL VOLTMETER TAPE RECORDER
o,
L2
L,
SOLENOID
STIMULUS PULSE
Figure
2.
3
Schematic
diagram
of
the
direct
stimulating
apparatus
position. After the light was collimated by the quartz achromat (L
3), it passed through a maximum of three 2
11 x 211 filters (Fl, F2, F3) consisting of narrow and wide band interference filters (Balzer, Filtraflex A-UV, B-HO) and one log unit neutral density filters (Inconel on quartz, Kodak). When the secondary source
(S
2) was utilized, a 1 log unit neutral density filter (Inconel on quartz, Kodak, . F
4) was introduced at 45 degrees to the primary beam so that the two beams were added. A polarizer (P) could be inserted into the combined beams, and the angle of the plane of polarization could be changed in steps of 30 degrees. After pas sing through a hole in the screen (Sc, white cardboard 2 ft. square), both concentric beams of uniform intensity were incident directly on the compound eye. The diameter of the smaller primary beam was 6 mm which was large enough to illuminate the entire head of the preparation. A 6 volt tungsten filament bulb (S
2) provided the light for the second beam whicr~ was used for supplying a steady adapting stimulus. After being collimated, the beam passed
through a narrow band interference filter (F
5), a wratten neutral density filter (F
6) and a diffuser (D2) before being added to the primary beam.
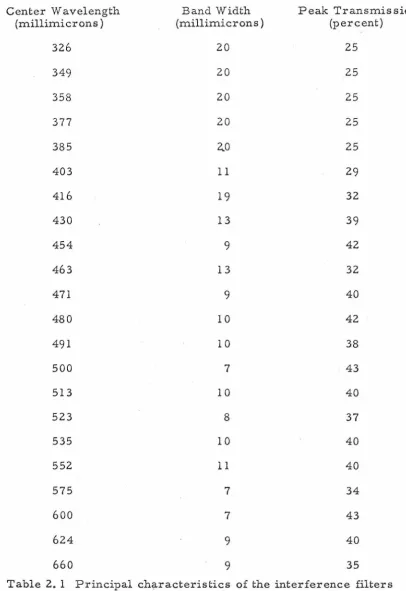
are listed in table 2. 1 for all interference filters used during the course of these experiments. The intensity of the stimulus was calibrated with a Reeder thermopile (RBL-500) placed in the posi-tion normally occupied by the preparation, and the calibration measurements were taken from a Keithley Microammeter (l 50B) whose input was the thermopile signal.
The preparation was attachefl. to a specially design movable platform carrying the micromanipulator as diagrammed in figure 2. 4. So placed, the compound eye occupied the center of a spheri-cal coordinate system (8, ¢) through which the stimulus beams also pass ed. The platform could be rotated in the orthogonal great circles defining the spherical coordinate system without causing significant translational movement of the compound eye due to im-perfect centering of the preparation with respect to the uniform intensity stimulating beam. To assure that the stimulus was effec-tively a point source, a light sensor was built from two separated pinhole masks followed by a photomultiplier tube such that the optical window was less than. 1 degree. The directional radiation of the stimulating beam was measured to be small compared to the optical window of the sensor, and therefore, small enough with
Center Wavelength (millimicrons) 326 349 358 377 385 403 416 430 454 463 471 480 491 500 513 523 535 552 575 600 624 660
Interference Filter Table
Band Width (millimicrons) 20 20 20 20 2..0 11 19 13 9 13 9 10 10 7 10 8 10 11 7 7 9 9
Peak Transmission (percent) 25 25 25 25 25 29 32 39 42 32 40 42 38 43 40 37 40 40 34 43 40 35
[image:28.617.135.541.110.701.2]I I I I I I Precision Potentiometer
I
/
I//
//ij
-...,..-...,r..
--
---"---+---~"'-,
_
-
-'---//
I
Precision Potentiometer
Stimulus
Beam
Ci)
Tektronix 564X-Y
Oscilloscope
Screen
Figure
2.
4
Schematic
diagram
of
the
movable
platform
carrying
the
preparation
and
Since the micromanipulator carrying the microelectrode was rigidly fixed to the platform supporting the preparation, it was possible to adjust the microelectrode position until a satisfactory unit discharge or slow potential was recorded. Having done this, the location of the receptive field was determined by projecting small spots of light generated from a hand-held source onto the screen (Sc). In general, the receptive field center was not initially coincident with the stimulation light beam passing through the 1/411
diameter hole in the center of the screen (Sc). It was therefore necessary to rotate the platform in the 8 and cf> directions until the
sensitivity, and directional sensitivity were carried out using this stimulating apparatus.
The stimulus environment [ 7] used when studying single unit discharge behavior as a function of various spatial and temporal light intensity programs consisted of a six-foot diameter reflecting
moving striped patterns. Complex spatial and temporal patterns were derived from a three channel tungsten filament projector. Each channel was capable of projecting different stationary light patterns, and since each channel was independently controlled, projection of complex temporal sequences of different spatial
pat-terns was possible. The spectral characteristic of the stimuli derived from these projectors was that of a tungsten filament
source.
Data Processing
The success of an investigation of any phenomenon depends upon the formulation of the problem (i. e. , asking the right ques-tions and defining pertinent variables) and the observability of the formulated experimental variables. Studies of many neural phe-nomenon are plagued by the complexity of the phephe-nomenon observed and by limited observations due principally to the size of the struc-tures involved. Consequently, neurophysiologists have confined their attentions to isolated parts of the total system in hopes of synthesizing an understanding of the phenomenon from understand-ings of its parts. The advantage of this reasoning are that formula-tions are simplified, but complete observation is less likely.
in the visual system of the compound eye, the experiment variables are those previously defined, and the state of a single unit is de-fined to be its membrane potential. Unfortunately, observation of membrane potential change is difficult and is frequently replaced by the more readily observable extracellular discharge potential. However, the use of single unit spike discharge as an experiment variable has one particular shortco~ing not shared by the use of the more desired membrane potential. That is, the amount of information contained in a spike dis charge response to a particular stimulus is far less than that contained in the slow membrane
potential of the same unit to the same stimulus. Slow membrane potentials are encoded into propagating spike potentials by a threshold phenomenon. This process is essentially one of data reduction. However, noise or apparent random fluctuation whether intrinsic in origin or from uncontrolled inputs is present in the slow membrane potential which, in magnitude, is generally small compared to the magnitude of the signal component in the mem-brane potential. This, of course, depends upon the unit and the
stimulus as discussed by Bullock [ 10]. The threshold encoder accounts for the data reduction between the membrane potential and the discharge and at the same time decreases the apparent signal to noise ratio. It is not known whether the frequently ob-served random appearance of discharge patterns is truly due to
of the dis charge pattern. Nevertheless, a detailed and quantitative understanding of the system requires the signal (as neurophysiolo-gist defines it, not necessarily as the postsynaptic neuron defines it) to noise ratio be enhanced by forming an average from sequential discharge trials to identical stimuli. This is not necessary with membrane potentials. Therefore, what is gained in observability by using discharge behavior as the experimental signal is partially lost by the necessity to reduce statistical fluctuation by sequential averaging. Either the animal doesn1
t have this problem due to its interpretation of discharge patterns or it does, but solves it by parallel average or by smoothing.
Most experiments described in this thesis utilized spike dis charge potentials as the experimental output, and appropriate averages were calculated by a computer implemented data collec-tion and analysis system [ 19, 48]. Before the data acquisicollec-tion and analysis system is described, a mathematical formulation of discharge data [25, 54, 55, 66, 67] will be given. It is assumed that all spike potentials from a given neuron are indistinguishable and that they are instantaneous. Under these assumptions, the informa-tion conveyed in a spike train is necessarily contained in the time of occurrence of individual spikes or the time of events (TO E1
s ). Therefore, only the TOE1
s of a spike train need be abstracted which represents an enormous amount of data reduction. A spike train is therefore mathematically represented by a set of TOE1
I I
•
•. f f .th 'k
t. = time o occurrence o J sp1 e
J
r = { t
1 , t2, •••• t j, •• •• }
The response representation r contains all the information carried by the spike train, but without a similar representation of the
stimulus very little of it can be revealed. Given the important parameters of the stimulus (duration, intensity, wavelength), it
can likewise be mathematically represented by a sequence of TOE1 s
corresponding to the initiation of each stimulus.
. f f . th t' 1
s. = time o occurrence o i s imu us l
s ={s1,s2 .•. • si . . . . }
A basic abstraction on the data ( r, s) results by forming a histogram of stimulus-response latencies (T .. ) and is called the post stimulus
~ '
~l ~2 ~3 ~4
I I I
I I I
I I I
I I I
I
~
1~2
I
~3
I.t4
:s
I I
I
I I
I I I I I I I
:;1~
I I'T 21 I I 'T 31 I I
I
:.c
>'
I II I
~
)I II
I I I I I I
I I I I I
k(
>l
I K>l
I
'T 12
I
'T 32 I
the probability of a spike at time T given that the stimulus was
pre-d . 0 (. p b [spike at
t
=rj
] )
sente att1me i.e., ro t• 1 t t 0 •
S imu US a =
Alternatively, if the spike train is formulated to comprise a
stimu-lus evoked signal component and a noise component, then the PST
histogram represents the average discharge elicited by the
stimu-lus. As the number of trials accumulates, the PST histogram
approaches the stimulus evoked signal component (i.e. , the
magni-tude of the noise component decreases approximately as 1'[N where
N is the number of trials in the average). Autocorrelation and
crosscorrelation are generalizations of the PST average. Instead
of compiling a histogram of stimulus-response latencies (7 .. ), a
lJ
histogram is formed from response-response latencies (.R. . . ). For
lJ
autocorrelation the two sets of response TOE' s defining the latencies
(1. .) are identical; however, the more useful crosscorrelation uses
lJ
TOE' s representing two separate spike trains. In effect, the
cross-correlogram is a PST histogram of the TOE1
s representing one
t.l t2 t3 t4 TOE' s of unit a
• I T
r
I I
I I
I I
I I
I I l
t l tl I I t I t I
TOE' s of unit b I
I
•
I yl .4I T I I I
I i l l I I .£21 I
I : .Q 31 I I I<:
>I
1<
>:
1<
)I I I II I
222: I< ~ ;:;i.1
I
k
I I : 41>11 I I I2
12
I I
"'132 :
~
I..:
I II )I
1<
I )>1,train. The crosscorrelogran'l approximates the probability of a spike at time 'T in unit B given a spike in unit A at a time 0 (i. e. ,
Prob [ B spike at t
=
'T /A spike at t=
0 ] ) .The mathematical formulation of spike trains in terms of sequences of TOE' s and the mathematical operations thereupon are particularly well suited for computer implementation. In fact, the necessity of high speed computation is readily appreciated upon
The basic configuration of the data acquisition and analysis system used in processing experimental data is shown in figure 2. 5. The LORI was essentially a special-purpose computer and served as an interface between the experimental data and the central com-puter. It was equipped with a high speed analog to digital converter
(500 kHz), a 10-channel multiplexer, and several digital clocks and could accept either of two basic data modes (continuous, TOE) on any of the 10 LORI channels. Continuous mode signals such as
slow potentials and wedge position were fed directly into the desired LORI channels, and the LORI processed the signals by sampling them at variable rates up to 500 kHz. The sample values were transmitted to the central processor and stored in bulk memory. A TOE mode signal consisted of a string of negative pulses and was fed to any one of the LORI channels. The occurrence of a negative pulse (an event) triggered the LORI to transmit the contents (time of event) of a 27 bit clock to the central processor where it was
stored in bulk memory. The clock rate could be preset to corres-pond with the desired accuracy; usually a clock rate of 50 kHz was used which corresponded to a TOE accuracy of 20 micro-seconds.
OSCILLOSCOPE
®
TEKTRONIX 565 TAPE RECORDER----.>
FUNCTIONKEYS 00000 00
00 0 0 0 0 0 0
·
LORI
IBM 2250.
.
...
.
.
...
..
.
.
.
.
. ...
.
.
.
....
..
....
KEYBOARD---->I
P~~~E~~tR
<
>
IBM 360/44I~
LIGHTPEN
BULK
MEMORY
5-DISK DRIVES
potential (or stimulus signals) while the negative gate signal was
fed to one of the LORI channels. For each TOE mode signal
trans-mitted by the LORI, an independent oscilloscope time base was
required; however, the maximum number of TOE channels used
was only three (two spike trains and one stimulus). Occasionally
two separable spike trains were recorded on a single electrode.
One string of negative pulses was derived entirely from the larger
spikes while the other string was derived from both the larger
and smaller spikes. Thus one set of stored TOE' s corresponded
to the larger spikes only, but the other set of TOE' s represented
both the larger and smaller spikes. The TOE' s corresponding to
the smaller spikes were determined by executing one of the data
analysis programs which simply formed an exclusive 11or11
opera-tion on the two TOE data sets. In summary, data acquisiopera-tion was
achieved through the LORI which provided a channel through which
continuous and TOE mode signals were transmitted to the central
processor.
Having transmitted the data (TOE' s, sample values) to the
central processor (IBM 360/44) where it was stored in bulk memory
(3 IBM 2314 Disk units), the next step was to analyze the data.
Interaction with the computer during the analysis phase was made
through the IBM 2250 display terminal via the light pen, keyboard,
and function keys. It was located close to the LORI and had a 21
inch CRT on which the results of mathematical operations on the
were identified by a name which was specified during the acquisition
phase. Analysis of a data set was initiated by selecting an
approp-riate analysis algorithm from the library of analysis subroutines
each of which corresponded to an appropriate function key.
For exa1nple, consider forming a PST histogram of the
TOE's contained in the data set 11SPIKE11 which correspond to
discharges, relative to the TOE1
s o.f the data set 11STIM11 which
correspond to onsets of repeated stimulation. The first step would
be to initiate the PST histogram algorithm by pressing the function
key designated for this process. Subsequently, the PST process
identification page would appear on the display unit CRT requiring
the names of the data sets to be used in the algorithm. Display of
the parameter identification page would follow after the dataset
names SPIKE and STIM were supplied. After values for three
parameters (minimum latency, maximum latency, bin width) were
typed into the computer, execution of the process would begin.
Upon completion, the computed histogram would appear on the CRT,
and if any changes in the parameters were desired, they could be
made and the computation restarted; or the process could be
termi-nated if the desired information was revealed and a new one initiated,
The diversity of the algorithm library and the interactive nature of
the system made it a most powerful and flexible tool for revealing
CHAPTER III
LIGHT EVOKED RESPONSES
Introduction
Considerable attention has been devoted to light evoked be-haviors of arthropods [18, 36] and, in particular, insects [16, 24, 26, 49, 69]. These studies have helped to reveal the ability of the compound eye to utilize information in a light signal, but alone they have not elucidated the neural mechanisms responsible for vision. Numerous electrophysiological studies [ 4, 5, 32, 57, 7 3, 86] of single photoreceptor cells in the compound eyes of several insects have
established their transducing properties, and recently electrophysi-ological studies [6, 7, 32, 53, 76] of the discharge behavior of a wide range of interneurons in the optic lobe of several insects have re-vealed some of the information handling properties of the compound eye on the cellular level. The research described in this thesis was a continuation of these efforts to understand the cellular mech-anism of information processing in the compound eye of the fly. In particular, the study concentrated on the visual information pro-cessing properties of two second order units and their relationship to established neural structure.
description of the discharge properties of two second order units
recorded from the intermediate chiasma. The chapter concludes
with an account of the results of experiments aimed at locating the
origin of these discharges within the hierarchy of the visual nervous
system.
Anatomy and Electrophysiology of the First Optic Ganglion
The compound eyes of dipterans consist of a large number
of ommatidia (approximately 5500 in Calliphora erythrocephala),
each of which contains eight photoreceptor cells [50, 79]. The
axon of each photoreceptor cell passes through the basement
mem-brane and enters the first optic ganglion. Two axons from each
ommatidium corresponding to the superior and inferior central
photoreceptor cells by-pass the first optic ganglion without making
synaptic connections and terminate in the medulla or second optic
ganglion. The remaining six photoreceptor axons originating from
each ommatidium terminate in the first optic ganglion after
under-going a very specific geometrical transformation found only in the
compound eyes of dipterans which have unfus ed rhabdomeres [ 9,
75, 77]. Corresponding to each ommatidium in the retina, there
is a cartridge in the first optic ganglion, and the geometrical
trans-formation is such that each of the six photoreceptor axons from a
single ommatidium terminates in a different cartridge [ 9, 78] .
Studies [ 41, 86] have shown that due to the unfus ed rhabdomeric
cells, excluding the two central cells of each ommatidium, differ
by an amount determined by the optics of the dioptric apparatus
and the inter-rhabdomere spacing. In fact, the organization of the
geometrical transformation and the optics of the compound eye are
so specific that the axons of the six photoreceptor cells terminating
in each cartridge correspond to photoreceptor cells in different
ommatidia but which have coinciden~ optical axes as schematically
illustrated in figure 3. la.
Associated with each cartridge are six primary
photorecep-tor axons ( R
1_6), two second order type I monopolar cells (L1, L2},
two second order type II monopolar cells (L3' L
4), and two or more
11 centrifugal" fibers (a,
13).
The synaptology of the first opticganglion [75, 77, 80] has not been completely established, but it is
apparent that each of the two type I monopolar cells of each cartridge
makes synaptic contact with all six of the terminating photoreceptor
axons composing the crown of the cartridge. Furthermore, it is
likely that synaptic interaction exists between the two type I
mono-polar cells of each cartridge and possibly between the type I
monopolar cells of adjacent cartridges via the synaptic plexus.
For each cartridge two sets of" centrifugal" fibers make synaptic
contact with each of the six photoreceptor axons and the two giant
monopolar cells. Actually, the directionalities of these synaptic
contacts have not been adequately established, and the term"
cen-trifugal" fibers has been used because their cell bodies are more
a.
b.
Retina
1st Optic Ganglion
Intermediate Chiasma
B
A B
\ \
\ \
\
\
c
B
c
\
\
2nd Optic
Ganglion
~t-J,{?.~
Anterior Medial+ Lateral
Posterior
2nd Optic Ganglion
[image:45.626.127.552.66.618.2]11 centrifugal" fiber systems associated with different cartridges
are, in fact, independent or where the fibers originate. An
addi-tional complicating factor in the structure of the first optic ganglion
is the presence of epithelial glial cells which send capitate
projec-tion into small invaginaprojec-tions of the photoreceptor axon membranes,
thereby suggesting a function other than a merely nutritive or
sup-portive role. Very little is known a.bout type II monopolar cells
except that they appear to be second order neurons and to send
their axons around the cartridge rather than through it as the type
I monopolar cells.
The two axons of the type I monopolar cells of a cartridge
join the two by-pas sing long visual fibers and the two corresponding
type II monopolar cell axons and make their way to the second optic
ganglion where they terminate. The tract of fibers between the
first and second optic ganglia formed from similar sets of fibers
associated with each cartridge is called the intermediate chiasma.
This tract of fibers undergoes a geometrical transformation
illus-trated in figure 3. 1 b which sends fibers belonging to medially
located cartridges to posterior regions of the second optic ganglion
and fibers belonging to laterally located cartridges to anterior
regions of the second optic ganglion. This anatomical
transforma-tion represents a complete inversion along the medial-lateral axis
of the compound eye; however, there is no alteration of the proj
ec-tion pattern along the dorsal-ventral axis. Within the intermediate
small bundles corresponding to each cartridge. The highly
struc-tured organization of the first optic ganglion in terms of an array
of cartridges is preserved in the second optic ganglion in terms of
an array of columns. Each column receives its input in the form
of a bundle of fibers corresponding to a particular cartridge.
Anatomically, the first optic ganglion is highly organized
with enough complexity to conceivably support a considerable
amount of integration. However, previous attempts to study its
information processing properties through the observation of
dis-charge activity from units in the first optic ganglion failed [ 6, 31,
56, 72], although, two types of slow potential changes were
re-corded with micropipettes from the first optic ganglion and were
analyzed [56, 72, 74, 90]. In flies, positive slow potentials from
the first optic ganglion were reported which had a waveform in
response to a light pulse similar to that of the photoreceptor
mem-brane potential change. These positive slow potential changes
were believed to be of extracellular origin but closely related to
the neural mechanisms of integration in the first optic ganglion.
In fact, micro- spot stimulation experiments [72] indicated that
a potential change could only be elicited by stimulating one or more
of six ommatidia whose geometrical arrangement corresponded to
the anatomical transformation such that the axon of a photoreceptor
cell in each of the six effective ommatidia terminated in the same
change). In locusts, hyperpolarizing slow potential changes were
recorded [ 74] which appeared to be of intracellular origin. It was
reported that during the course of these slow potential experiments
in the fly not one indication of a spike-like potential change was
ob-served. This raises the serious question of how signals are
com-municated between the first and second optic ganglia (a distance of
approximately 200 microns).
Spike Discharges in the Intermediate Chiasma
The answer to the question of communication and to the
nature of neural integration occurring in the first optic ganglion
was approached by recording extracellular discharge potentials
from single fibers in the intermediate chiasma. Two classes of
units, based on their discharge behavior to light pulses, were
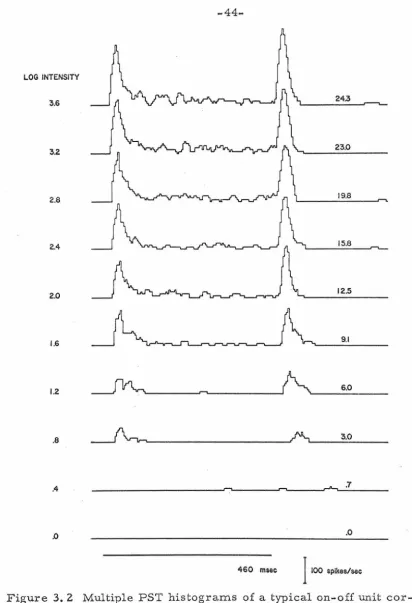
dis-covered. The average discharge pattern of a typical unit belonging
to the first class (designated the on-off class) is shown in figure 3. 2.
The stimulus was a set of ten • 5 second pulses of monochromatic
light (A
=
471 mµ) each differing in intensity by O. 4 log units. Thestimuli were delivered to the most sensitive part of the receptive
field by the direct stimulating apparatus. The PST' s were formed
from 6 trials like the one shown in figure 3. 3. It so happened that
two units (one belonging to each class) were recorded simultaneously
from the same electrode, however, only the TOE' s of the larger
on-off unit contributed to the PST histograms of figure 3. 2.
LOG INTENSITY
3.6 24.3
32 23.0
2.8 19.8
2.4 15.8
2.0 12.5
1.6 9.1
1.2 6.0
.a
.4 .7
.0
460 maec
I
100 spikes/secFigure 3. 2 Multiple PST histograms of a typical on-off unit
cor-responding to different intensity stimuli. Right hand
[image:49.623.145.557.64.667.2]Log Intensity
I"
"
I
I
I
1
1
~
~
I
3.6
1T+··1~l~lli
~1•111
1
I3.2
~
II
f
I
11I
~11
1~il!•l*11tl1
1~lill
1flllllllllill-I•
• I2.8
~I
•11•111~~ lllil~i~~lill~
11
I
I
1
IH
M·llf
HI
... II
2.4
~
f
1
11
1
='1111111
I1111111
11~111
Il
2.0
~H~m1 ~
1
111~1
11·
1
1
I d I1.6
Hfm1
11
~1
11H1
~'ill
1.2
~11111111111
1111 I111
\III
.8
1•1
l•I 1111Ii
II IllI
II
.4
111111I
I
IIi
.0
460 msec
Figure 3. 3 Typical discharge of both units to increasing stimulus
on-off discharge behavior for light stimuli having intensities within one log unit of threshold. At higher levels of light intensity the on discharge became more prolonged and lasted the length of the stimu-lus duration (460 msec). However, the on-off unit did not produce a maintained discharge to sufficiently intense stimulation, for steady light stimulation at intensity levels up to six log units above threshold was ineffective in eliciting a maintained discharge.
Higher levels of light intensity did not affect the~ and off discharge in the same fashion. More intense stimulation caused the
~discharge to reach higher instantaneous discharge rates and to exhibit activity over longer periods of time, never to reach sustained activity; whereas the off discharge responded to more intense
stimulation with greater instantaneous discharge rates but without any appreciable effect on the time course of the off discharge. This is in contradistinction to the nature of the off discharge from on-off units in some vertebrate retinas, where more intense stimulation causes successively longer delays and durations of the off discharge [63,64,65].
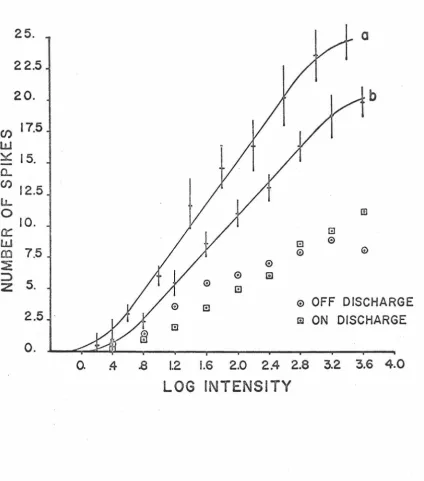
The dependence of the on-off unit response magnitude, defined as the total number of spikes elicited by a half second pulse of light, on the intensity of the stimulus is shown in figure 3. 4. Curves a and b were fitted to the data by hand and represent the response-log
25.
a
22.5
20.
b
CJ)
17.5
w
y:
15.
a_
CJ)
12.5
LL0
10.
m
a:
Gw
G 0co
7.5
© 0:-£
0::::>
0 Glz
5. 0[!)
El ©
OFF DISCHARGE
2.5
m
ON DISCHARGE
B
0.
o.
:4
.8
1.2
1.6
2.0
2.4
2.8
3.2
3.6
4.0
LOG
INTENSITY
[image:52.617.134.559.115.597.2]-the response-log intensity relationships of all on-off units studied
fell within the limits defined by curves a and b). The response
mag-nitude points represent means calculated from seven trials at each
stimulus intensity and are plotted with error intervals corresponding
to+ one standard deviation. The response-log intensity relationship
has a linear region corresponding to small stimulus intensities
followed by a log-linear region extended over approximately 2. 5 log
units of stimulus intensity and ending with a region of saturation
approximately 4 log units above threshold. Also shown in figure 3. 4
are typical data points corresponding to the magnitude of the~ ·
dis charge (defined as the number of spikes elicited during the
stimu-lus) and the off discharge (defined as the number of spikes elicited
after the cessation of the stimulus) as a function of the stimulus
intensity. The threshold response was generally found to be an on
discharge, but as the stimulus intensity was increased, the magnitude
of the off discharge increased more rapidly. However, the dynamic
range of the magnitude of the~ discharge was greater due, probably,
to the appearance of sustaining type discharge at higher intensity
levels.
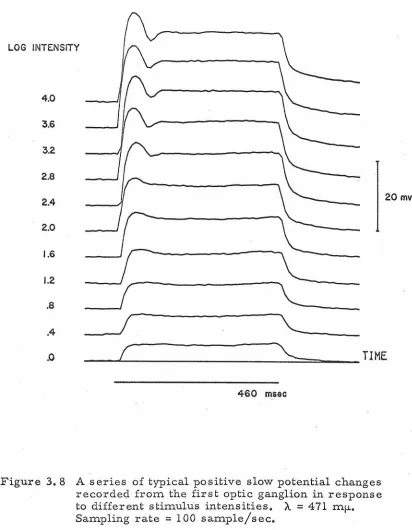
Units belonging to the second class were called on-maintained
units. The average discharge behavior of a typical unit
to
the samestimulus program as presented to the on-off unit is shown in figure
3. 5. In fact, the stimulus used to elicit discharge from the on-off
unit of figure 3. 2 was exactly the same as that used to elicit
LOG INTENSITY
3.6
32
2.8
2.4
2.0
1.6
1.2
.8
.4 10.8
.0 2.0
460 msec
I
100 spikes/secFigure 3. 5 Multiple PST histograms of a typical on-maintained unit corresponding to different stimulus intensities. Right hand column of figures denote the average number of
spikes /stimulus based on 6 trials. A
=
461 mf.L B. W.=
[image:54.615.133.556.66.637.2]recorded simultaneously. A sample stimulus trial is shown in figure
3. 3. The TOE' s representing the smaller on-maintained spike
potentials were obtained as described in the data analysis section
of Chapter II. The average discharge behavior of the on-maintained
unit differed considerably from that of the on-off unit. If the stimulus
was centrally located in the receptive field, then it elicited discharges
throughout the duration of the stimulus but "not" afterwards. In the
dark the unit was also quiescent, and for low stimulus intensities,
it had a large transient component and a smaller steady state
com-ponent. As the stimulus intensity increased, the instantaneous
dis charge rate of both components increased to saturation, however,
the steady state component seemed to be influenced more. In steady
illumination the on-maintained unit discharged continuously.
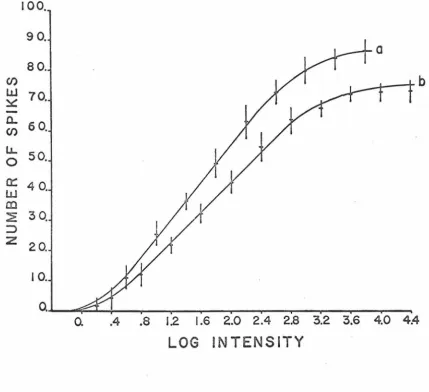
The dependency of the on-maintained unit response magnitude
on the intensity of stimulation is shown in figure 3. 6. Here, as
before, two units representing extreme cases were plotted. Although
the maximum response magnitude (number of spikes elicited) of the
on-maintained unit was approximately four times higher than that
of the on-off unit, the forms of their response-log intensity
relation-ship were similar.
There were other significant differences between the two
classes of units besides the form of their discharge behavior.
Fre-quently examples of both classes of units were recorded
simultan-eously with one microelectrode as shown in figure 3. 3. In all such
100.
90.
80.
en
b
w
70.~
Q..
60.
en
LL
50.
0
a::
4
o.
w
m
~
30.
:::>
z
20.
10.
0.
0.
.4
.8
1.2
1.6 2.02.4 2.8
3.2
3.6
4.0 4.4LOG
INTENSITY
Figure 3. 6 Typical response-log intensity characteristics of the on-maintained unit. The mean (and