Thesis by Andrew Dow Bacher
In Partial Fulfillment of the Requirements For the Degree of
Doctor of Philosophy
California Institute of Technology Pasadena, Califqrnia
1967
ACKNOWLEDGMENTS
It is a sincere pleasure for the author to acknowledge his gratitude to the faculty, staff and students of the Kellogg Radiation Laboratory, who have made this work a unique and fruitful experience. I am grateful to Professor William A. Fowler whose lectures aroused my curiosity about this reaction and who has given the work his
continued support and encouragement; to Professor W. Whaling who introduced me to experimental work in Kellogg; and to Professors
T. Lauritsen, C. A. Barnes and R. W. Kavanagh . for their suggestions and interest.
I am particularly indebted to Professor T. A. Tombrello, . both for his active participation and guidance in all phases of this
work and for the spirited and exciting qualities that have characterized this and our other mutual efforts.
The author is grateful to Mr. Robert J. Spiger for his assistance in many phases of the experimental work and for his
noteworthy :industry. In addition, I wish to thank M. R. Dwarakanath for his help with the experimental runs, Dr. P. D. Parker for his aid in the early phases of this project, Dr. P. A. Seeger and Mrs. Barbara Zimmerman for their assistance with computing techniques, and D. Papanastassiou, G. Godfrey, R. Moore and M. Cooper for their aid with data reduc.tion.
Last, but foremost, I am grateful to my wife, Fran, for her patience and confidence and to my parents who are a continual source of inspiration and encouragement.
ABSTRACT
Reactions produced by the He 3 bombardment of He 3 have been investigated for bombarding energies from 1 to 20 MeV using a tandem Van de Graaff accelerator. Proton spectra from the three-body reaction He3(He3, 2p)He4 have been measured with a counter telescope at 13 angles for 9 bombarding energies between 3 and 18 MeV. The results are compared with a model for the reaction which includes a strong p-He 4 final-state interaction. Alpha-particle spectra have been obtained at 12 and 18 MeV for forward angles with a magnetic spectrometer. These spectra indicate a strongly forward-peaked mechanism involving the 1
s
0 £1
p- p interaction in addition to the p-He~ interaction. Measurements of p-He 4 and p-p coincidence spectra at 10 MeV confirm these features of the reaction mechanism. Deuteron spectra from the
TABLE OF CONTENTS
PART TITLE
l INTRODUCTION
IL . EXPERIMENTAL APPARATUS
III.
IV.
A. He3 Beams
B. Gas Scattering Chamber 1. The Gas Target 2. Particle Detection
3. High Pressure Gas Cell
4~ Measurement of Absolute Cross Sections C. Gas Target for the 61-cm Magnetic Spectrometer PROTON SPECTRA
A. Experimental Procedure and Results B. Final-State Enhancements
C. Li5 Ground State Model 1. Spectrum Calculation
2. Comparison with Experimental Spectra 3. Angular Distributions
D. Cross Section Determinations 1. Li 5. Ground State Model
2. Integrated Charge 1 Measurements 3. Comparison of Cross Sections
MAGNETIC SPECTROMETER MEASUREMENTS A. Experimental Procedure
B. Alpha-Particle Spectra at 12 and 18 MeV C. Deuteron Spectra at 18 Me V
D. Triton Spectrum at 20 MeV
PART TITLE V. COlliCIDENCE MEASUREMENTS
A. Experimental Procedure
B. Summary of Results at 10 MeV VL LOW ENERGY ME.A.SUREMENTS
A. Experimental Procedure and Results B. Astrophysical Significance
VII. DISCUSSION OF RESULTS
APPENDIX A. SPECTRUM CALCULATIONS FOR MULTI-PARTICLE FlliAL STATES
PAGE 57 57 59 61. 61 63 66 71
1. Phase-Space Distributions 71
2. Spectrum of the Non-Interacting Particle 75 3. Recoil Breakup Spectrum in Sequential Reactions 78
REFERENCES 83
TABLES 87
L INTRODUCTION
The fact that particles in the final state of a nuclear
reaction may interact with one another to strongly modify the
observed spectra has been long established. Jn nuclear physics
this was first apparent in beta decay where the Coulomb interaction·
distorts the spectra of electrons and positrons from that expected
on the basis of simple phase-space arguments. More recently, it
has been recognized that the effects of strong final-state interactions
can be used to investigate certain aspects of the intermediate state.
As a result, the study of nuclear reactions leading to final states
consisting of more thaJ.1 two particles has attracted considerable interest (see, for example, the proceedings of the 1964 APS Topical
Conference on "Correlations of Particles Emitted in Nuclear
Reactions", Goodman, 1965). As a tool for nuclear spectroscopy,
reactions with more than two particles in the final state might be
used to study the production or decay properties of particle-unstable
nuclear states that are inaccessible to a two-body scattering
experi-ment. Alternatively, given quantitative information about the
two-body interactions that are present, this type of reaction might be
used to investigate a model for the reaction mechanism. Such a
model would be subject to direct experimental test through predictions
of the effects of these two- body interactions on the angle and energy distributions of particles in the final state.
The present work describes an investigation of the
multi-particle final states produced by the He 3 bombardment of He 3• Its
motivations have been twofold: to study the nature of the reaction
mechanism for a particularly simple final state over a wide range
reaction mechanism in determining the total reaction cross section. The existence of such a model would simplify measurements of the cross section at very low bombarding energies where its value is of considerable astrophysical importance.
Below a He3 bombarding energy of 20 MeV the following
final states become available.
Q-Value Threshold
Final State (MeV) (MeV)
4
+12. 860
He + 2p none
He3 + d + p - 5.49 10. 98
t + 3p - 6. 95 13. 90
3
He + n + 2p - 7.72 15.44
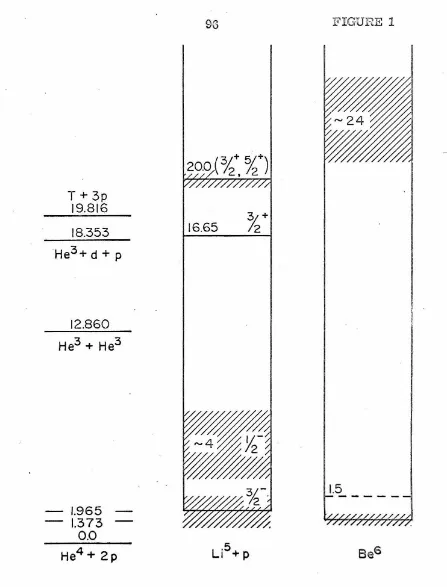
This information is summarized in Figure 1 where the relevant
structure in Li5 and in the compound nucleus Be6 is also indicated.
Below 11 MeV the reaction is characterized by a single reaction
channel leading to a final state of an alpha particle and two protons.
With the development of the tandem Van de Graaff accelerator it
has become possible to investigate the nature of this reaction
mechanism with high r·esolution over a wide range of bombarding
energies. This range covers the region with the single reaction channel and extends above it into an energy range in which new reaction channels open and additional two- particle interactions
are expected to become important.
At the opposite extreme of very low bombarding energies,
the total cross section for the He 3 (He 3, 2p) He 4 reaction is of
terminating the proton-proton chain in stars (C. C. Lauritsen-as quoted by Fowler, 1951 - and Schatzman, 1951). This reaction is the only practical way. to get to He 4 from pure H1 and in the presence of He 4 it competes with the reaction He3 (a., y)Be 7 in determining the path of completion for the p-p chain (Parker, 1963 and Parker et al., 1964). The value of the cross section at energies relevant in stellar interiors is important in determining energy
generation rates, in establishing the distribution of He 3 in a stellar
· model <md in determining the solar high energy neutrino flux. Previous work on the He3(He3, 2p)He4 reaction below 20 Me V was concerned with total cross section measurements between 100 keV and 800 keV (Good et al., 1954). Uncertainties in the extrapolation of these results to low energy (see Figure 49) led to the present interest in extending total cross section measurements to low bombarding energies. Concurrent with reports of the present work (Bacher, 1963, Tombrello and Bacher, 1965 and Bacher and Tombrello, 1965a) there have been observations of p-p and p-He4 coincidence spectra at 5 MeV (Aldridge et al., 1965) and 15 MeV (Zurmtlhle, 1965) and p-p coincidence spectra at 1 MeV and 5 MeV (Blackmore and Warren, 1966) which have indicated the presence of p- He 4 and p-p final state interactions.
The present work includes a systematic study of the nature of the reaction mechanism from below 1 Me V up to 20 Me V in an effort to obtain a more consistent picture of its dependence on the interactions of various pairs of particles in the final state. In Part II the experimental apparatus is described.
final-state interaction. Measurements of alpha-particle, deuteron and triton spectra at forward angles with a double-focusing magnetic
spectrometer are presented in Part IV. In Part V the results of
p-He 4 and p-p coincidence measurements at 10 MeV are given and
in Part VI measurements of the 90° energy spectra down to O. 28
Me V are described. A summary and discussion of these results is ·
II. EXPERIMENTAL APPARATUS
3
A. · He Beams
The He 3 beams used in the course of this investigation
·covered the energy range from 1 to 20 MeV and were obtained
from the ONR-CIT tandem Van de Graaff accelerator. Beams
with an energy up to 12 MeV were produced with the standard JN
injector system (Rose et al., 1961). Singly charged helium ions
are pre-accelerated to an energy of 500 to 900 keV, neutralized
on passing through a helium exchange canal, and then ionized at
the center of the high voltage terminal to produce singly and doubly
charged particle beams. The energy of the appropriate charge
state (singly charged for energies below 6 MeV) was determined by analysis with a 90° uniform field magnet. Analyzed He3 beam
currents varied from 1. 0 to 1. 5 µa for the singly charged beam
and from 0. 5 to 1. 0 µa for the doubly charged beam. Variations
in the beam current depended mainly on the ion source condition
and alignment, the accelerator vacuum conditions, and the
transmission characteristics of the accelerator for different
terminal voltages. The beam intensities measured in the gas
scattering chamber were considerably lower than the above figures
due to scattering of the beam by the thin entrance foil and the
severe beam collimation requirements for the gas target (see
Section B). Target beam currents varied from O. 06 µa at 3 MeV
to O. 16 µa at 12 MeV.
He 3 beams in the energy range from 12 to 20 Me V were
obtained by injecting into the tandem accelerator the low intensity
80-90 keV negative helium ion output of the duo-plasmatron negative
terminal where a substantial fraction of it is stripped of three
electrons, producing a doubly charged helium beam with an energy
corresponding to three times the potential difference between the
accelerator terminal and ground. Under normal operating
con-ditions a negative helium beam of O. 060 µa was injected. This
resulted in an analyzed beam of doubly charged helium varying
from a maximum of O. 025 µa at 12 MeV to a minimum of O. 008
µa at 18 MeV. Target beam currents for the experimental runs
were typically O. 004 to O. 008 µa. For the experimental runs µsing
the gas target in the 61-cm magnetic spectrometer these conditions
were somewhat improved. From an injected beam of O. 100 µa a
target beam current of O. 030 µa was obtained at a He3 beam energy
of 20 MeV.
B. Gas Scattering Chamber
1. The Gas Target
The problem of maintaining a gas target of accurately
known thickness that is accessible to a beam of well-defined energy
has yielded to several experimental approaches. In one, the beam is :iiltroduced into the target through a series of differentially
pumped apertures which bot? collimate the beam and maintain a
pressure gradient between the gas target and the high vacuum of
the beam pipe. Alternatively, the beam may enter the target
chamber through a thin foil which isolates the gas target from the
high vacuum region. The first method is inherently more precise
since the use of an entrance foil introduces energy straggling and
accurately compensated by an automatic pressure regulator, thus maintaining a constant target thickness. However, if the supply of target gas is limited, recirculation and purification techniques are required to minimize gas losses and c_:!ontamination. Practical considerations, such as the expense of high speed pumping facilities and the cost of an adeq1.iate supply of high purity target gas, often make the second approach of foil containment more attractive, particularly in a range of bombarding energies where the choice of a thin entrance window can reduce the effects of the foil on the beam.
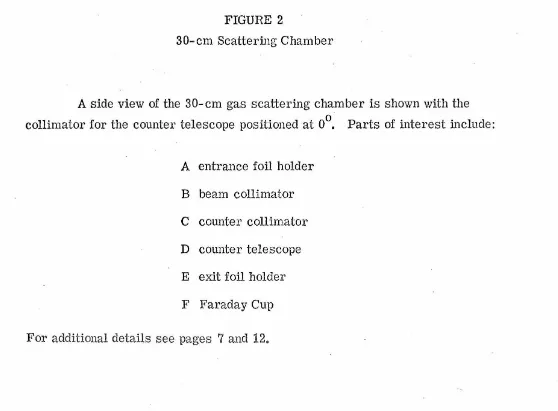
In the present work the high cost of He3 ($150/liter STP at the time of the experiment) and the availability of existing apparatus decided the issue in favor of foil containment. A majority of the experimental results was obtained using, as basic equipment, the 30-cm gas scattering chamber designed and constructed by.
Lionel Senhouse. This equipment has been described in detail elsewhere (Tombrello and Senhouse, 1963; Senhouse, 1964) and only the pertinent features of its operation will be reviewed.
Figure 2 shows the basic target configuration. The thin entrance foil is followed by a beam collimator consisting of two ·
on the maximum forward detector angle by the protrusion of the
collimator into the chamber.
Nickel foils (obtained comrp.ercially from Chromium
Corporation of America, Waterbury, C01mecticut) were employed
for both the entrance and exit windows of the gas target. The
entrance window consisted of a 1000-R nickel foil mounted with
epm •. 'Y cement over a smoothly beveled 1/8" diameter aperture
to allow the foil to deform slightly under the pressure of the target
gas. The exit window, 6250-R. in thickness, was mounted in a
similar fashion over a 1/2" diameter hole leading to the Faraday
cup. To assure a constant target pressure considerable care was
0
taken to select hole~free windows. The 6250-A nickel was supplied
in the form of self- supporting foils and hole-free regions could be
0
selected before mounting. The 1000-A foils, which were
electro-plated on a thin copper backing, . had to be mounted and the copper
etched off before inspection. The success rate of ,...., 5% for
hole-free foils appeared to be limited predominately by production
techniques of the manufacturer.
The He3 target gas (Mound Laboratory, Miamisburg, Ohio)
was supplied with an analyzed purity of 99. 36%. The principle
contaminant consisted of O. 43% He 4 with the remaining O. 21 % being divided approximately equally among hydrogen, water, and nitrogen.
The effect of these latter contaminants was held to a minimum with an activated charcoal trap that was cooled to liquid nitrogen
tempera-tures. The absolute gas pressure was measured with an oil
mano-meter that was connected between the target chamber and high
vacuum and was filled with n- butyl sebacate (density O. 927 ± O. 003 g/ml). Readings were made with
a
cathetometer to±p.
015 cm forthermometer.
To insure accurate beam collection the Faraday cup was provided with both electric and magnetic suppression of electrons produced by the beam at the collimating slits and the exit foil. A standard electrostatic suppression ring was held at - 200 V and a small annular permanent magnet provided magnetic suppression. The insulated cup was held slightly positive
(+67 1/2 V) to prevent loss of electrons produced on stopping the beam. The beam current was integrated with an Eldorado model CI-110 current integrator that was calibrated for each run with a precision current source. The overall accuracy of the beam integration was dependent mainly on the stability of the integrator electronics. Since the reproducibility in the calibrations was
better than O. 3%, a conservative error of O. 5% was assigned to
this measurement.
2. Particle Detection
In a gas target scattering and reactions occur at every
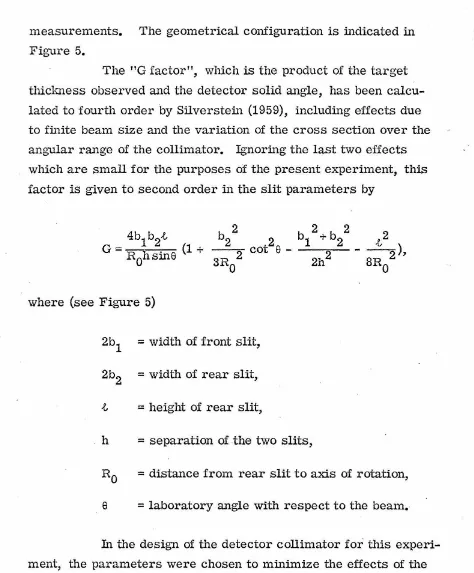
measurements. The geometrical configuration is indicated in Figure 5.
The "G factor", which is the product of the target thickness observed and the detector solid angle, has been calcu-lated to fourth order by Silverstein (1959), including effects due to finite beam size and the variation of the cross section over the angular range of the collimator. Ignoring the last two effects which are small for the purposes of the present experiment, this factor is given to second order in the slit parameters by
2 2 2
b2 2 bl + b2 -f.,2 _3_R_2,,,_ cot
e -
2 - - - 2 ) 'O 2h 8R0
where (see Figure 5)
2b
1 = width of front slit, 2b2 =width of rear slit,
.i = height of rear slit,
h
=
separation of the two slits,R0 = distance from rear slit to axis of rotation,
e
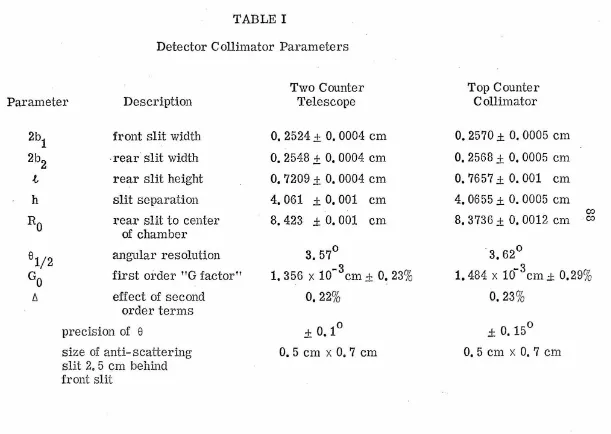
=laboratory angle with respect to the beam. [image:15.555.43.517.67.640.2]the widths of the front and rear slits were chosen to be nominally equal. The results of measurements of these parameters for
several collimators are presented in Table L They show that the
maximum correction due to the second order terms is less than the cumulative error in determining the first order value
The extreme angles seen when the detector is set at
an angle
e
are given bye :;: e
± tan-1 (2b/h) ,+
where 2b is the mean width of the front and. rear slits. For these
extreme angles the detector has zero detection efficiency. A more
convenient description is in terms of the beam length for various
reaction angles
e
(close to e) observed by the detector at a fixedangle
e.
This is a maximum fore
equal toe,
but its behavior forvalues differing from
e
is unsymmetric ife
is not 90° (see Figure5 b). This indicates how at forward angles the collimator geometry
tends to weight angles more forward than
e
slightly. This tendencyis exactly reversed for the backward angles. The full width at half
maximum gives a reasonable value for the angular resolution of the collimator and this is, typically,
e
112 :;: 2
A detailed view of the detector. collimator built for
use with the coW1ter telescope is shown in Figure 2, positioned
at
o
0• Because of the high energy of the protons produced in thisreaction (22 MeV at 20° for a bombarding energy of 12 MeV) slits
of O. 040" thick brass, capable of stopping 22 MeV protons, were
required to define the observed beam length. The vertical slits
were cut using a slitting saw with the brass blank positioned in a
dividing head. Following the first cut the piece was rotated by
180° and recut, giving an accurately centered slit of the desired
width. Steel inserts were ground to a thickness of O. 040" and
cut vii.th a slitting saw. The edges were then precision groW1d and
the horizonta+ slit was defined by press fitting these inserts into
. the vertical slit body, using a jig to determine the proper slit
spacing.
The slit dimensions were then accurately measured
with a traveling microscope. The slits were clamped in the
colli-mator body in the proper relative orientation and the collicolli-mator
was optically aligned with respect to its axis of rotation (the center
of the chamber) and the beam collimator. With these precautions
the detector angles could be determined reproducibly to an accuracy
of better than± O. 1°. The same techniques of fabrication and
alignment were used when a second collimator, attached to the
lucite center of the chamber top (see Figure 3), was added for
coincidence investigations. Both collimators had an angular
resolution (fwhm) of
e
112
=
3. 6° and could reach a forward angle of 12°. The large angular acceptance was dictated by the smallcross section of the He 3 (He 3, 2p) He 4 reaction and the low gas target
pressures required by the choice of a thin entrance foil. The
para-meters for these collimators and their associated errors are
The first attempts of this investigation were limited · by problems associated with the detection of protons with energies
in excess of 20 MeV. Since their range corresponds to about 3 mm in silicon, the possibility of using a standard surface-barrier counter was virtually eliminated. The first results were obtained with a
CsI(T-t.) crystal mounted on a phototube face and fixed at a laboratory angle of 90°. Later measurements used a 1 mm deep counter tilted to a 30° angle to double its thickness. By late 1963 lithium-drifted silicon detectors with depletion depths of 3 mm or more were available commercially (Technical Measurement Corporation, Mountain View, California). Concurrent with this development of thick solid state detectors was the gradual improvement in resolution and uniformity of very thin transmission detectors (< 50 µ). These counters could be employed for particle identification since particles that are not stopped in the counter produce a pulse roughly proportional to dE/dx for that particle.
For a large portion of the work the detectors in the
counter telescope were operated successfully in the He3 target
gas despite the rather substantial amount of ionization produced by the beam, particularly at low bombarding energies. Since the thick counter required a bias of 300 to 400 V to assure rapid charge collection of the electron-hole pairs, careful shielding of the counter lead was important to prevent breakdown in the gas. This was
eventually achieved by sealing the Microdot connectors with small 0-rings.
3. High Pressure Gas Cell
The portions of this investigation that required use of the negative helium beam or the detection of two of the three final-state particles in coincidence suffered from a sharp reduction in counting rate. This loss was partially balanced by confining the gas target to a small cell at the center of the chamber, in which considerably higher target pressures could be maintained. One of
these configurations is shown in Figure 3a. In this case slots 3/8"
. in height were cut in the cell wall as indicated. These openings
were covered with O. 1 mil (2. 26 mg/ cm 2) Ha var foil and were
positioned to allow the beam to pass through the cell and the reaction
particles to escape from it at the angles of interest. Part b of
Figure 3 shows the collimator that was positioned in the top of the
chamber to allow coincidence measurements to be made.
For the coincidence work and the proton spectra at 13. 81 and 15. 55 MeV the gas cell was operated at a nominal pressure of 1/2 atm, as indicated on a 4" Marshalltown gauge. This position
with a mercury manometer. For the proton spectra at 18 MeV the
target pressure was nominally 150 mm (1/5 atm) and was monitored
continuously by an aneroid gauge (\Vallace and Tiernan Inc.,
Belleville, New Jersey) with an accuracy of ± O. 5 mm. In all cases the entrance window in front of the beam collimator was removed
and the rest of the target chamber, including the detection apparatus,
was maintained at high vacuum.
Accurate integration of the small beam required
con-siderable care. For the proton spectra at 13. 81 and 15. 55 MeV
the Eldorado model CI-110 current integrator was employed. The
internal integrator leakage current which had been carefully
minimized, was recorded before and after each integration ( ... every
15 minutes). This leakage current for each run was than taken into
account in the calibration, giving an overall accuracy :iJl the beam
current integration of ± 1. 5%. For the angular distribution at 18 Me V a high precision current integrator, accurate to
±
O. 2% wasused. This equipment was based on that described by Rodgers (1963)
and was constructed for use with small beam currents by M.
Dwarakanath.
As a result of the high gas pressure and thick entrance
and exit windows, various effects which increase the experimental
uncertainty.of the measurements were enhanced. Corrections were
made for the distortion of the spectral shapes due to energy loss in
the foils and the gas, using the proton stopping cross section curves
of Whaling (1958) and Demirlioglu and Whaling (1962). The
scattering of the beam out of the Faraday cup aperture was small (see Section 4) but was corrected for by normalizing the yield of
elastically scattered He 3 's to more accurate measurements (Bacher
smaller cell were considerably enhanced but were confined to the
elastically scattered particles (Z
=
2) which could be separatedfrom the. proton spectra by particle identification with the counter
telescope.
4. Measurement of Absolute Cross Sections
As one aim of this investigation involves developing a
consistent method for determining the total. cross section for the
reaction He3(He3, 2p)He4, it is important to consider the magnitude of the systematic errors involved in the determination of the
experi-mental yield, prior to its interpretation in terms of any particular
model. For a gas target the yield for a particular particle in the
final state as a function of laboratory angle
e
and the particleenergy E is given by
where
=
the particle detection efficiency,Nb = the number of incident particles,
Nt
=
the number of target nuclei per cm 3,d2cr
( - - ) dEdO av = the differential cross section per unit energy
~
averaged over the energy and angular resolution
-tbO
=
the target thickness times the solid angle,and =the energy resolution of the multichannel analyzer.
The energy of the bombarding particles was determined
by analysis with a 34-inch radius 90° uniform field magnet, the
defining slits of which were placed at the conjugate focal points of
the magnet (Pearson, 1963). For this configuration the fractional
uncertainty in the beam energy is
which, with typical full slit widths
sl
ands2
ofo.
150", givesllE
E
= 0.44%The experimental uncertainty in the energy represents an
improve-ment over this limit for several reasons. The process of
max-imizing the beam current tends to select a particular reproducible
path through the analyzing magnet. In addition, under normal
operating conditions the beam profile is such that a large fraction of the beam is confined to a width considerably less than that of the
defining slits. The energy quoted for each measurement refers to
the beam energy at the center .of the gas target after correcting for
energy loss in the entrance foil and the target gas. For all of the
angular distributions the uncertainty in this quantity is better than
error in the thickness of the nickel foils of ± 20% (Parker, 1963
and direct measurements of foil thicknesses).
For a solid state detector the efficiency is usually taken
to be w1ity. This continues to hold for a counter telescope, provided
the active areas Of the COW1ters are defined SO that particles
multiply - scattered on passing through the front counter are stopped in an active region of the rear counter. The importance of
geometrical factors for a gas target has been emphasized in a previous section and the results of measuremei1ts are presented
. in Table L The cumulative error in G is O. 23%. Angle-dependent
effects which have not been included are the second order corrections
-to G (maximum error O. 22%) and the W1certainty of + O. 1° in the
laboratory angle (the maximum error in sine is O. 7% at 15°).
Corrections arising from the finite size of the beam and the variation of the cross section with angle can each produce a maximum error
of only O. 05%.
The errors associated with beam collection, integration,
and the determination of the number of incident particles have been
discussed previously and range from a typical value of O. 5% to 1. 5%
for some of the results obtained with the negative helium beam. In
several instances the accuracy of the beam integration was verified with a fixed monitor counter determining the number of elastically
scattered He 3 particles. The results at low bombarding energies
3
were corrected for the equilibrium fraction of singly charged He in the integrated beam current.
The determination of the number of target nuclei per cubic centimeter depends on measurements of the gas target
pressure and temperature. In those cases where a charcoal trap
contaminants, a correction amounting to about 1
%
was made to allow for a gradual pressure change due to the slight adsorption of helium by the cooled charcoal. The temperature of the gas was measured by assuming it to be in equilibrium with the targetchamber. Effects due to localized heating of the gas by the beam
(Robertson et al., 1961) are expected to be small for such low .
beam currents in the target.
The chance that a sig11ificant amount of the He 3 beam
might be scattered out of the angular aperture of the Faraday cup
(± 2°) by the target gas is small as may be seen from· the
root-meari-square scattering angle for a typical target pressure;
( e
2 3 )1/ 2 = O. 9°/E3 (MeV) •
He He
In addition, any effects due to multiple scattering of the beam at
the forward angles are expected to be small even in the high pressure gas cells because of the small cross section for the reaction. Scattering of the reaction products on passing out of
these cells is also small. For the O. 1 mil Havar foil the rms
scattering angle is given by
<
e~
>
11
2 = 5. 2°/Ep (MeV) for protonsand
( e
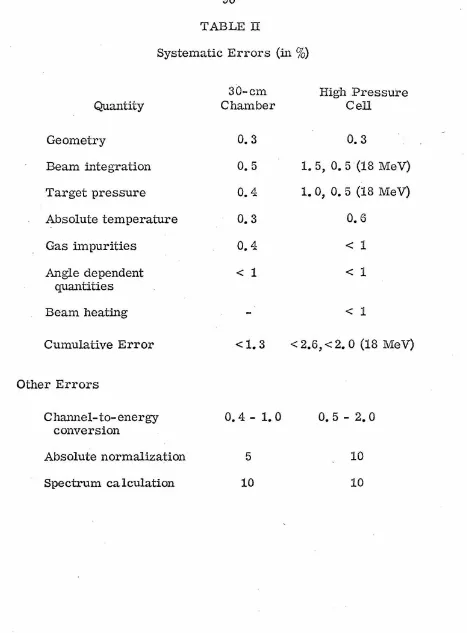
2 >1/ 2 = 10. 5° /E (MeV)while. the angular resolution of the detector collimators was ± 1. 8°. A summary of the systematic errors is presented in Table IL
C. Gas Target for the 61-cm Magnetic Spectrometer
In order to investigate in detail the spectral shape of alpha_ particles from the He3 (He3, 2p)He 4 reaction, as well as deuterons and tritons from final states available at the higher He3 bombarding energies, a gas target (designed by T. A. Tombrello) was positioned in the target chamber of the 61-cm magnetic spectrometer. A side view of this apparatus is presented in Figure 4. The target gas is contained in a 3 1/2" diameter brass can that is centered in the spectrometer target chamber with a lucite top. On rotation, this chamber remains fixed with respect to the spectrometer.
A 1/4" slot, cut through an angular range of 160° and covered with a O. 1 mil Havar foil, serves as an entrance window for the beam. The exit window leading to the spectrometer is
provided by a 1/2" diameter hole which centers a small collimator with a 1/16" vertical front slit. This hole is sealed with a foil
holder which also serves as an anti-scattering slit. The exit window 0
normally consisted of a 10, 000-A nickel foil. The rear slits of this collimator are defined by the variable entrance slits of the spectro-meter, located 14. 5" from the center of the target chamber. The proper alignment of the gas chamber with respect to the spectrometer was established optically prior to each experimental run. With the magnet set at 90°, an optical axis was defined by the beam entrance hole and the center of the 90° port in the spectrometer target
. reproducible to ± O. 1°, the precision with which the spectrometer
angle can be set.
The lucite top of the gas cell contained connections to a
cold trap for the target gas and a gas manifold with provision for
several target gases. Contaminants in the gas (with the exception
of O. 43% He 4) were held to a minimum with an activated charcoal
cold trap maintained at liquid nitrogen temperatures. The target
pressure, as read on a 2" Marshalltown gauge, was nominally
1/5 atm and could be held constant to better than + 3% by frequent
filling of the cold trap dewar. Integration of the beam current was
provided by stopping the beam in the insulated gas cell (held at
+300 V) and integrating the resulting current with the Eldorado
current integrator. While only a relative consistency between
points in the spectrometer scan was required to study the shapes
of the alpha particle spectra, an absolute scale (good to '"" 20%)
was provided for the measurements at 12 MeV by scanning the
elastic He3 peak at 15° under similar conditions and normalizing
the results to the known elastic cross sections (Tombrello and
Bacher, 1963).
The alpha partiCles were detected with the 16- counter
array of surface- barrier detectors positioned along the focal plane
of the spectrometer, and their energy was determined by field
measurements with a nuclear magnetic resonance probe. ..Alpha particles were separated from protons of the same energy over
the range 7 to 20 Me V by varying the counter bias so that the protons
were never fully stopped in the active volume of the counter. The
counts from each detector were corrected for their different
effective solid angles with correction factors determined by
across a thick target yield spectrum (Cocke, 1965). A limit was placed on the variation of these factors due to the extended nature of the source in a gas target. With the magnet at a fixed frequency, the width of the entrance slit of the magnet (and hence the length of target seen in the gas cell) was varied by a factor of 4. The number of counts observed in each counter scaled appropriately within the statistical errors ( ~ 5%). Measurements were made with the center detector of the counter array for magnetic field settings
Ill PROTON SPECTRA
A. · Experimental Procedure and Results
The present section describes single- counter
measure-. 3 .
ments of proton spectra resulting from the He bombardment of L
3
He over a:n energy range from 3 to 18 MeV. The measurements were made with a solid- state counter telescope positioned in a 30-cm diameter gas scattering chamber (see Part II, Band Figure 2) and are in the form of angular distributions at thirteen laboratory angles from 15° to 160° for nine bombarding energies.
The counter telescope consisted of a 48µ surface-barrier
t.E counter and either a 3 mm or 5 mm deep lithium-drifted E counter. A block diagram of the electronics is given in Figure 6a. The pulses from each detector were fed into a low-no:lse, charge-integrating preamp (Tennelec Model lOOA), summed to form a pulse proportional to (E + ~E) and fed into one of two 200- channel sections · of a RIDL 400-channel analyzer. The routing of the analyzer was
determined by the size of the pulse in the b.E counter. All pulses corresponding to an energy greater than ,..._, 2 MeV (the thickness of the t.E detector to protons) were routed into a "charge 2" spectrum. All pulses below the 2 MeV level which fired a lower level discrimi-nator (set close to the noise level in the t.E counter) were stored in the "charge 1" spectrum. This latter condition satisfied the logic requirements of the analyzer and also allowed one to eliminate some of the neutron background produced at the higher bombarding energies by (n, a.) and (n, p) nuclear reactions in the active volume of the E
For each experimental run the gains of the ~E and E
pre-amps were balanced to O. 5% using a high energy proton group from
the reaction D(He3, p)He 4 (Q"" +18. 354 MeV). The
channel-to-energy conversion of the analyzer was determined by using the
angular variation of the energies of both charge 1 and charge 2
particles from the same reaction. The energy calibration of the
charge 1 portion of the analyzer is shown in Figure 7 for the
experi-mental run at 9. 94 MeV. For proton energies above 14 MeV the
response of the detector was found to be non-linear. This necessitated
fitting the energy-channel curve in several regions in order to handle
the departure from a linear response function.
As described in Part II, B. 4 only a few additional quantities
were required in order to relate the yield at each angle to a
differ-ential cross section. The target pressure and temperature were
monitored hourly and the current integrator was calibrated several
times for each running day. Corrections made at the extreme forward
angles for the analyzer dead time were always less than 20%. The
absolute normalization at each energy was verified by comparing the
He3 + He3 elastic cross section at eL"" 30° to more accurate
measure-ments (Tombrello and Bacher, 1963 and Bacher and Tombrello, 1965). Several of the high energy points were corrected by~ 10% on this
basis.
Angular distributions of separated charge 1 particle spectra
were obtained at 2. 81, 4. 35, 5. 92, 7. 95, 9. 94, 11. 93, 13. 81, 15. 55
and 18. 01 MeV. As indicated in the Introduction, below 10. 98 MeV
protons are the only charge 1 particles available in the final statee Above this energy the reaction He3 (He3, d)pHe3 becomes energetically
allowed and it is possible to observe deuterons in the charge 1
t)3 p reaction but their presence in these spectra can be ignored
since the cross section for their production is down by at least
an order of magnitude from that for the production of deuterons
(see Part IV, D).
Figure 8 shows a sequence of the charge 1 energy spectra
at a laboratory angle of 20° for five of the bombarding energies.
The spectra have been unfolded from smooth curves drawn through
the original measurements in order to illustrate· how the reaction
mechanism develops over a wide range of bombarding energy. At
low bombarding energies the spectrum shape is characterized by
a peak at the high energy end which represents the remaining (p + He4)
system being left at an excitation corresponding to the Li5 ground
state. The dashed line under this peak traces the position of the Li5
ground state peak in the spectra shown for the higher bombarding
energies. The height of the ground state peak gives a rough indication
of how the cross section for the Li 5 reaction mode increases with
increasing energy. The dashed lines spanning a region in the spectra
at lower particle energies indicate the range of energies expected for
protons from the breakup in flight of the recoiling Li5's. It is
apparent that above the threshold for the formation of deuterons,
additional structure is present in the lower energy region of the
spectra, implying that other processes are beginning to contribute
substantially to the reaction mechanism.
Samples of the actual spectra can be seen for the
measure-ments at 2. 81 MeV in Figure 16 and at 18. 01 MeV in Figure 17.
The behavior of the proton spectra at 7. 95 MeV as a function of angle
is indicated in Figures 12 - 15 for angles from 20° to 140° in 20°
steps. In these cases the actual spectra are shown and an energy
corre-sponding to the minimum separation energy of the counter telescope is indicated in each case by an arrow near an energy of 2 MeV.
B. Final-State Enhancements
The prominence of the Li 5 ground state group in the observed proton spectra leads one to investigate models for the reaction mechanism which include the presence of a single strong interaction between a pair of particles in the final state. In these models the first particle (in our case, a proton) is assumed to experience no interaction with the strongly interacting pair (the recoiling Li.5). This is equivalent to a factorization of the wave function into two parts; one depending on the coordinates of the first particle and the other depending separately on the motion of the center-of- mass and on the relative coordinates of the interacting pair. The phase-space energy distribution that arises from the assumption of a constant matrix element for the transition from the initial to the final state can be expressed in this factored form as;
The particles in the reaction are labeled by the convention
1 + 2 - 3 + 4 + 5 '
k
3 is the wave number of particle 3 and k45 is the wave number
As was pointed out by Fermi (1951) the appropriate
enhancement factor is just the modulus squared of the wave function for the interacting pair evaluated at the limit of small spatial
separation. (For further discussion of this and succeeding points see Gillespie, 1964). In certain instances (i.e., short-range, attractive interactions) this may be approximated by the scattering cross section for the interacting pair as indicated by Watson (1952) and Migdal (1955). We have
2
o~
~n
ex; k3 • k45 •I
cp(k45' r)12 '
(Fermi)3 3 r=O
and
(Watson-Migdal)
In the Watson-Migdal form the scattering cross section may be represented by an effective-range parametrization (see Appendix A, 2) or it may be attributed to the variation of the phase shift for a
. particular orbital angular momentum ,e, and total angular momentum
. 2 13j ,..., Sll1 ,e,
o: k3 • Penetration Factor
(r./2)2 J
(R-matrix)
2
2 '
(E. + D.. - E45) + (r./2) J J . J
where
13~
=
o~
+ cp,e, is the resonant phase shift, the penetration.
I
2 2_ 2 2factor is p 45 A,e, , A,e, - F .e, + G .e, , F ,e, and G ,e, are the regular and irregular Coulomb functions evaluated at (k
45R), 'tl,e,
=
tan-l (F.e,/G.e,), r/2=
Yj2p45/A,e, 2
, Ej is the characteristic energy of the level, D.. is the level shift, y. 2 is the reduced width
J J
and R is the radius. The factor k45 has been absorbed into the
second term.
The enhancement factor described by Fermi (1951) can
be shown to be equivalent to the spectral measure function,
1/ If
1
(k)] 2, that arises from an S- matrix treatment of the scattering· formalism (Gel'fand and Levitan, 1951 and Newton, 1960). The Jost function, f
1
(k), can be described either in terms of thescattering phase shift or in terms of the potential producing the.
interaction. Jn terms of the scattering phase shift for a particular partial wave, we have
I
oo+ie: j ( ) ]j 2 xo,e,xdx
f ,e, (k) = exp ;;:
J
2 2 '. x - k o+1e:
composed of both nuclear .and Coulomb terms and k
=
k 45• Treating these Coulomb terms explicitly (Tombrello, 1964 and 1965) one obtains for the spectral measure function,,e, 2
[ 2rrri ] II (l+ 11 ) 1
exp(2rr11)-l • t=l ~ • j 2 '
I
f,e, nucI
'
. 2
- W(k, '11, .t)/
I
ft nucI '
'
where '11
=
µ45 Z 4 Z 5 e 2
/ti
2k and the latter equation is used to define the function W(k, 11, ,e,) containing the Coulomb effects. The spectral measure function prediction (hereafter abbreviated .sMF) for the enhancement is given by,
, (SMF)
where
. I
2 co+ie xo~
(x) dx]fJ = ex -
J
-v,
nuc,e,, nuc p TI • 2 k2 •
-By analogy with the form of the Coulomb factor W(k,T),t),
one can also generalize the above to include effects due to the
Coulomb interaction of particle 3 with the strongly interacting ( 4- 5)
system (Tombrello and Bacher, 1965). With this inclusion we have
where
'k
3, T]3 and
.e.
3 are defined for the relative motion of particle 3 with respect to the (4-5) system.Determination of the Jost function,
f~
(k), is possible ""',nuconly for a ·few two-particle systems where a phase shift analysis of scattering measurements is available over a wide range of
born barding energies. In spite of this limitation, the advantage of
the SMF formalism over the R-matrix single-level description is
that it approaches the appropriate Coulomb-modified phase space
expressions in the limit of no nuclear .interaction, whereas the
R-matrix expression approaches zero in the limit that
~l
becomessmall.
C. Li5 Ground State Model
1. Spectrum Calculation
In the present model the energy-spectra of protons from
the reaction He 3 (He3, 2p)He 4 are calculated assuming that the first
proton leaves a recoiling (p + He 4) system with which it has had no
interaction (other than Coulomb). -Predictions of the spectrum
populations of the various excitations in the (p + He 4) system. These
have been determined for both the R-matrix and the SMF formalisms
described in the previous section. Figure 9 shows the behavior of
these two density functions as a function of the excitation in the
(p + He 4) system. The R- matrix curve has been calculated from - 5
parameters for the 3/2 Li ground state,
2
E
312_ :;: 4. 79 MeV,
v
312_ :;: 8. 23 MeV and R:;: 3. 0 fm~,which were obtained from a single-level fit to the results of a phase
shift analysis of the scattering of protons from He 4 (Barnard et al. ,
3/2
-1964). The o1 phase shift from the same analysis was used to
evaluate the SMF curve. The two density functions are similar in
the region close to the Li5 ground state, but at higher excitations
in the (p + He 4) system the SMF curve remains considerably above
that obtained from the R- matrix expression.
From a knowledge of the density function it is a
straight-forward procedure to calculate a spectrum shape for the first proton.
For computational purposes it is convenient to first determine the
energy spectrum in the center-of-mass system where it is independent
of angle.
1{ •
3
The ,...., sign refers to quantities in the center-of-mass system (of
3-45 in this case), Wis the modification to include Coulomb effects
kind. The spectrum shape is transformed to the corresponding
shape at a fixed laboratory angle by using the relativistic invariant
(Williams, 1961)
The result is a spectrum prediction for the shape of the
high energy proton peak that can be used to extract cross sections
for the Li5 ground state mechanism (Bacher, 1963 and Bacher and
Tombrello, 1965a). However, in order to allow comparisons to be
made with the shape of the entire spectrum, it is useful to push the
model to its logical extremes and also use it to predict the spectrum
shape of the low energy protons that results from the decay in flight
of the recoiling. Li5. This is a slightly more cumbersome calculation
in that it requires taking into account contributions from a wide range
of center-of-mass angles at each excitation in the Li5 system. The
spectrum calculation must also proceed in an iterative fashion (which
converges rapidly) since the recoil contribution depends not only on
the angular orientation of the Li 5 breakup but also on the angular
distribution of the first st age yielding the high energy proton. (See
Appendix A. 3 for a more detailed account of the recoil spectrum
calculation. )
The problem of combining these two spectra has been
treated here in the classical approximation by directly adding the
two calculated shapes to obtain the total spectrum. In the proper
quantum mechanical treatment the fact that the two spectra represent
identical particles would have to be included and allowance would
The total spectrum is modified by folding various
resolution functions into it to allow a direct comparison with the
data. A triangular resolution function with fwhm = 3. 6° was
used to include the effect on the energy spectrum of the angular
resolution of the detector system (see Figure 5). To relate this
68 to an energy uncertainty 6E
=
(oE/o8)t.8, the value of (oE/08)at the center of the high energy proton peak was used. The value
of (oE/o 8) did not change rapidly over the region of this peak and
this same value of (aE/o 8) was found to adequately represent the
shift with angle of the leading edge of the low energy recoil spectrum.
The resolution of the counter telescope was folded into the spectrum
as a Gaussian shape with a width determined from the peaks observed
in the energy calibration of the analyzer. For the forward angle
spectra at bombarding energies above 10 MeV, it was necessary to
allow for a poorer resolution of the detectors for high energy protons
(EP > 20 MeV). In converting the predicted shapes to the
analyzer-channel scale it was necessary to allow for a compression of the
spectrum due to the non-linear response of the detectors to high
energy particles (see Figure 7).
The final result is a prediction of the spectrum shape, including all of the experimental uncertainties, that can be compared
directly to the observed spectra.
2. Comparison with Experimental Spectra
In Figure 10 the results of calculations using several
different density functions are compared with the spectrum measured
at a He3 bombarding energy of 7. 95 MeV and a laboratory angle of
SMF density function and including an -e,
3
=
1 Coulomb interactionfor the first proton is compared with the observed spectrum. The
dashed lines indicate the portions of the total spectrum that are
due to the high energy proton leaving Li5 and to the breakup of the
recoiling Li5. For the recoil spectrum the angular distribution
of the first stage has been included (see the next section), but the
breakup of the Li5 has been taken to be isotropic.
In the bottom half of Figure 10 the predicted shapes for
several different density functions are compared. Curve A (solid
line). repeats the SMF prediction with -e,
3 = 1 that was indicated in
the upper figure. Curve B shows the spectrum obtained from the
R-matrix density function with no Coulomb interaction for the first
proton. This agrees closely with Curve A, but it should be noted
that the corresponding R-matrix curve with -e,
3 = 1 would fall
considerably below Curve A. Curve C indicates the shape expected
for a contribution from the first excited state of Li5 (JTT = 1/2-) as
determined from the R-matrix density function with no Coulomb
interaction for the first proton. The fact that this does not differ
substantially from the shape of the phase space prediction given by
Curve D is not surprising, considering the """ 4 MeV width of the
broad first excited state (see Figure 1).
It is clear that the inclusion of the recoil spectrum in the
calculation allows us to make more reasonable comparisons between
the predicted shapes and the observed spectra. The comparisons of
Figure 10 are representative of the relative sizes of the predicted
shapes, independent of energy and angle. Since -e,
3 = 1 is the
out-going orbital angular momentum that would be required for the first
proton by ans-wave interaction in the incoming channel (He3 + He3),
interaction of the first proton would be screened, it seems
reasonable to use the SMF weighting with .i
3 = 1 for the further comparisons of the predicted shapes with the observations. It is worth noting, however, that the cross sections derived from SMF (t
3 = 1) and R-matrix (no interaction) agree to within 3%
for the fits at 7. 95 MeV, while the difference between SMF (t
3 = 1) and S:MF (no interaction)is about 25%.
Figure 11 indicates for the case of 9. 94 MeV and 20° the technique used to normalize the predicted spectrum to the
experi-mental one and thereby extract a cross section for the Li5 ground
state transition. Taking the peak position at XP, the normalization of the predicted spectrum was determined by matching the area under the curve above X A (a point ,...., 2/3 down from the peak height) to the number of counts observed in the corresponding region of the experimental spectrum. A "best fit" to the experimental spectrum was then obtained by varying the peak position XP slightly (,..._, + O. 5 channels) and determining the value of XP which minimized the
mean- square deviation of the two curves~
b. 2 (X ) = _!
. P n
Here,
N~xp
andN~h
(Xp) are the experimental and theoretical curves,l l
In this manner a consistent set of fitted spectra was
obtained for the angular distributions at each of the nine bombarding
energies. Our attention can now be turned to the quality of the fits
and to the angular and energy dependence of the yield obtained for
the Li 5 ground state transition.
The most stringent test of the Li 5 ground state model for
-the reaction mechanism is to look at -the quality of -the fits as a
function of angle for a fixed bombarding energy, particularly in the
region away from the high energy peak. Figures 12 - 15 give this
comparison at angles in 20° steps from 20° to 160° for the
measure-ments at a bombarding energy of 7. 95 MeV (below the threshold for
the formation of deuterons). The calculated spectra all include an
angular distribution for the first proton of (1 - O. 24 cos2
8),
theaverage of the measurements below 10 MeV (see Table ill). Two
fitted curves are shown for each angle. The solid curve assumes
that the recoiling Li5 breaks up isotropically in its own
center-of-mass system and the dashed curve indicates the effect of an oriented
breakup (1 - O. 875 coseR) for the protons with respect to the recoil
direction. This latter distribution is suggested by the shape of the
alpha-particle spectrum for forward angles at 12 MeV (see Part IV,
B and Figures 37 and 38). While it is expected to be good for the far
forward angles, the correct orientation appears to diminish rapidly
with increasing angle. ·The same form is included in the present
curves only to indicate the sensitivity of the spectrum calculation
to this parameter at the backward angles.
The inclusion of the oriented breakup improves the
agree-ment with the observed shape at the forward angles and gives a more
reasonable description of the number of counts in the low energy
the fit at 20°, 60° and 80°, but not do as well at 40° (see Figures 12 and 13). For the spectra at angles greater than 80° (see Figures 14 and 15) the rapid rise in the spectrum near the arrow (which represents the separation threshold of the counter telescope) is suggestive of a background contribution from neutrons. This eliminates the lower energy region for the purpose of these com-parisons. For the spectra at 140° and 160° (see Figure 15) there appears to be a significant number of excess counts in addition to this background component. From the alpha-particle measurements described in Part IV, B one discovers that there is a sharply forward-peaked component of the reaction mechanism that involves the 1
s
0 p-p interaction. The forward alpha-particle angles for this mechanism at 7. 95 MeV produce protons in the energy range 1 - 5 MeV for the spectra at 140° and 160°. It would appear L~at the inclusion of this effect would remove some of the discrepancy in the number of counts
0
observed at the extreme backward angles. In the spectrum at 20 (see Figure 12), protons from the P-:P mechanism would be spread over the energy range from 6. 6 - 12. 8 MeV and would be due to
alpha particles with a laboratory angle of 120° (,.__, 160° in the He 4+ (2p) center-of-mass system).
In Figure 16 the observed spectra and similar calculated shapes are shown for 40° and 90° at a bombarding energy of 2. 81 MeV. The nature of these fits is quite similar to those at 7. 95 MeV, with the exception that a slight excess appears in the middle region of the spectrum for the lower bombarding energy (see Part VI for further details). In the 40° curve at each of these bombarding
The spectrum at 20° for 18. 01 MeV (see Figure 17) shows
how the complexity of this reaction increases as additional channels
open. For the Li5 mode, the angular distribution of the first stage is now given by (1 + O. 5 cos2e) and the two curves shown are for an isotropic breakup of the Li 5 (solid line) and an oriented breakup
(dashed line) given by (1 - O. 5 coseR). The e::ll..1:reme non-linearity
-of the detector response has greatly accentuated the height of the
high energy proton group relative to the contribution from the recoil
breakup. This low energy component is buried by additional peaks
which can be seen in Figure 8 to dominate the low energy portion of the forward angle spectra for bombarding energies above 12 MeV. The windows shown indicate possible explanations for these
prominent features.
The higher energy peak appears to be due to protons from
the He 4 + (2p) mode with the associated alpha particle at a laboratory
angle of 90°. The fact that this corresponds to a center-of-mass angle of ,..., 160° helps to explain the large size of the peak, since this
process is known to be strongly forward-peaked and the presence of
identical particles in the initial state requires symmetry about
8
= 90° (assuming no cp-dependence). It is not understood why thismechanism becomes so much more prominent at the higher
bom-barding energies, although it does appear to occur in a region of the
6
compound nucleus, Be , where strong ,e, = 3 effects are observed
in the elastic scattering (see Figure 1).
The lower peak appears to arise from protons produced
in the mechanism d + (p - He3). Obser;ations of the deuteron
spectrum at forward angles (see Part IV, C and Figure 41) indicate
a peak at a p - He3 relative energy between 1 and 2 MeV. The
so it is quite likely that this lower peak consists of both protons
and deuterons. This would help somewhat to explain its width.
3. Angular Distributions
As a result of the decision to keep the observed spectra
intact and to fit the calculated shapes in the laboratory system,
differential cross sections for the Li5 grow1d state transition were
extracted from the fitted spectra at each laboratory angle, as
described in the previous section (see Figure 11). This yields
values of
E
3, Max
02
=
I
(
0 E~
0 ) dE 33 3
0
as a function of the laboratory angle. Figure 18 gives a comparison
of the laboratory angular distributions obtained from the
measure-ments below 8 MeV. Over this region the cross section is increasing
rapidly and the peaking at forward angles is primarily due to the
increased center- of- mass motion. The cross sections in the
laboratory system were transformed to the center-of-mass system
by assuming a two- body.transformation
d . 2 (,..._, )
= (
~)
sille
cose - e
do . 2,.._,
This approximation is reasonable in the present case since at a
given laboratory angle
e,
the corresponding center-of-mass anglee
changes by an amount less than the angular resolution of the detectors down to a very low energy in the calculated high energy· proton curve.
The angular distributions obtained from the Li 5 ground
state model are presented in Figures 19 - 22. Solid dots represent
the laboratory cross sections and open circles give the center-
of-mass cross sections at the corresponding center-of-of-mass angle.
The center-of-mass angular distributions appear to be roughly
symmetric about
e
=
90°, although the points at the forward angles appear to be somewhat higher than those at the relevant backwardangles. This may be :indicative of an additional mechanism
inter-fering with the fitting procedure at the forward angles, but it should
also be remembered that strict symmetry about
e
=
90° is required only if the reaction mechanism has no cp-dependence.The solid curves indicated on Figures 19 - 21 for the
bombarding energies below 12 MeV represent a least-squares fitting
of the function a0 + a2P2(cose) to the center-of-mass results for
8
~ 90° (to avoid the problems at forward angles). It is clear that at the higher energies higher powers of cos28
are required to fitthe observed distributions, but there are not enough points at the
backward angles to make such a fit meaningful. The shape of these
distributions changes at the higher bombarding energies as one approaches. the region in Be 6 where a broad anomaly is observed
in the elastic scattering channel (Bacher and Tombrello, 1965).
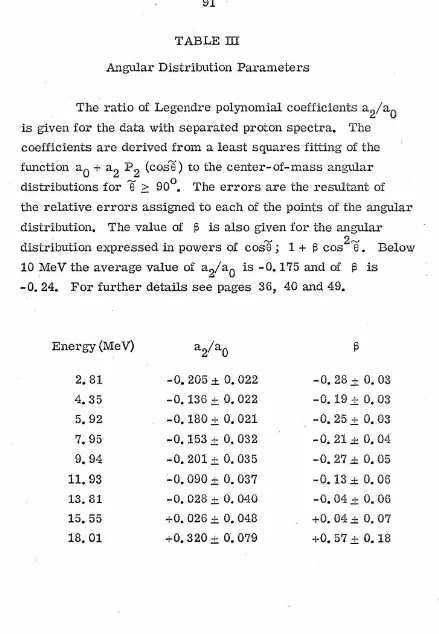
The parameters a2/a0 from these fits are given in Table III and
the energy dependence of this ratio is indicate.ct in Figure 23. Below 10 MeV the values of a
average value (a2/ao) = -0. 175. In terms of powers of cose this
corresponds to a distribution (1 - O. 24 cos2e ).
D. Cross Section Determinations
. 5
1. Li Ground State Model
Cross sections for that portion of the reaction which
proceeds through the Li 5 ground state were obtained by determining
the area under each of the angular distributions indicated in Figures
19 - 22. The measurements for all of the center-of-mass angles
were fitted by a least-squares technique to a Legendre polynomial
expansion of the form,
t max
l
at Pt (cose)t=O
(t even) ,
. using the smallest value of l · (typically 4 or 6) which gave an max
adequate fit to the differential cross sections. The total cross
section for the Li5 ground state mechanism was then taken to be
and the error assigned to this. quantity was the resultant error in
a0 arising from the relative errors assigned to each of the
differ-. ential cross sections in a given angular distribution.
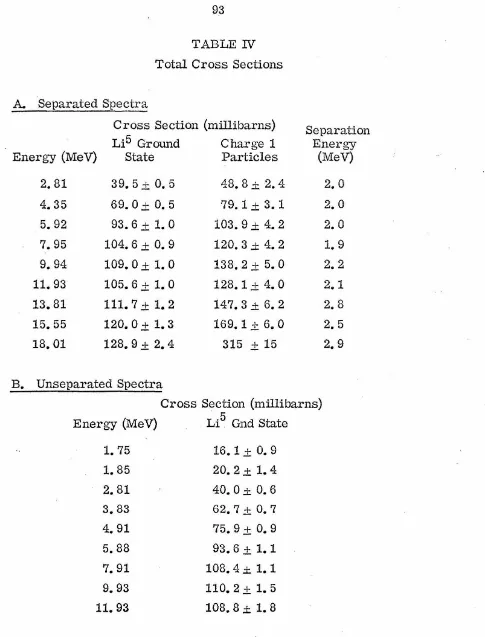
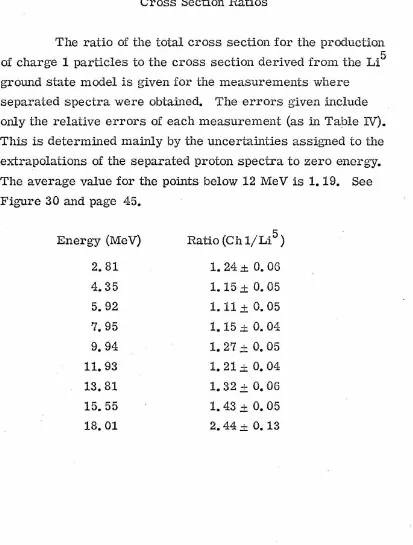
The results are given in Table IV and in Figure 24 they are
plotted as a function of the He3 bombarding energy. Also plotted on
unseparated spectra. The agreement between these two sets of
measurements is seen to be very good.
The various contributions to the relative errors of each
point of an angular distribution are discussed in Part II, B. 4 and
have been summarized in Table II. The error assigned to each
point included the systematic errors, the statistical uncertainty
in the total number of counts above XA (see Figure 11), and an
W1Certainty assig11ed to the energy calibration of the multi- channel
analyzer. This latter contribution was typically O. 4 to O. 7%, but
at the forward angles for the higher bombarding energies (where
the response of the detector was non-linear} it was as large as 2%.
Apart from these relative errors, the absolute value
including the normalization to the _He 3 + He 3 elastic scattering is
good to 5% below 12 MeV and to 10% for the higher energy
measure-ments. The W1Certainties due to the spectrum calculation are
difficult to estimate but they are probably of the order of 10%.
2. Integrated Charge 1 Measurements
As a check on the applicability of the Li 5 ground state
model, total cross sections for the reaction were obtained by
determining the total yield of charge 1 particles seen at each angle.
Since the counter telescope only allowed measurements of separated
spectra down to,...., 2 MeV, the major W1Certainty in these cross
sections involved the extrapolation of the spectrum to zero energy.
An additional uncertainty in the shape of the low energy region was
introduced by the possibility of a background contribution at the higher
bombarding energies due to neutron induced events in the active
Figure 25 illustrates the technique that was used to make
these low energy extrapolations and to assign them errors. The
spectra at 2. 81 MeV and 4. 35 MeV were observed to have less
backgroW1d down to the routing threshold of the COW1ter telescope.
They were used to establish a ratio,
(extrapolated height)/(high energy peak height) ,
at each angle that could be employed to determine the height of the
eh.'trapolation for the spectra at the higher bombarding energies.
In case the low energy spectrum was actually observed to turn over
and head toward zero (as in Figure 17 for 18 MeV and 20°), this
slope was continued. The uncertainty assigned to the total yield
at each angle was one half of the extrapolated yield, as indicated
by the shaded area in Figure 25.
The results of these determinations of "integrated charge 1
yield" are indicated in Figures 26 - 28 as angular distributions in the
laboratory system. The typical errors are again a cumulative error
involving the systematic errors, the statistical error on the total
yield (now very small), and the error determined by the amount of
extrapolated yield. The latter is the dominant contribution at all
angles. The shapes of these distributions are all strongly
forward-peaked indicating that there are a large number of low energy particles
that are carried forward by the center-of-mass motion. This
forward-peaking is further enhanced at bombarding energies above the threshold
for the formation of deuterons in the final state.
Total cross sections were obtained from these angular