Opening ceremony, IUS Awards, and Plenary Talk
CONGRESS HALL
Monday, July 22 2013, 08:30 am - 10:00 am
Plenary I-1 _________________________________________________________________________________________________________________________
Cancer and the Acoustic Bubble
Peter Burns1; 1University of Toronto, Toronto, ON, Canada
Background, Motivation and Objective Statement of Contribution/Methods
Tissue Engineering, neurostimulation and drug delivery
CONGRESS HALL
Monday, July 22 2013, 10:30 am - 12:00 pm
Congress Hallair:
Christopher Hall
IUS1-A1-1 __________________________________________________________________________________________________________________________
Engineering of Tissues with Ultrasound
Denise Hocking1,2, Diane Dalecki2,3; 1Department of Pharmacology and Physiology, University of Rochester, USA, 2Rochester Center for Biomedical Ultrasound, University of
Rochester, Rochester, NY, USA, 3Department of Biomedical Engineering, University of Rochester, Rochester, NY, USA
Background, Motivation and Objective
Developing new technologies that enable the repair or replacement of diseased or injured tissues and organs is a major focus of tissue engineering. The successful production of complex tissues requires recreating the biologically-active extracellular environment that stimulates tissue assembly. Recent advances in the field of tissue engineering include the engineering of skin, cartilage, and bladder, all of which are relatively thin tissues that can rely on diffusion for the delivery of oxygen and nutrients. The development of more complex tissues has been limited by the need for techniques that can rapidly organize cells and proteins within large three-dimensional scaffolds, and the need to create vascular networks within tissues to maintain viability and function.
Statement of Contribution/Methods
To address these challenges, we are developing ultrasound-based technologies to spatially organize cells and extracellular matrix proteins within tissue-engineered constructs. One of these technologies takes advantage of the acoustic radiation forces associated with ultrasound standing wave fields to spatially pattern cells within collagen-based hydrogels. A second technology uses ultrasound to noninvasively control the microstructure of collagen within engineered tissues.
Results/Discussion
Ultrasound standing wave field-induced spatial patterning of endothelial cells leads to extracellular matrix collagen remodeling and the rapid formation of a vascular network throughout the volume of the three-dimensional hydrogel. Using this technology, the spatial patterning of cells can be controlled noninvasively through proper design of the ultrasound field. By changing the initial density of the cell bands during hydrogel formation, the technology can produce vascular networks having two distinct morphologies – one that resembles peripheral vascular networks (i.e. arterioles and venules) and one that more closely resembles capillaries. Investigations also demonstrate the capability of ultrasound to spatially pattern various collagen microstructures within engineered tissue noninvasively, via a thermal mechanism. These changes in collagen microstructure were produced using both ultrasound standing wave fields and traveling wave fields. Thus, ultrasound technologies can be used to enhance the level of complexity of extracellular matrix microenvironments and cellular functions achievable within three-dimensional engineered tissues.
IUS1-A1-2 __________________________________________________________________________________________________________________________
Localization of Ultrasound Induced In Vivo Neurostimulation in the Mouse Model
Randy King1, Julian Brown2, Kim Butts Pauly3; 1Bioengineering, Stanford University, Stanford, CA, USA, 2Neurobiology, Stanford University, Stanford, CA, USA,
3Radiology/Bioengineering, Stanford University, USA
Background, Motivation and Objective
Developments in the use of ultrasound to stimulate neural activity have raised the possibility of using ultrasound as a new investigative and therapeutic tool in brain research. Until now there has been little evidence demonstrating a clearly localized effect in the brain. Here we report distinguishable effects in sonicating rostral and caudal regions of the motor cortex.
Statement of Contribution/Methods
A total of ten CBL-7 mice were employed in this study, in which two EMG electrodes were placed approximately 2-3 mm apart, into the base of the tail and in the neck region, in order to record the bioelectric potential difference across the muscle tissue. The ultrasound was generated by a single element, focused transducer with a center frequency of 500 kHz. A coupling column was fitted to the transducer and filled with degassed water. Ultrasound gel was used to couple the end of the transducer column to the head of the animal. The transducer was fixed to a three-axis positioning system. For all experiments the transducer was positioned 2mm from the surface of the animal’s head which allowed free movement of the transducer over the animal's head.
Results/Discussion
Motor responses, measured by normalized EMG (Fig. 1) in the neck and tail regions, changed significantly when sonicating the different areas of motor cortex. Response latencies varied significantly according to sonication location (Fig. 2) suggesting that different neural circuits were activated depending on the precise focus of the ultrasound beam. Our findings present good evidence for being able to target selective parts of the motor cortex with ultrasound neurostimulation in the mouse, a step that should set the stage for developing new applications in larger animal models including humans.
IUS1-A1-3 __________________________________________________________________________________________________________________________
Youliana Younan1, Thomas Deffieux1, Nicolas Wattiez2, Mickael Tanter1, Pierre Pouget2, Jean-Francois Aubry1; 1Institut Langevin, ESPCI ParisTech, CNRS UMR7587, INSERM
U979, France, 2Insitute of Brain and Spinal Cord, UMRS 975 INSERM, CNRS 7225, UMPC, Paris, France
Background, Motivation and Objective
In this work, we investigated the effect of low intensity pulsed focused ultrasound in the brain of two awake Maccaca Mulatta monkeys using the antisaccade (AS) paradigm. The objective of the study was to determine if transcranial ultrasound has an effect on behavioural tasks in awake animal involving a specific brain structure.
Statement of Contribution/Methods
Two Maccaca Mulatta monkeys (Y and L) were trained to perform antisaccade (AS) movements where they initially have to fix a central stimulus on a screen and then refrain from looking at an appearing peripheral target but instead initiate as soon as possible a saccade towards the opposite direction. The eye movements are tracked using an infra-red eye tracker (Eyelink 1k, SR-Research, Ontario, Canada) and then analyzed to estimate the antisaccade latencies.
In order to investigate the effect of low intensity focused ultrasound, a continuous 100 ms sonication pulse (derated pressure estimated at 0.35 ± 0.05 MPa, ISPTA 13.46 ± 3.78 mW/cm2) was focused at the frontal eye field (identified according to stereotaxic coordinates) using a 320 kHz transducer (H115, Sonic Concept, Bothell, WA, USA).
In a series of 23 independent experiments, animals performed 3 blocks of AS training per session: a baseline 100 trials block of AS (50 left/50 right); a 400 trials block composed of 360 trials without focused ultrasound (180 for each side) and 40 trials with focused ultrasound (20 for each side); a last block of 100 trials, as post-test.
Results/Discussion
Ipsilateral mean AS latencies with ultrasound stimulation were significantly (t-test ;monkey Y: p=.0345, monkey L: p= .0311) increased compared to the non-stimulation condition (monkey Y: +14ms; monkey L: +15 ms). This effect is consistent with previous findings of transcranial magnetic stimulation studies of the frontal eye field of non human primates[1].
The study demonstrates the feasibility of using focused ultrasound to causally modulate behaviour in awake non-human primate brain. Focused ultrasound neurostimulation could potentially lead to a new noninvasive neurostimulation tool with a better resolution and a larger volume of targeting than transcranial magnetic stimulation.
[1] Frontal non-invasive neurostimulation modulates antisaccade preparation in non-human primates. Valero-Cabre A, Wattiez N, Monfort M, François C, Rivaud-Péchoux S, Gaymard B, Pouget P. PLoS One. 2012;7(6), p. e38674.
IUS1-A1-4 __________________________________________________________________________________________________________________________
Evaluation of a rabbit carotid artery model for dissolving clots using pulsed focused ultrasound and rtPA under MRI monitoring.
Christakis Damianou1,2, Venediktos HadjiSavvas1, Nicos Mylonas3, Kleanthis Ioannides4; 1MEDSONIC LTD, Cyprus, 2Cyprus University of Technology, Cyprus, 3Frederick
University, Cyprus, 4Polikliniki Igia, Cyprus
Background, Motivation and Objective
The potential of using focused ultrasound combined with the thrombolytic drug recombinant tissue plasminogen activator (rt-PA) under magnetic resonance angiography (MRA), to dissolve clots in the carotid of a New Zealand rabbit in vivo is evaluated.
Statement of Contribution/Methods
A spherically-focused transducers of 5 cm diameter; focusing at 10 cm and operating at 1 MHz was used. The transducer was placed inside a custom made plastic holder which is coupled to the. A pulsed ultrasound protocol was used that maintains a tissue temperature increase of less than 1ºC in the clot (called safe temperature). The temperature was acquired using a thermocouple which is placed near the clot.
Results/Discussion
Different animal models were evaluated, and it was concluded that the carotid model is the best because it is easily accessible to ultrasound and it is sufficiently visible to MRI using MRA. Initially the artery was opened using rt-PA alone. With rt-PA alone 50 % of the artery was opened in about 120 mins. It was found that the time needed for opening 50 % of the artery using rt_PA and Focused ultrasound was decreased with acoustic intensity. With an intensity (20 W/cm2 SATA) that is not causing artery heating (less than 1ºC) the time needed to open 50% of the artery is 50 mins. The proposed protocol was monitored using Magnetic Resonance Angiography (MRA) every 1 min. Transducer registration was achieved using MRI visible marking on the transducer holder.
Focused ultrasound has the potentials to dissolve clots that are injected in the carotid of rabbits in vivo. The procedure is safe because with the protocols used the artery temperature was less than 1 oC. With focused ultrasound the time needed to open the artery is decreased. MRA clearly shows the opening of the artery. The acquisition of MRA is slow (1 min) but since the procedure takes close to 50 mins this is not causing any problem.
IUS1-A1-5 __________________________________________________________________________________________________________________________
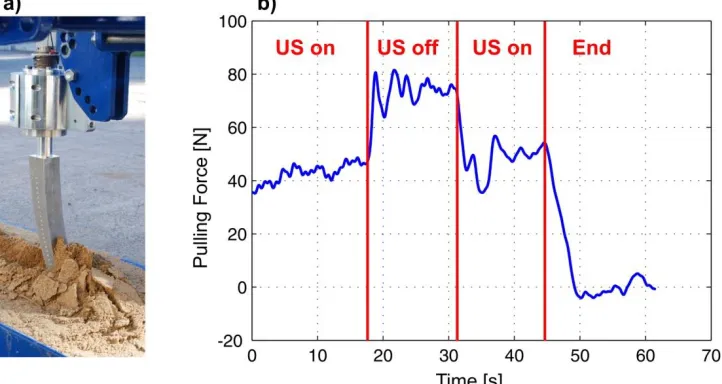
Delivery of Zoledronate is Highly Improved by Low Intensity Continuous Ultrasound in a Breast Cancer Bone Metastases Model
Sophie Tardoski1,2, Jacqueline Ngo2, Philippe Clézardin2, David Melodelima3; 1INSERM U1032, LabTau, Lyon, Rhône-Alpes, France, 2INSERM U1033, France, 3INSERM
U1032, LabTau, Rhône-Alpes, France
Background, Motivation and Objective
Bone metastases occur in 70% of advanced breast cancer. Zoledronate (ZOL) acts as an inhibitor of osteoclasts-mediated bone resorption. Antitumoral effects of ZOL have been described only in vitro at high doses, incompatible with a clinical use. Here we report the feasibility of using low intensity continuous ultrasound (C-US) to enhance the delivery of ZOL in tumor cells in an in vivo model.
Statement of Contribution/Methods
First, in vitro experiments were performed in order to measure the penetration of ZOL into tumor cells by mass spectrometry. Then, 69 mice bearing breast cancer bone metastases were randomized into 5 groups for an in vivo study. A single dose of ZOL was combined with a daily application of low intensity C-US. This dose of ZOL was calculated equivalent to the 4-mg clinical dose. A transducer working at a frequency of 2.9 MHz was used. The free field acoustic power was 7 watts applied for 30 minutes to produce thermal effects in bone tumors. US treatments were performed each day for fifteen days. Efficacy of treatments was measured by radiography (area of the osteolytic lesions), histomorphometry (Tumor Burden/Soft Tissue Volume: TB/STV) and immunohistochemistry.
In vitro, mechanical effects of US and generated-hyperthermia enhance the penetration of ZOL of at least 3 times compared with no US. In vivo, it was found that US alone did not have any inhibitory effect on bone destruction (7.4±2.7 mm²) when compared to vehicle-treated animals (6.6±1.6 mm², p=0.65). A statistically significant decrease of bone destruction and skeletal tumor burden was found in mice that received a daily treatment of continuous US with ZOL (1.3±0.4 mm2, TB/STV=11%) compared with vehicle (6.6±1.6, TB/STV=62%) and, more importantly, with ZOL alone (TB/STV=46%). Tumor cells proliferation was decreased by 70% in a nimal who received ZOL and daily US. In this group, angiogenesis was reduced by 75% compared to ZOL alone. US exposure conditions have not created cavitation. The te mperature in tumors was 42±2,8°C during US treatment. No lesions were observed in surrounding tissues.
Clinical applications of elasticity imaging
M4
Monday, July 22 2013, 10:30 am - 12:00 pm
Congress Hallair:
Kathy Nightingale
Duke University
IUS1-A2-1 __________________________________________________________________________________________________________________________
Shear wave quantitative elasticity of the cervix during pregnancy
Marie Muller1, Dora AitBelkacem1, Mahdieh Hessabi2, Jean-Luc Gennisson1, Mathias Fink1, Dominique Cabrol2, Mickaël Tanter1, Vassilis Tsatsaris2; 1Institut Langevin, CNRS,
ESPCI, INSERM, Université Paris Diderot, Paris, France, 2Maternité Port-Royal, hôpital Cochin, APHP, Université Paris-Descartes, Fondation PremUP, Paris, France
Background, Motivation and Objective
The quantitative and objective assessment of cervical stiffness has great potential for the estimation of preterm delivery risk, as well as for the prediction of the success of labor induction. Various methods can be used in vivo for cervical assessment such as vaginal digital examination or static elastography but to our knowledge, none of them can provide a quantitative, absolute and independent evaluation of cervical stiffness in vivo. In this study, such values were obtained in pregnant patients in vivo by using dynamic Shear Wave Elastography (SWE).
The objectives of this study were: i) to assess the range of normal elasticity values throughout the pregnancy, ii) to evaluate the intra and inter-operator reproducibility of the measurement and iii) to evaluate the potential of SWE for the discrimination of pre-term delivery threat.
Statement of Contribution/Methods
In SWE, radiation force is used to generate shear waves locally within tissue. Shear wave propagation is then followed using an ultrafast ultrasound scanner (5000 frames/s, Aixplorer, Supersonic Imagine, France), and a time-of-flight algorithm is applied to retrieve shear wave displacement, and shear modulus. In this study, stiffness of the lower anterior part of the cervix was quantified over a 8 mm diameter region of interest, during vaginal ultrasound examination in 63 pregnant women.
Results/Discussion
These are the preliminary results of a prospective study. The elastic modulus of the cervix was found to decrease significant ly throughout the pregnancy. Among all patients, cervical stiffness varied from 11.75 kPa +/- 3.81 kPa at the end of the first trimester (12 to 14 weeks of gestational age (GA)) to 6.03 kPa +/- 1.15 at the end of the third trimester (38 to 41 weeks of GA). The difference between stiffness values measured with the first trimester and the third trimester populations was statistically significant (p<0.001). For patients diagnosed with preterm labor, stiffness values measured during the second trimester were found around 6.73 kPa +/- 1.27 kPa, significantly lower than the values measured in normal patients in the second trimester (p<0.005).
This study provides for the first time a database for absolute elastic modulus values of the cervix throughout the pregnancy. Stiffness was observed to decrease with GA, which is consistent with the results previously obtained using a cervicotonometer (1). Cervical stiffness is reduced in patients with preterm labor threat. Further studies are needed to evaluate the interest of this technique in clinical practice.
1: Cabrol D. Cervical distensibility changes in pregnancy, term, and preterm labor. Semin Perinatol. 1991 Apr;15(2):133-9.
Funding sources : PremUp Foundation, Région Ile de France
IUS1-A2-2 __________________________________________________________________________________________________________________________
Correlation between the shear wave speed in tendon and its elasticity properties
Chia-Lun Yeh1, Po-Ling Kuo1, Pai-Chi Li2; 1BEBI, National Taiwan University, Taiwan, 2Electrical Engineering, National Taiwan University, Taipei, Taiwan
Background, Motivation and Objective
Tendon problems are commonly seen. Although ultrasound imaging can be used for clinical diagnosis, only structural changes can be monitored and the ability to differentiate the pathological state is limited. On the other hand, tendon mechanical properties have been considered the gold standard in evaluating tendon functions. Therefore, noninvasive assessment of mechanical properties of tendon is of particular interest in rehabilitation medicine. The relationship between the shear wave speed and elasticity is complicated in tendon due to the anisotropy from the organization of collagen fiber network. In this study, correlation between the changes of shear wave speed and alteration of elastic properties under different degree of loading are investigated both in normal and diseased models. The long term objective of this research is to replace the invasive elasticity measurement by using shear wave elasticity imaging of tendon.
Statement of Contribution/Methods
By using a motor with a linear stage and a load cell, elastic properties of normal and diseased tendon under different degrees of loading are directly derived based on fitting the slope of stress-strain curve. The collagenase enzyme is used to develop the diseased model. A fully programmable array imaging system with a linear transducer of 5MHz is utilized to measure the shear wave speed at the same loading condition. The trend between the shear wave speed and elastic properties in different degrees of loading are analyzed.
Results/Discussion
IUS1-A2-3 __________________________________________________________________________________________________________________________
How the measurement depth influences the liver stiffness assessment using shear wave elasticity imaging (SWE)
Congzhi Wang1, Jian Zheng2, Jie Zeng2, Zeping Huang2, Rongqin Zheng2, Hairong Zheng1; 1Institute of Biomedical and Health Engineering, Shenzhen Institutes of Advanced
Technology, Shenzhen, Guangdong, China, People's Republic of, 2The Third Affiliated Hospital of Sun Yat-sen University, Guangzhou, Guangdong, China, People's Republic of
Background, Motivation and Objective
Many techniques have been used to evaluate the elastic properties of tissues. The reliable measurement procedure of transient elastography (TE) and aco ustic radiation force impulse imaging (ARFI) have been reported in previous studies, which provide important references for the clinical practice. However, to the best of our knowledge, the reliable measurement procedure of real time shear wave elasticity imaging (SWE) technique was still not studied systematically. The purpose of this study was to evaluate the influence of measurement depth on liver stiffness assessment with SWE and to find a reliable measurement depth for performing tissue quantification on liver.
Statement of Contribution/Methods
Measurements were performed on a standard elasticity phantom and livers of 88 healthy volunteers using a commercial SWE device (Aixplorer system, SuperSonic Imagine). In phantom study, the measurement depth from the probe surface was set to be from 0-1 cm to 8-9 cm (totally 9 levels) and at each level measurements were repeated 10 times. In human study, the measurement depth was also set to be 1 cm interval, and 5 measurements were repeated at each depth from 2-3 cm to 7-8 cm (totally 6 levels). The measurement success rates (SR) and the coefficients of variation (CV) of repeated measurements at different depths were calculated and the results were studied statistically using SPSS.
Results/Discussion
In phantom study, the SRs were all 100% from 0-1 cm to 7-8 cm depth. However, at the depth larger than 8 cm the SR was 0. The CV was larger at 0-1 cm depth (9.8%) than at the other depths (from 0.6% to 3.8%). For healthy subjects, the SRs at the depth from 3-4 cm to 6-7 cm were higher than at the other depths. The shear modulus of liver and the CVs at different depths were found to have statistically significant differences (P <0.001). The shear modulus was significantly larger at 6-7 cm and 7-8 cm depths than at the other depths. And the CVs at the depth from 2-3 cm to 4-5cm were significantly lower than at the other depths. According to our results, the most reliable depths of liver stiffness assessment using SWE technology were 3-4 cm and 4-5 cm, which had the highest SR and the lowest CVs. This could be a reference in clinical applications for getting more reliable results using SWE device on liver.
IUS1-A2-4 __________________________________________________________________________________________________________________________
Liexiang Fan1, John Benson1, Lisa Clark2, Jessica Lam2, Abdullah Al Turki2, Cesar Patino-Ochoa2, Claude Sirlin2; 1Ultrasound, Siemens Healthcare, Issaquah, WA, USA, 2Liver
Imaging Group, Dept. of Radiology, University of California San Diego, San Diego, CA, USA
Background, Motivation and Objective
Nonalcoholic fatty liver disease (NAFLD), the most common liver disease in American adults and children, is characterized by excess hepatic fat accumulation as well as hepatic fibrosis. MRI accurately measures the proton density fat fraction (PDFF) as a biomarker of hepatic fat content, but MRI is not widely available. AN US-based technique to quantify liver fat would advance clinical care. This study investigated the correlation in human liver in vivo between acoustic radiation force impulse (ARFI) induced shear wave propagation parameters and MRI PDFF.
Statement of Contribution/Methods
10 human adult subjects spanning a wide range of hepatic fat content were enrolled in this pilot study under IRB at University of California San Diego. Each subject underwent an MRI and ultrasound scan on the same day. Hepatic PDFF was measured using a 3T MRI scanner. Shear wave propagation data were obtained using Siemens Acuson S3000 Virtual Touch Quantification (VTQ) feature with the 6C1HD abdomen transducer. In the 10 subjects, PDFF measurements ranged from 4.1% to 28.8% and VTQ shear velocities from 0.64 to 1.55m/s. Offline processing was conducted on the collected shear wave displacement data in a region of interest (ROI) of 10 mm tall and 5mm wide. The time duration and sampling rate of the displacement data was 12 milliseconds and 4.8 kHz. After the displacement was averaged over the ROI height dimension, the shear wave magnitude (peak value) and the shear wave center frequency and bandwidth at multiple locations along the propagation direction were calculated. The attenuation slope and intercept of magnitudes and the median values of center frequencies and bandwiths were calculated in each ROI. To obtain shear wave dispersion, a filter bank with 10 center frequencies evenly distributed in the range from 50 to 275 was applied to the shear wave displacement data. Shear velocity was estimated for each filtered narrow band shear wave and the dispersion slope obtained. For the 10 subjects, shear wave parameters were then correlated to MRI-PDFF.
Results/Discussion
Significant correlations were found between the MRI-PDFF and the shear wave magnitude attenuation slope and intercepts (r = 0.83, p < 0.003; and r = 0.85, p < 0.002) and between MRI-PDFF and shear wave bandwidth (r = 0.75, p < 0.01). The correlation between shear wave center frequency and velocity dispersion was weak (r = 0.17, p<0.63; and r = 0.39, p<0.26) in the small number of subjects enrolled in this study.
This pilot study shows proof of concept that shear wave attenuation can objectively quantify fat content in liver. Future study will be to test these variables in subjects with liver biopsy, so that the fat content and the fibrosis content can be quantified and correlated with both the attenuation and shear velocity. It may be possible to combine the shear velocity and the attenuation to predict both fat and fibrosis degree in liver using US technology.
IUS1-A2-5 __________________________________________________________________________________________________________________________
Material Characterization of In Vivo and Ex Vivo Porcine Brain using Shear Wave Elasticity Caryn Urbanczyk1, Mark Palmeri1, Cameron Dale Bass1; 1Duke University, Durham, NC, USA
Background, Motivation and Objective
Shear Wave Elasticity Imaging (SWEI) quantifies material properties such as shear modulus by relating it to transverse wave propagation speed, estimated via time of flight based reconstruction. It has been used noninvasively in liver1,2. We use SWEI in brain (in vivo, in situ, in vitro), to study effects of environmental variables including intracranial
pressure, temperature and confinement. Alteration of key properties provides modelers and scientists a more accurate in vivo picture and may be employed clinically as an indicator of pathology.
Statement of Contribution/Methods
Shear waves were generated, and IQ data in 4:1 parallel receive was collected with a Siemens ACUSON S2000 scanner and AcuNav 10F catheter transducer focused to 10mm, operating at 6.15MHz (F/# 1.4). Off-axis motion was tracked in a 10 x 4mm region of interest (ROI) for 4ms. Under isotropic, elastic assumptions, displacements were calculated with the Loupas phase shift estimator and shear wave speeds (SWS) were estimated with a RANSAC algorithm, which ignores erroneous motion by iteratively removing outlying data points. In vivo surgery was minimally invasive. The transducer was inserted through a drilled hole in the temporal skull, preserving the dura. Sagittal plane images were
acquired in B-mode and SWEI. After euthanasia, in situ SWEI images were taken with the skull intact and then with the calvarium open. In vitro specimens were removed from
the skull and placed in a saline bath at either 20°C or 37°C for imaging. In situ and in vitro measurements were used to discern boundary effects on tissue response and compare
physiological and experimental states.
Results/Discussion
Shear modulus in situ and in vitro were 50% and 22% higher than in vivo, respectively (p<0.01), suggesting that confinement by the skull impacts nonlinear strain hardening.
Varied temperature in vitro, yielded white matter shear moduli of 3.22±1.20kPa at 22°C and 2.63±.92kPa at 37°C (p<0.05), suggesting that to obtain biofidelic material properties
in a lab setting, samples must be tested at body temperature. In vivo shear modulus did not show significant differences with changes in ICP from 5–40mmHg. Normalized in vivo
shear modulus for all subjects was 3.06±.49kPa. This is comparable to published results in constrained livers2.
IUS1-A2-6 __________________________________________________________________________________________________________________________
Identifying Malignant and Benign Breast Lesions Using Vibroelastography
Hani Eskandari1, Septimiu Salcudean1, Robert Rohling1,2, Ali Baghani1, Samuel Frew1, Paula Gordon3, Linda Warren3; 1Electrical and Computer Engineering, University of
British Columbia, Vancouver, Canada, 2Mechanical Engineering, University of British Columbia, Vancouver, Canada, 3Faculty of Medicine, University of British Columbia,
Vancouver, Canada
Background, Motivation and Objective
Vibroelastography (VE) is a method for mapping tissue mechanical properties using a multifrequency shear wave approach. The method uses ultrasound to image steady-state motion within tissue while an actuator applies surface vibrations. In prior work, VE has been shown successful in reconstructing relative stiffness, absolute shear modulus and viscosity. In this paper we report for the first time, the efficacy of VE in differentiating between malignant and benign breast lesions.
Statement of Contribution/Methods
A total of 60 subjects with breast lesions have been tested. The study was approved by the Clinical Research Ethics Board and informed consent was collected from every subject. The VE system comprised an ultrasound machine (Ultrasonix Medical Corp.), a voice coil actuator, controller circuitry, a comp uter application to capture raw data and a program to compute and display real-time elasticity maps on the screen. In most cases, the applied vibration comprised a waveform with the following frequency co mponents: 21, 42, 63, 84, 105 and 126Hz. Sampling of the tissue motion at higher frequencies was made possible using the bandpass sampling technique. The steady-state displacement profile in the underlying tissue was measured using a correlation-based motion tracking algorithm and absolute elasticity was reconstructed from the spatial wavelength of the displacements. The snap-on design of the actuator made it possible to seamlessly incorporate the VE exam into the clinical workflow. The subjects recruited had BIRADS scores of 3, 4 and 5. Elasticity images were shown in real-time on the screen while echo data was stored for offline VE analysis. After the VE exam, the subjects underwent core-needle biopsy. The pathology report was used as the ground truth to measure the efficacy of the VE technique.
Results/Discussion
Medical signal processing
M5
Monday, July 22 2013, 10:30 am - 12:00 pm
Congress Hallair:
Svetoslav Nikolov
BK Medical Aps
IUS1-A3-1 __________________________________________________________________________________________________________________________
Real time deconvolution of in-vivo ultrasound images
Jørgen Arendt Jensen1; 1Center for Fast Ultrasound Imaging, Dept. of Elec. Eng., Technical University of Denmark, Kgs. Lyngby, Denmark
Background, Motivation and Objective
The axial resolution in medical ultrasound is directly linked to the emitted ultrasound frequency, which, due to tissue attenuation, is selected based on the depth of scanning. The resolution is determined by the transducers impulse response, which limits the attainable resolution to be between one or two wavelengths. This can be improved by deconvolution, which increase the bandwidth and equalizes the phase to increase resolution under the constraint of the electronic noise in the received signal.
Statement of Contribution/Methods
A fixed interval Kalman filter based deconvolution routine written in C is employed. It uses a state based model for the ultrasound pulse and can include a depth varying pulse and spatially varying signal-to-noise ration. An autoregressive moving average (ARMA) model of orders 8 and 9 is used for the pulse, and the ARMA parameters are determined as a function of depth using a minimum variance algorithm using averaging over several RF lines. In vivo data from a 3 MHz mechanically rotating probe is used and the received signal is sampled at 20 MHz and 12 bits. In-vivo data acquired from a 16th week old fetus is used along with a scan from the liver and right kidney of a 27 years old male.
Results/Discussion
The deconvolved image of the fetus is shown in the figure below on the right along with the original image on the left. The resolution is increased and the contrast is maintained or increased in the amniotic fluid surrounding the fetus and in the smaller black structures (vessels/cysts) to the right of the fetus. The axial resolution has been determined from the in-vivo liver image using the auto-covariance function. From the envelope of the estimated pulse the axial resolution at Full-Width-Half-Max is 0.581 mm corresponding to 1.13 λ at 3 MHz, which is typical for a high-resolution clinical system. The algorithm increases the resolution to 0.116 mm or 0.227 λ corresponding to factor of 5.1. The basic pulse can be estimated in roughly 0.176 seconds on a single CPU core on a Intel i5 CPU running at 1.8 GHz. An in-vivo image consisting of 100 lines of 1600 samples can be processed in roughly 0.1 seconds making it possible to perform real-time deconvolution on ultrasound data by using dual or quad core CPUs for frame-rates of 20-40 Hz. The C implementation can thus attain real-time processing of images for an increased resolution without affecting the perceived contrast and noise.
IUS1-A3-2 __________________________________________________________________________________________________________________________
Range Side-lobe Inversion for Dual-Frequency Harmonic Imaging with Chirp Excitation
Che-Chou Shen1, Chun-Kai Peng1; 1National Taiwan University of Science and Technology, Taipei, Taiwan
Background, Motivation and Objective
Dual-frequency harmonic imaging (DHI) is capable of simultaneous harmonic detection at both fundamental frequency (f0) and second harmonic frequency (2f0). To achieve DHI, dual-frequency (DF) composite waveform is utilized for transmit and the resultant 2f0 second harmonic signal and f0 frequency-difference harmonic signal are received for imaging. When chirp excitation is utilized to improve signal-to-noise ratio (SNR) in DHI, however, range side-lobe artifacts occur at both imaging frequencies because of inevitable spectral overlap between the two chirp-encoded harmonic signals. Even with narrow signal bandwidth, DHI still suffers from fourth-order harmonic interference.
Statement of Contribution/Methods
range side-lobes inverted and therefore they can be combined to remove the side-lobe artifacts. The DF chirp waveform with f0 and 2f0 transmit phases of 0° and 180° is also another feasible solution for side-lobe inversion. Hydrophone measurement and B-mode imaging are performed to verify the side-lobe reduction in chirp-encoded DHI.
Results/Discussion
Results indicate that the RSI technique effectively reverses the range side-lobe and suppresses the side-lobe level when either the summation or difference of echoes from the original and the modified chirp transmit waveforms is utilized for imaging. Fig.(A) shows that f0 and 2f0 harmonic signal envelopes have lower side-lobe with RSI technique. B-mode harmonic images in Fig.(B) also show that the anechoic cyst is less contaminated by side-lobe artifacts when the RSI technique is adopted. The corresponding side-lobe magnitude (SLM) decreases from -30 dB to -37 dB. It is concluded that, at the cost of an additional transmit to reverse the range side-lobe, the RSI technique provides a solution for chirp-encoded DHI to achieve SNR improvement together with reduced image artifacts.
IUS1-A3-3 __________________________________________________________________________________________________________________________
Extraction of Spectrally Overlapped Second Harmonic using the Fractional Fourier Transform
Sevan Harput1, Muhammad Arif2, James McLaughlan1, Peter R. Smith1, David M. J. Cowell1, Steven Freear1; 1School of Electronic and Electrical Engineering, University of
Leeds, Leeds, United Kingdom, 2Biomedical Engineering, Mehran University of Engineering & Technology, Jamshoro, Sindh, Pakistan
Background, Motivation and Objective
Tissue harmonic imaging provides better spatial resolution by producing the image with the second harmonic (SH) generated by nonlinear propagation. However, the spectral overlap between the transmitted signal and received SH signal results in image artifacts. Conventional filtering techniques such as a bandpass filter can separate the SH at the expense of reduced bandwidth and image resolution. The fractional Fourier transform (FrFT) demonstrated to be a good candidate for filtering linear frequency modulated (LFM) signals overlapping in both time and frequency domains.
In this study, a filtering method based on the estimated signal parameters of the SH component is proposed. The estimated chirp rate of the SH is used to calculate the FrFT transformation order, which achieves the maximum compression for the SH. Increasing the compression efficiency allows the application of narrower filtering windows over the signal, therefore the complete cancellation of range sidelobe levels and image artifacts is possible.
Statement of Contribution/Methods
The validity of the proposed method was verified by in-vitro measurements on a wire phantom with a medical ultrasound probe. The phantom was built with 4 wires located at a depth of 42, 50, 60, and 70 mm in tissue mimicking material. A 3.5 MHz centered LFM chirp with a bandwidth of 3 MHz was used for excitation. The SH was received by the same probe at 4-10 MHz.
To separate the fundamental and the SH components, the received signal was transformed into the FrFT domain by using the estimated SH chirp rate. In the FrFT domain, the SH component was extracted by applying a filter window. After filtering, the extracted SH was transformed to the time domain using the inverse FrFT and compressed by a second harmonic matched filter.
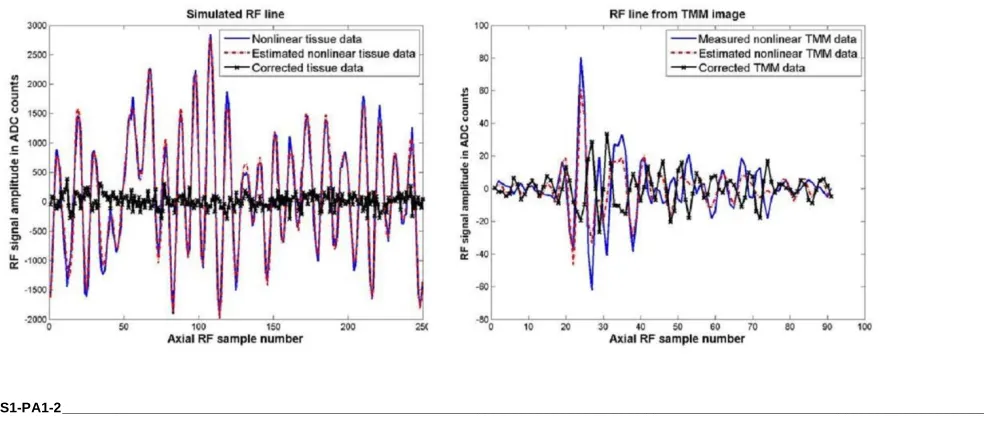
Results/Discussion
Second harmonic image of the wire phantom is shown in the figure (left) with image artifacts due to spectral overlap. The figure (right) shows the same image filtered with the proposed method before forming the image, where no image artifacts are visible.
IUS1-A3-4 __________________________________________________________________________________________________________________________
Arbitrary Waveforms using a Tri-State Transmit Pulser
John Flynn1, Peter Kaczkowski1, Ken Linkhart1, Ronald Daigle1; 1Verasonics, Inc, Redmond, WA, USA
Background, Motivation and Objective
Arbitrary waveform synthesis is used in several medical ultrasound applications, including high frame rate acquisition employing orthogonal pulses, large time-bandwidth pulses for increased penetration, and time reversal-based imaging and therapy. Conventional hardware for arbitrary waveform transmission uses multi-bit Digital to Analog Converter (DAC) circuits and linear amplifiers. Alternatively, tri-state encoded pulse trains can energize the transducer, producing analog waveforms with usable fidelity at the transducer output. However, the simplicity of tri-state pulse circuitry presents an encoding design challenge for arbitrary waveform synthesis. The present study examines methods of encoding a tri-state pulser having precise timing control available over waveform edges to approximate arbitrary waveforms under the constraints of commercial hardware circuitry.
Statement of Contribution/Methods
The study was performed in both simulation and experiment, using the Verasonics Research System. The waveform specification provides choice of edge transition times for very long pulse trains at a 250 MHz clock. Three classes of waveforms are examined: a linear FM (LFM) sweep, a set of orthogonal pulses, and an arbitrary waveform simulating a received signal in a time-reversal application. Each is given “ideal” precision, and stored as a sampled analog waveform. Using an empirical model of the transducer dynamics, encoding methods produce a tri-state pulse sequence so the acoustic medium is ensonated with an analog of the desired waveform. We evaluate heuristic algorithms as well as minimum-mean-square-error (MMSE) equalizer-based structures for their fidelity in reproducing the desired waveforms in the medium.
Results/Discussion
As expected, the tri-state waveforms contain many more harmonics than the multi-bit DAC waveforms would prior to filtering by a transducer dynamics. However, the post-filtered waveforms are significantly closer to each other in the acoustic medium. An example of the MMSE encoder performance is shown in the figure, where a windowed LFM sweep is applied to a hypothetical 5MHz transducer with 80% bandwidth. Here the MMSE-based encoder demonstrates practical LFM reproduction by generating a tri-state pulse sequence with -26 dB of error energy against the analog specification, at the modeled acoustic output.
IUS1-A3-5 __________________________________________________________________________________________________________________________
Compressive Sensing Ultrasound Imaging using Overcomplete Dictionaries
Background, Motivation and Objective
Compressive sensing (CS) is a recent theory allowing the recovery of a signal sampled below the limit set by Shannon’s theorem. The application of CS to medical ultrasound (US) imaging is a very recent field and the few existing studies mostly focus on fixed sparsifying transforms. In contrast to previous work, we propose a new approach based on the use of learned overcomplete dictionaries. Such dictionaries allow for much sparser representations of the signals since they are optimized for a particular class of images such as US images.
Statement of Contribution/Methods
The principle of CS can be summarized as follows. Let x be an N-pixels image sampled using a so-called "sensing" basis Φ, resulting in y=Φx with y of RM×N, M<N. The CS
theory assumes that x has a sparse representation in some model basis which, in this case, will be an overcomplete dictionary rather than a fixed basis. Let xp of Rn , n<N, be a
patch of an image x and D of Rn×K be an overcomplete dictionary, with n<K, such that x
p=Dvp. Application of CS implies learning D such that vp is a sparse representation of the
patch p in D with at least T0 non-zero entries. Assuming the sensing basis Φ is incoherent with D, we will then be able to recover the original image patches from the linear
measurements y.
In this study, the dictionary D was learned using 8×8 patches extracted from the image to be reconstructed. This training was performed using K-SVD, due to the efficiency and ease of implementation of this algorithm.
Results/Discussion
Experimental beamformed RF signals were acquired using Ultrasonix MDP system scanning a CIRS Model 054GS US phantom. CS reconstruction was performed by removing 25% to 75% of the original samples according to a uniform law. The accuracy of the reconstruction was measured using the mean absolute error.
The obtained accuracies were in the ranges [1.6, 3.1].10-4, [2.1, 4.9].10-4 and [7.9.10-6, 2.1.10-4] using Fourier, Daubechies wavelet basis and K-SVD dictionary respectively,
showing the potential of the overcomplete dictionaries. Figure 1, shows a reconstruction example, the sparsity as a function of the dictionary and the resulting accuracy as a function of the subsampling rate.
This study demonstrates the high potential of learned overcomplete dictionaries for CS in US imaging. Future work will consist in showing the generality of overcomplete dictionaries.
IUS1-A3-6 __________________________________________________________________________________________________________________________
Effects of heart rate on the pulse waveform measured at the left common carotid artery
Yuka Komagata1, Tomohisa Mase1, Yuki Ikenaga1, Mami Matsukawa1, Masashi Saito2, Takaaki Asada2, Yoshiaki Watanabe1; 1Wave Electronics Research Center, Doshisha
University, Japan, 2Murata Manufacturing Co., Ltd., Japan
Background, Motivation and Objective
Pulse wave evaluation is simple and useful for screening arteriosclerosis. The pulse wave is composed of two kinds of displacement waves: incident and reflected waves. In our former study, pulse wave measurement was performed on the skin of the neck near the left common carotid artery using a commercial piezoelectric transducer. Because the attenuation of the reflected wave during propagation changes due to the stiffness of the artery, we have proposed a method to extract the reflected wave from the observed pulse
waves. A good correlation between the age and the maximum amplitude of the measured reflected was observed (R2=0.65). However, the data showed a dispersion, which seemed
to come from the difference in the personal conditions, blood viscosity, heart rate etc. In this study, we then focused on the effect of heart rate on the pulse waveform.
Statement of Contribution/Methods
Pulse wave and blood flow velocity on the neck were measured simultaneously from 12 male subjects in their 20s to 60s. A piezoelectric sensor was used to measure the pulse wave. Blood flow velocity was measured using an ultrasonic Doppler system (AplioSSA-700A, Toshiba Medical Systems, Japan). The reflected wave was extracted from the pulse
wave following the technique of Saito [1]. We then divided pulse waves and blood flow velocity waves into three blocks, from the half of the initial upstroke to the peak (T1), from
the peak to the incisura (T2), and from the incisura to the end (T3). We then obtained the time interval of three blocks.
Results/Discussion
In all data, the interval T3 only depended on the heart rate. We then normalized T3 into 0.8 seconds. Fig. 1 shows examples of the pulse and reflected waves. There were few
differences between the maximum amplitudes of reflected waves obtained from the original and normalized waves. The result suggests that the effect of heart rate on the reflected
wave was small. Actually, changes of heart rate showed very small effects on the intervals of T1 and T2, where reflected wave and the initial wave usually overlapped. Considering
the characteristics of heart rate and pulse wave, the small effects on the reflected waves are reasonable. Therefore, even if in vivo measurement, the effect of heart rate does not
seem to be a main cause of the dispersion.
NDE - Phased Arrays
NH
Monday, July 22 2013, 10:30 am - 12:00 pm
Congress Hallair:
Robert Addison
Retired for Rockwell Scientific Company
IUS2-A-1 ___________________________________________________________________________________________________________________________
Ultrasonic array imaging of composite components
Paul Wilcox1, Chuan Li2, Damien Pain2, Bruce Drinkwater2; 1Mechanical Engineering, University of Bristol, Bristol, Avon, United Kingdom, 2University of Bristol, United
Kingdom
Background, Motivation and Objective
As carbon fibre composite becomes more widely used for primary structural components in aerospace applications, the reliable detection of small defects and other material anomalies in thick-sections is increasingly important. Composites present challenges for inspection in terms of the type of defects (e.g. delaminations, porosity, resin-rich regions, fibre-waviness), the nature of the material (in particular, heterogeneity on multiple scales and anisotropy) and the geometry of components. The objective of this work is the development of array imaging techniques specifically tailored to defect detection in composite components.
Statement of Contribution/Methods
The starting point is Full Matrix Capture (FMC) of ultrasonic data from an array. In isotropic materials the Total Focusing Method (TFM) of imaging using FMC data yields images close to the theoretical diffraction limit in terms of resolution. However in composite materials this is not the case as velocity anisotropy, multiple-scattering and angle-dependent backscatter from ply-interfaces corrupt images. In a contact inspection of a planar component, the authors have previously shown how the TFM method may be tailored for this case by anisotropy correction combined with optimisation of aperture angle and frequency filter. In the current paper, this approach is extended to the immersion inspection of non-planar composite components. Here the material properties are no longer translationally invariant and ultrasonic rays follow curved paths. An efficient numerical model based on Dijkstra’s method to find the shortest duration routes is developed and validated against finite element predictions.
Results/Discussion
Accounting for ray path curvature in imaging is shown to significantly improve results. This is demonstrated both via simulation and experiment. To make the technique viable for practical use it is necessary to be able to compute ray-paths very rapidly and a technique for achieving this is shown. The extension to 2D arrays is discussed.
IUS2-A-2 ___________________________________________________________________________________________________________________________
A Design Methodology for 2D Sparse NDE Arrays using an Efficient Implementation of Refracted-Ray TFM Jerzy Dziewierz1, Anthony Gachagan1; 1Centre for Ultrasonic Engineering, University of Strathclyde, Glasgow, United Kingdom
Background, Motivation and Objective
2D sparse ultrasonic NDE array designs would benefit from a real-time simulation package in which the array transducer parameters and inspection scenario were fully integrated to optimise the array design for a specific application. Importantly, this process is not straight-forward for many applications, due to the conflicting requirements of conventional array theory (inter-element spacing and element beam characteristics) and the physical demands of the inspection scenario (refraction at non-planar interface).
Statement of Contribution/Methods
A novel algorithm has been developed that allows extremely efficient calculation of the total time of flight of an acoustic ray through two layer media, taking into account the effects of refraction through a 3D surface. The approach has been implemented on GP-GPU hardware, and embedded within the Total Focussing Method imaging algorithm. This new software module supports arbitrary location of probe elements, array element directivity, arbitrary curved interface between two media, arbitrary transmit/receive sequences and any 1D/2D/3D image size for reconstructing the ultrasonic image from raw RF ultrasonic data.
Results/Discussion
The measured performance for the implemented algorithm is >23 GPaths/second on a Fermi-class GPU. For example, a 640x960 pixel image and 128-element probe requires ~5e9 transmit-receive path calculations and the GP-GPU system performs the entire calculation in 0.22 seconds (subject to data acquisition and other constraints).
An example 2D array design is presented for the inspection of composite material, with the principal design objective to maximise the array aperture to ensure greatest volumetric coverage from a single inspection point. The final array configuration comprised 128 array elements, within a 35mm aperture, with each array element 1.5mm in diameter. Moreover, this array operated through a column of water and provided coverage of an area roughly equivalent to 40mm in diameter. The array transducer has been fabricated and tested on composite fan blade samples with a thickness variation between 5mm and 50mm and shown to detect simulated defects and impact damage locations.
IUS2-A-3 ___________________________________________________________________________________________________________________________
Efficient computation of delay law for imaging structure with a complex surface Jie Zhang1, Bruce Drinkwater1, Paul Wilcox1; 1University of Bristol, United Kingdom
Background, Motivation and Objective
Ultrasonic array immersion inspection can be used for detect defects in a structure with a com-plex surface, where a water layer is used to couple ultrasonic waves from an array probe into the structure. A high resolution image can be formed by using an imaging algorithm, e.g., the total focusing method (TFM), for a full matrix capture (FMC) array data. In this case, one difficulty is that the focal laws are not easily calculated. The imaging speed depends on the complexity of the surface and the total number of image pixels. In order to increase imaging speed for on-line in-spection application, this paper presents an efficient way to compute delay law without compro-mising the measurement accuracy. This includes extracting surface geometry from the ultrasonic data and optimizing key parameters for delay law estimation.
Statement of Contribution/Methods
In the proposed imaging process, the surface geometry is first measured by forming an image in the couplant layer. This leads to a set of discrete points that define the surface profile. The prop-agation delay from an array element to a point in the component is determined by a grid search of candidate ray-path through each surface point to identify the one that yields the shortest trav-elling time according to Fermat’s principle. Time delays in the components are first generated on a coarse mesh and then these values are linear interpolated to find the time delays to each image pixel. The computed delay laws are finally used to reconstruct the structure image.
An analytical model is developed to build the relationship between estimated delay law errors and array inspection configuration. These errors are mainly caused by incorrect or insufficient points defining the surface and the linear interpolation process. The errors manifest as an ampli-tude reeducation of signals from targets in the structure. Experimental measurements performed on 3 aluminum samples with the same curved surface and 3 defects of the same size but different locations were used to validate the analytical model of delay law error. The validated model is then used to determine the optimum parameters for delay law calculation.
Results/Discussion
The proposed analytical model of delay law error was validated by the experimental results. The finding is that a surface can be adequately described by points spaced at 0.5 mm and that delay laws can be computed on a grid spaced at 1 mm. With these parameters, the reduction in ampli-tude of a point target in the structure can be guaranteed to be less than 1 dB.
IUS2-A-4 ___________________________________________________________________________________________________________________________
Time Reversal Techniques for Multitarget Identification
Franck Assous1, Marie Kray2, Frederic Nataf3; 1Ariel University, Israel, 2Mathematisches Institut, Universität Basel, Basel, Switzerland, 3LJLL, UPMC and CNRS, Paris, France,
France
Background, Motivation and Objective
Since the seminal paper by M. Fink et al., time reversal is a subject of very active research. The main idea is to take advantage of the reversibility of wave propagation phenomena such as it oc-curs in acoustics, elasticity or electromagnetism in a non dissipative unknown medium to back-propagate signals to the sources that emitted them. Number of industrial applications have alrea-dy been developped: touchscreen, medical imaging, non destructive testing and underwater communications. However, the resolution of these applications is restricted by the diffraction limit.
Statement of Contribution/Methods
We have designed a method named TRAC (Time Reversed Absorbing Conditions, [1]) that enables to go far beyond the diffraction limit without knowing the physical properties of the tar-gets. This is made possible by introducing time reversed absorbing conditions in time reversal techniques. Using multiple illuminations, TRAC is able to exceed the diffraction limit.
[1] Assous F., Kray M., Nataf F. and Turkel E., Time Reversed Absorbing Condition: Applica-tion to inverse problem, Inverse Problems 27 (2011).
Results/Discussion
than the Rayleigh diffraction limit λ/2. Hard, soft and penetrable inclusions are treated in the same way by the method. It ge-nerates resolution beyond the diffraction limit even in presence of high level of noise on the data.
IUS2-A-5 ___________________________________________________________________________________________________________________________
Simultaneous measurement of thickness and sound velocities of each layer in multi-layered structures
Sebastian Kümmritz1, Elfgard Kühnicke1, Mario Wolf1; 1Solid-State Electronics Laboratory, TU Dresden, Dresden, Saxony, Germany
Background, Motivation and Objective
Layered systems are part of numerous structures, e. g. asphalt in road construction, solidification processes of melts, circuit boards etc. The precise thickness and the elastic properties of the single layers can obtain important information about the state of the whole system.
Conventionally, one of the properties (thickness, sound velocity) of each layer has to be known to determine the other property using the time of flight. Unfortunately, in many applications none of these parameters is available. A procedure for the simultaneous and nondestructive determination of sound velocity and thickness is currently not known.
Statement of Contribution/Methods
In this contribution, a novel nondestructive and noninvasive approach for the simultaneous measurement of sound velocity and thickness of each layer in a multi-layer structure is introduced. Because the focus position of an ultrasound transducer depends on the sound velocity in the medium, the basic idea is to use it as an additional piece of information. To vary the focus position, an annular array is used. All its elements can send and receive independently, which enables synthetic focusing. An iterative algorithm which varies the set of delay times for different sound velocities and different focus positions has been developed.
If the chosen sound velocity and focus position for the calculated set of delay times match to the actual position of boundary surface and sound velocity in the layer, the echo signal takes its maximum. This is the procedure for one layer. For multi-layer systems, the determination of sound velocity and thickness is carried out layer by layer.
If the focus extension is small, the maximum of the reflected signal appears, when the focus is positioned on the boundary surface. For a larger focus extension (e. g. for measurements at a big distance), the echo signal takes its maximum when the focus is positioned in front of the surface. Sound field simulations give the dependence of the focal extension and the distance between the reflector and the focal point causing maximal echo amplitude. They also deliver the focal position as a function of material parameters, thicknesses and the sequence of the layers.
Results/Discussion
With this method the thicknesses and sound velocities of different two-layer structures were determined with accuracies below two percent. First studies for systems with more than two layers are presented.
IUS2-A-6 ___________________________________________________________________________________________________________________________
Ultrasonic imaging of a turbine blade model using a 360° synthetic-aperture-focusing-technique and reverberation suppression
Thomas Scharrer1, Andreas Koch1,2, Stefan J. Rupitsch1, Alexander Sutor1, Helmut Ermert1,2, Reinhard Lerch1; 1Chair of Sensor Technology, University of Erlangen, Erlangen,
Germany, 2High Frequency Engineering Research Group, Ruhr-University Bochum, Bochum, Germany
Background, Motivation and Objective
Nowadays, non-destructive testing of turbine blades is often based on X-ray Computed Tomography (X-ray CT). But, due to an intense X-ray absorption in specific directions, the material cannot be completely penetrated and consequently, several projections are missing in the measurement data. Therefore, a new approach is developed to complement these absent projections with information gained by ultrasonic testing. However, with respect to substantial refraction effects and an irregularly shaped specimen, ultrasonic testing in immersion technique is impeded. Emerging refraction effects and reverberation signals cause a poor ultrasound image quality and inhibit an adequate detection of the desired structural information. Here, we present an adapted 360° synthetic-aperture-focusing-technique (SAFT) based on a virtual point source, which eludes influences of refraction effects of the specimen´s surface. To reduce signal reverberation artifacts, data is filtered by means of principle component analysis (PCA) and predictive deconvolution (PD).
Statement of Contribution/Methods
The procedure can be divided into five major steps. (i) First, data is acquired successively along a path at constant distance to the surface of the specimen, i.e. wave propagation direction is always perpendicular to the surface of the device (Fig. 1). (ii) In a next step, surface echoes are eliminated by a subspace analysis and projection filter. (iii) Afterwards, the obtained data is filtered by a predictive deconvolution algorithm to reduce reverberation signals. (iv) Subsequently, the processed data is converted into an analytic signal and in a last step, (v) the 360° synthetic-aperture-focusing-technique is applied to the aperture, which is determined by the data acquisition procedure.
Results/Discussion
Ultrasonic motors 1
T1
Monday, July 22 2013, 10:30 am - 12:00 pm
Congress Hallair:
Joerg Wallaschek
Leibniz Universitaet Hannover
IUS3-A-1 ___________________________________________________________________________________________________________________________
A nano emulsion generator using a microchannel and a bolt clamped type transducer
Takefumi KANDA1, Yusuke KIYAMA1, Koichi SUZUMORI1; 1Graduate School of Natural Science and Technology, Okayama University, Okayama, Okayama, Japan
Background, Motivation and Objective
The aim of our study is to obtain antitumor substance emulsion which has a droplet•fs diameter of 200 nm or less. In our previous research presented in 2010 IUS, we reported a microchannel device oscillated by 2.3 MHz plate type vibrator. The system realized a flow, silent and small system. By using the system, we succeeded in generating o/w (oil in water) emulsion of antitumor substance. However the system needs much higher power to increase the ratio of oil phase against water phase. This is because the oil-phase contains the drug. In this study, we have used a bolt clamped type small transducer to oscillate ultrasonic vibration against the microchannel.
Statement of Contribution/Methods
For a generation of emulsion, two syringe pumps to supply oil-phase and water-phase, a T-type microchannel plate and an ultrasonic device were used. First, by the T-type microchannel, micron-sized emulsions are generated. Then the micron-sized emulsions were sonicated by the ultrasonic vibration and nano-sized droplets are obtained. In the ultrasonic device, the microchannel is 0.711 mm wide and 0.65 mm deep. The oscillating frequency of our ultrasonic device is over 2 MHz. This is because the microchannel•fs depth is shallow, and it needs a high frequency to oscillate a standing wave. In our new device, we designed a small bolt cla mped type transducer to apply higher pressure against the micron-size droplets. The cross sectional pattern of the ultrasonic microchannel device and the bolt clamped type transducer was designed by using FEM as a unit. The fabricated device is shown in the photo. The left plate is the microchannel plate and the right device is the transducer.
Results/Discussion
The distribution of the generated droplets•f diameter was measured with a dynamic light scattering (DLS). In our previous study, the peak of diameter was in 100 nm when the flow rates of the water-phase and the oil-phase were 100 and 5 µl/min. However the oil-phase has a high viscosity and we could not increase the ratio by our previous devise. With our new device, the peak of diameter was in 100 nm when the flow rates of the water-phase and the phase were 100 and 12 µl/min. We have succeeded in obtaining higher oil-phase ratio against the water-oil-phase with our new oscillating system.
IUS3-A-2 ___________________________________________________________________________________________________________________________
Ultrasonic motor using thrust bearing for friction drive with lubricant.
Takaaki Ishii1, Hiroki Yamawaki2, Kentaro Nakamura3; 1Mechatronics, University of Yamanashi, Kofu, Yamanashi, Japan, 2University of Yamanashi, Japan, 3Precision and
Intelligence Laboratory, Tokyo Institute of Technology, Yokohama, Kanagawa, Japan
Background, Motivation and Objective
Using lubricant is one of the solutions to obtain high efficiency and good motor characteristics. In order to use lubricant effectively, high contact pressure is required. In this report, we propose using thrust bearing for friction drive of the ultrasonic motor, instead of the conventional friction material. High contact pressure is expected between balls and flat surface. At the same time, the contact points keep changing by rotating the bearing balls, hence the low wear of the balls is expected. Improved lubrication is also expected by rotating the balls.
Statement of Contribution/Methods
on the friction surface. PZT for longitudinal vibration and PZT for torsional vibration are excited. Three kinds of lubricants with two kinds of viscosities are used for bearing lubrication. Two methods of rotor-output-type and bearing-output-type are used to obtain output torque.
Results/Discussion
Fundamental characteristics of the hybrid transducer type ultrasonic motor using thrust bearing were obtained for the first time. Figure 2 shows one of the results obtained under the pre-load of 300 N. The maximum rotation of 10 r.p.m., the maximum torque of 0.123 Nm and the maximum driving efficiency of 2.7 % were successfully achieved by the bearing-output-type motor using high traction fluid with viscosity of 100 cSt.
IUS3-A-3 ___________________________________________________________________________________________________________________________
Piezo Impact Type MEMS Rotary Actuator and Application to Millimeter Size AI Controlled Robot
Minami Takato1, Tatsuya Ogiwara1, Shinpei Yamasaki1, Ken Saito1, Fumio Uchikoba1; 1Precision Machinery Engineering, Nihon University, Funabashi, Chiba, Japan
Background, Motivation and Objective
Micro robots have been studied for various applications. These robots require small size body and small size actuator, for example, electromagnetic actuators, shape memory alloy (SMA) actuators, piezoelectric actuators, and so on. Previously, we developed insect type MEMS micro robots. These robots were fabricated by MEMS (Micro Electro Mechanical Systems) technology and shape memory alloy based artificial muscle wires. The micro robot had six legs and the robot performed foot step walking. However, the artificial muscle wire actuator had problems of large power consumption and slow motion speed. In this study, we propose a piezo impact type MEMS rotary actuator for micro robot application. Applied robot is a millimeter size and controlled by an artificial intelligence system.
Statement of Contribution/Methods
In the rotary actuator, a multilayer piezoelectric element was arranged the outside of the rotor. The arranged piezoelectric element was expanded by electrical pulses. When the impact caused by the expansion was added to the rotor, the rotary motion was generated. The frame of this actuator was fabricated by MEMS technology. Fig. 1 shows the structure of the piezo impact type MEMS rotary actuator. Developed rotary actuator was applied to millimeter size robot which has six legs and link mechanism. Driving pulses were generated by the AI hardware neural networks.
Results/Discussion
The rotation speed of the rotary actuator showed 80 rpm when the applied frequency was 18 kHz. The dimensions of the micro robot which has the piezo impact type MEMS rotary actuator were 4 mm, 4.6 mm and 3.6 mm, width, length and height, respectively. Fig. 2 shows the fabricated micro robot. The locomotion speed achieved 128 mm/min.