Cite this:Phys. Chem. Chem. Phys., 2015,17, 24070
Lysozyme adsorption at a silica surface using
simulation and experiment: effects of pH on
protein layer structure†
Karina Kubiak-Ossowska,aMonika Cwieka,bAgnieszka Kaczynska,c Barbara Jachimskab and Paul A. Mulheran*a
Hen Egg White Lysozyme (HEWL) is a widely used exemplar to study protein adsorption on surfaces and interfaces. Here we use fully atomistic Molecular Dynamics (MD) simulations, Multi-Parametric Surface Plasmon Resonance (MP-SPR), contact angle and zeta potential measurements to study HEWL adsorption at a silica surface. The simulations provide a detailed description of the adsorption mechanism and indicate that at pH7 the main adsorption driving force is electrostatics, supplemented by weaker hydrophobic forces. Moreover, they reveal the preferred orientation of the adsorbed protein and show that its structure is only slightly altered at the interface with the surface. This provides the basis for interpreting the experimental results, which indicate the surface adsorbs a close-packed monolayer at about pH10 where the surface has a large negative zeta potential and the HEWL is positively charged. At higher pH, the adsorption amount of the protein layer is greatly reduced due to the loss of charge on the protein. At lower pH, the smaller zeta potential of the surface leads to lower HEWL adsorption. These interpretations are complemented by the contact angle measurements that show how the hydrophobicity of the surface is greatest when the surface coverage is highest. The simulations provide details of the hydrophobic residues exposed to solution by the adsorbed HEWL, completing the picture of the protein layer structure.
Introduction
Due to its key role in numerous medical and technological material systems and their applications,1protein–surface inter-action has been investigated for many years. Despite wide-ranging experimental2–20 and computational21–27 effort, the details of protein adsorption on various surfaces are still not fully eluci-dated. Protein adsorption properties on silica matrices has attracted growing interest for its applications in nanomedicine and biocatalysis. Mesoporous silicon, due to its weak interactions with proteins, may be used as possible carrier for therapeutic protein delivery,28while other forms of silica support, such as
sol–gel composites or mesoporous silica, due to strong protein adsorption may be used for enzyme immobilization and bio-catalysis purposes.29,30
In this paper we employ a fully atomistic molecular dynamics (MD) approach alongside Multi-Parametric Surface Plasmon Resonance (MP-SPR), contact angle and zeta potential measurements to further understand the details of how a model protein (hen egg white lysozyme, HEWL) adsorbs onto a SiO2surface.
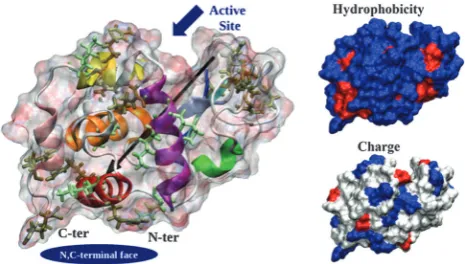
HEWL can be considered as an ellipsoid with the N,C-terminal face (which is the primary adsorption site on negatively charged surfaces) lying on one end and the active site on the opposite (Fig. 1). The ellipsoid dimensions are roughly 45 Å30 Å30 Å (Fig. S2, ESI†). Thisa-helical protein consists of 4 longa-helices (denoted as A–D), two a-helices 310 and three short b-sheets
connected by flexible loops.31 Of its 129 residues there are 11
arginine (Arg) and 6 lysine (Lys) residues, 7 aspartic acid (Asp) and 2 glutamic acid (Glu) residues, giving a net protein charge +8eat pH7 with an isoelectric point at pH10. It is worth noting that the charge is not spread equally across the protein surface. The most positive regions are the N,C-terminal face and its opposite side, while at the centre there is a mixture of positive and negative charge (Fig. 1). The positively charged regions a
Department of Chemical and Process Engineering, University of Strathclyde, James Weir Building, 75 Montrose Street, Glasgow G1 1XJ, UK.
E-mail: [email protected]
bJ. Haber Institute of Catalysis and Surface Chemistry, Polish Academy of Science
(PAS), Niezapominajek 8, 30-239 Cracow, Poland
cJagiellonian University, Faculty of Chemistry, Ingardena 3, 30-060 Cracow, Poland
†Electronic supplementary information (ESI) available: The details of the MD protocol, surface parametrization, protein–surface relative orientations, detailed description of the exemplar trajectories together with analysis of the conformations changes, structure overlap figures and movies showing the exemplar trajectories. See DOI: 10.1039/c5cp03910j
Received 6th July 2015, Accepted 21st August 2015
DOI: 10.1039/c5cp03910j
www.rsc.org/pccp
PAPER
Published on 24 August 2015. Downloaded by University of Strathclyde on 12/09/2016 13:34:31.
View Article Online
overlap with the hydrophilic regions; in Fig. 1 the protein is hydrophilic at the top and bottom, and a mixture of hydrophilic and hydrophobic residues is observed in the central part of the protein.
Experimental studies have shown that the protein adsorp-tion is driven by both surface and protein properties18and that
the most important role is played by electrostatic interactions.2
Unfortunately, most of the experimental methods give informa-tion on the properties of an adsorbed protein layer only, while the details regarding protein changes upon adsorption are out of reach of traditional experimental methods. The processes during the early adsorption stages when the first protein– surface contacts are established and how the protein reacts on the surface are crucial for the understanding and control of the adsorption. The main source of these details is computa-tional studies and MD simulations in particular, since the simulated timescale of tens of nanoseconds is adequate for the initial protein–surface interactions. Therefore, in this work we will use MD simulations to provide key information on the adsorption process for single proteins, and use this to interpret our experimental results and provide a consistent picture for the protein layer formation. The combination of simulation and experiment thus provides a powerful methodology to under-stand the process, yielding the underpinning insight needed for future applications of surface functionalization by protein adsorption.
Materials and methods
MD simulations for single-protein systems
All simulations were performed with the NAMD 2.633package using the CHARMM27 force-field, and analyzed using VMD.34
1iee.pdb31 with all four disulphide bridges kept was used as the starting HEWL structure. We prepared twelve simulation systems for various protein–surface orientations denoted as SiO2V1,. . ., SiO2V6 and pSiO2V1,. . ., pSiO2V6 (see ESI†) and
ran 100 ns adsorption trajectories for each of them at pH7.0. The protein (+8e) was initially neutralized by NaCl at an ionic strengthI = 2 102 M, then the surface was added to the systems and finally the entire system was solvated. For the system SiO2V1 some additional simulations with ionic strength
I= 5102M andI= 7101M were performed to further test the model.
The silica surface model was constructed similarly to our recent work35using a (10%1) slab ofa-cristabolite (see ESI†for the details). The SiO2slab model (Fig. S1, ESI†) is neutral and
stoichiometric, but the slab has been cut from a bulk crystal in such a way as to leave siloxide groups (RSiO) at the top of the slab and under-coordinated Si species at the bottom; the slab then has an intrinsic dipole moment across it since we model the material as ions fixed in space. This in turn creates an electric field above the surfaces, mimicking the environment above the charged surfaces observed experimentally.35 Silica
zeta potentials (shown below) reveal the surface charge density which produces an electric field above the surface, which strongly influences how the proteins will interact with the surface. In the case of pSiO2(Fig. S1b, ESI†), the silica slabs
are inverted so that these simulations can be considered as alternative trajectories for SiO2adsorption. Note that in
experi-ments at pH7.0, the silica has a negative zeta potential and we model the surface with siloxide groups exposed to the solvent, so that our SiO2surface model, rather than the pSiO2, is the relevant
one; it is the one the lysozyme adsorbs to as described below.
MD simulations for multi-protein systems
To investigate protein–protein interactions on the surface, three identical HEWL copies were placed in the system, yield-ing a protein concentration of 90 g L1. The initial protein– protein separation was large enough to exclude protein–protein interactions in the solution, and all the proteins were oriented identically with respect to the surface. The entire system was initially neutralized by adding NaCl at an ionic strengthI= 2
102M. All the simulation parameters remained unchanged.
Experiments
Materials.In our studies, lysozyme from chicken egg white was used. This product was purchased from Sigma (L 6876) and used without further purification. For all measurements the HEWL solutions were prepared by dissolving protein powder in an aqueous solution at ionic strength 1102M of NaCl.
All protein solutions were used immediately after preparation and pH was carefully controlled by additions of small amounts of HCl or NaOH solutions.
Support for adsorption.Silica wafers from ON Semiconductor (Czech Republic) were used as the model solid supports. The silica surfaces are hydrophilic with a wettability angle of 181. The electrokinetic characteristics of the bare silica surfaces in
Fig. 1 HEWL structure. Protein surface is shown as a ghost surface colored by partial charge with protein secondary structure elements indicated as a cartoon and colored as follows: red,a-helix A; orange, a-helix B; purple,a-helix C; yellow,a-helix D; pink, C-terminala-helix 310
from domaina; green middlea-helix 310from domainb; blue, sheetb1;
cyan, sheetb2; gray, sheetb3; white, other structures including loops, turns and b-bridges. Arg and Lys residues are shown as licorice and colored in tan and light green, respectively. The black needle indicates the protein dipole moment. Protein termini, N,C-terminal face and active site location are shown by navy objects and annotated. Figures on the right show the distribution of charged (positive – blue, negative – red, neutral – white) and hydrophilic32(hydrophilic – blue, hydrophobic – red) residues.
[image:2.595.51.284.49.181.2]the supporting electrolyte solution (NaCl) were determined from surface zeta potential measurements.3
Methods
MP-SPR. The measurement was performed by using a MP-SPR model Navi 200 (BioNavis Ltd, Finland), which is a goniometer and prism-coupling based device (Krechmer mode) with two independent channels and an integrated peristaltic pump. The MP-SPR apparatus works in a wide angular scan range (401–781) at wavelength 670 nm. The parameters of the silica sensor were obtained by fitting the measured curve using the SPR Navi Data Viewer programme (Bionavis Winspall 3.02 software).
Adsorption or interaction on the sensor surface can be followed by monitoring the intensity changes at a fixed angle or in angular position over time. The surface excess concen-tration of HEWL was calculated according to the equation:
GSPR¼
DYSPRkdLSZ dn dc
wereDYSPRis a change in the SPR angle,kis an SPR instrument constant obtained from calibration,dLSZis the thickness of the
adsorbed layer, and dn/dcis the refractive index gradient. The refractive index gradient used in this work was estimated by Atago refractometer RX-50 000a. For BioNavis SPR instruments thekdvalue is equal 1.0107nm deg1forl= 670 nm and 1.9107nm deg1forl= 785 nm respectively. For the HEWL solution dn/dc= 0.178 cm3g1.
HEWL adsorption on the silica sensor was monitored using the changes in the resonance angle, and the adsorbing surface amount GSPR was calculated as a function of time using the
above equation. Initially the base line was obtained for the supporting electrolyte solution. Then the HEWL solution at concentrationc= 5 ppm, pH range 3.0 to 10.0, ionic strength 1 102 M, was flowed through the SPR cell. It caused the
increase of theGSPRsignal with time up to a plateau value. After 90 min adsorption, the film was rinsed with the supporting electrolyte solution. Slight changes in the GSPR indicate that some of HEWL molecules were reversibly adsorbed onto the sensor surface.
Dynamic light scattering and electrophoretic mobility measurements
The diffusion coefficient of the protein was measured using the dynamic light scattering (DLS) Malvern Nano ZS system. From the diffusion coefficient, the hydrodynamic radius was calcu-lated using the Stokes equation. The electrophoretic mobility was measured using Laser Doppler Velocimetry (LDV) also from Malvern. On the basis of these measurements the zeta potential of the protein solutions was calculated, depending on the pH.18
Surface zeta potential
The surface zeta potential of silica was determined with a Malvern surface zeta potential cell ZEN1020. The cell consists of a height-adjustable sample barrel in which the sample is
placed on a sample holder and is held between two palladium electrodes. A series of zeta potential measurements are then performed in a conventional cuvette and the measurement position within the cell is controlled by adjusting the height of the sample barrel.
Wettability contact angle measurements
Measurements of the wetting angles were carried out using a measuring system with axisymmetric drop shape analysis (ADSA) as described in our earlier work.18,19Several measurements
were taken for the silica surfaces and the average value determined. All measurements were performed at 295 K.
Results and discussion
Details of the adsorption mechanism
In all our MD trajectories, the HEWL rapidly adsorbed to the siloxide-rich SiO2 surface using the adsorption sites primarily
detected by Dismeret al.11First adsorption events are usually
observed within 1 ns of the trajectory and in most cases HEWL is adsorbed after 4 ns (Table S2, ESI†). The protein is considered as adsorbed if at least 3 residues act as anchors. The residue is considered as adsorbed if the distance between any of its hydro-gen atoms to any surface atom is smaller than 5 Å. If the residue adsorption is strong and stable over time the term ‘‘anchor’’ is used.
To quantify the protein orientation on the surface, the angle between its long axis (defined as a line between Ca atoms of Arg128 (N,C-terminal face) and Arg68 (long loop #61–#78)) and the surface normal is used. Therefore the orientation of the adsorbed protein on the surface might be simplistically described as ‘‘side-on’’ (the angle in the range of 01–301), ‘‘between’’ (311–601) and ‘‘end-on’’ (611–901). Note that the long axis orientation is defined using residues located in flexible regions, so that the conformational changes of the protein might affect this long axis direction. We also monitor protein dipole moment orientation with respect to the surface, but find that its direction does not describe the protein orientation on the surface as well as our long axis.
In most trajectories (75%) HEWL adsorbed in a ‘‘between’’ orientation, and this is similar to the results obtained on a previously studied model mica surface.23The remaining 25% of trajectories ended up with the alternative, ‘‘side-on’’ protein orientation. Details regarding the adsorption mechanism for both final orientations observed are provided in the ESI.†It is worth noting that while we have shown here that the ‘‘between’’ orientation is preferred in the one-protein system, the situation is found to be only slightly modified in multi-protein systems where proteins adsorb in isolation,24so that the adsorption of
single proteins provides a good indicator of behavior in a protein monolayer. The same conclusion is made for our multi-protein systems adsorbing at SiO2surface, as discussed below.
Generally, HEWL can feel the surface from the very first stages of the trajectory, including the preparation period (heating and equilibration of the system); the HEWL dipole moment
rapidly re-orientates in the electrostatic field above the siloxide-rich SiO2surface. In general the protein dipole moment
reorienta-tion may be achieved through several mechanisms: (i) slight structural adjustments (mainly in the side chain regions) resulting in changes of protein partial charge distribution without distur-bing the overall structure; (ii) protein rotation; and (iii) substantial conformational changes. In the case of HEWL only the first two are observed, and protein unfolding induced by the electrostatic field in our simulation (0.2 V Å1) is not observed. Initially the dipole moment direction is changed due to very small conforma-tional changes, and then the protein starts to rotate to orient its dipole moment towards the siloxide-rich surface. This exposes the N,C-terminal face, which has been identified as the major adsorp-tion site on negatively charged surfaces,11,23,24to the surface, after which the protein starts to translate towards the surface. Transla-tion and slow rotaTransla-tion are continued until usually 3–4 anchor residues adsorb, which is typically observed within 4 ns (Table S2, ESI†). After this, further translation is no longer possible (the protein is already very close to the surface), and the rotation is strongly reduced (the protein has already reached its preferred orientation). The final part of the trajectories (the final 80–90 ns) show only structural adjustments to the surface and the adsorp-tion of some other residues which usually play a minor role in the whole process (Table S2, ESI†).
In the case of our multi-protein simulations, the relatively low concentration of 90 g L1enabled independent adsorption of each protein with the general mechanism similar to that described above. The preferred protein orientation on the surface is ‘‘between’’ and protein–protein interactions appear at the adsorbed stage, similar to our previous results,24 which reveal that at pH7 and low protein concentration, when the surface is not fully covered, no orientational transition on the surface is observed. The multi-protein systems generally support all the observations made for the isolated protein simulations, and so for clarity we focus only on the latter in the following paragraphs. In summary, the key results from the simulations are that the protein rapidly adopts its preferred orientation at the negatively charged surface in the initial stages of adsorption. This is deter-mined by electrostatic forces. It is worth noting that in 6 trajectories from the group of ‘‘between’’ adsorption the first adsorbing residue is Arg128 (67%), while in the remaining trajectories this role is played Lys1. Both residues are located in the terminal loop region which has to detach from the protein before the residue adsorbs. One could expect that Lys1 adsorption should be easier because it is the first residue, while Arg128 is the second, if counting from the N-terminus. The opposite result suggests that Arg has higher affinity to SiO2surface than Lys, nevertheless in both cases the
affinity is high. This agrees with other work in the literature regarding the key residues for protein adsorption at charged surfaces23–26and silica nanoparticles.27
Structural changes upon adsorption
The strong electrostatic HEWL attraction to the SiO2 surface
results in some protein flattening on SiO2, which is in line with
recent results reported by Xu et al.36 The flattening induces some minor structural changes such as alterations in both
a-helices 310,a-helix D and all threeb-sheets, which are prone
to unfold (Fig. S4 and Table S2, ESI†). Nevertheless, alterations of the HEWL secondary structure elements do not greatly influence the tertiary structure (e.g. the protein’s geometric shape, or the geometric relations between secondary structure elements) and in particular the active site geometry. As expected, overlaps of protein initial and final structure (shown in Fig. S5, ESI†) indicate that the biggest changes come from loops and terminal regions (N,C-terminal face). The relatively large RMSD values (the most frequent value of 3.0–3.5 Å, while the average value of 4.4 Å; details given in the ESI†) agree well with Larsericsdotteret al.who reported that HEWL adopts a flexible conformation on the silica surface.37 Similar conclusion has been made in the case of HEWL adsorption at the mica surface model.23,24,26 The more advanced protein structural changes observed at the SiO2 surface model reflect a higher HEWL
affinity to SiO2comparing to the mica model.
Adsorption driving force
Analysis of all trajectories obtained (Table S2, ESI†) leads us to the list of the most important anchor residues (in order of the importance): Arg128, Lys1, Arg5, Arg125, Lys13, Arg14, Arg112, Arg114, Lys116, Lys33, Arg45, Arg21, Arg68 and Arg73. This list is completed by residues acting as an anchor only accidentally: Asn19, Asn77, Ser85, Ser86 and Asn93. All of the aforementioned residues are strongly hydrophilic (Arg, Lys, Asn) or hydrophilic (Ser), polar and positively charged (Arg, Lys), or polar and neutral (Ser, Asn). This indicates that both electrostatic and hydrophobic interactions may play a certain role in the adsorption process. The other residues listed in Table S2 (ESI†) seem to play a minor role and reflect contacts established due to their close locality to the surface rather than real, strong propensity to interact with the surface. It is worth to note that both major (N,C-terminal face) and minor (Arg68 and surrounding) adsorption sites are used, however the minor one has, as expected, less important role for the adsorption. It agrees well with previous experimental11
and computational results.23,24 The large number of anchors detected in the case of HEWL adsorption at the SiO2 surface
model indicates that the adsorption is strong.
The list of the major anchor residues, together with the information regarding protein dipole moment reorientation in the electrostatic field produced by the SiO2surface, leads to the
conclusion that at pH7 the main HEWL adsorption driving force is electrostatic. Nevertheless, to draw a complete adsorp-tion picture we should not forgot about the role of hydro-phobicity, which moderates the protein–surface interactions. This agrees well with our experimental results presented in the next section.
As shown in Fig. 2, the positively charged HEWL adsorbs on the hydrophilic and negatively charged SiO2surface model in
the orientation that maximizes the contact of positively charged residues with the surface. Simultaneously, the most hydrophilic residues are exposed towards the surface (on one protein side) and towards the solution (the opposite protein side), while in the middle we can see a mixture of hydrophobic and hydro-philic residues. Therefore, although it is driven by electrostatic
forces, adsorption of the protein naturally increases the phobicity of the surface. The role of electrostatic and hydro-phobic forces in HEWL adsorption on SiO2 surface can be
validated by simulations and experiments prepared in various ionic strengths.38Our simulations in ionic strengthI= 5102M andI= 7101M indicate that the main adsorption driving force is electrostatics: due to increased electrostatic screening the adsorption is observed much later (I = 5 102 M) or even is
not observed at all in 100 ns timescale (I= 2102M), although
we do expect it occur if the simulation times could be consider-ably extended. Our recent experiments support the above conclu-sion. Although the results are preliminary, Crystal Microbalance (QCM) and SPR experiments indicate that HEWL adsorption is indeed sensitive to ionic strength at constant pH and the amount of protein adsorbed decreases with increased ionic strength.
HEWL monolayer on surface
In Table 1 we calculate the surface amount of a monolayer of adsorbed HEWL. A range of values are possible depending on the adsorption model assumed. Our simulations indicate that the most common adsorption orientation is the ‘‘between’’ one, but the ‘‘side-on’’ one is also possible; we do not find ‘‘end-on’’ in our work. It is possible that in a crowded monolayer environment, the orientation changes to promote ‘‘end-on’’, however we did not observe this both in current and our previous multi-protein simulations.24
Previous work by Sander et al. use the Random Sequential Adsorption model for the monolayer,39however this is at odds with AFM images of lysozyme adsorption onto charged mica surfaces which show that close-packing models are more appropriate.21,22,40
Therefore our best estimate for the protein surface amount of an adsorbed monolayer is 203–288 ng cm2. This figure is for
the protein only, without entrained solvent.
MP-SPR, wettability and zeta potential measurements
Recently it was shown that HEWL adsorption on silicon surfaces can be controlled by pH in the range of 4–10;41 we have also checked the pH effect on the amount of adsorbed protein. In Fig. 3 we show the surface amount of HEWL adsorbed to silica obtained by MP-SPR. This measurement is sensitive to protein material and not to the entrained solvent, and so can be com-pared to the calculations presented in Section 4 above. At low pH, the adsorbed mass is substantially below that expected for a close-packed monolayer, but it approaches the expected values at higher pH10. The adsorbed amount decreases dramatically above pH10. In all cases, there is very little desorption upon rinsing of the surface, demonstrating the protein adsorption is strong, as indicated above in our simulations.
At pH4–9, it appears that the adsorbed protein does not form a complete, compact monolayer. Similarly at high pH 4 10, there is sub-monolayer adsorption. We probe the reasons for this incomplete layer adsorption below. Note that the pH effect was not visible in MD simulations, where we used only the standard pH7. Currently we are working on the effect of rinsing carried out under various conditions.
Our contact angle measurements (Fig. 4) of bare SiO2surface
gave the contact angle of 181, showing that the surface is very hydrophilic. By measuring how the contact angle of the silica changes following exposure to protein solutions, we obtain a complementary view on the protein adsorption process.
Fig. 2 A typical final HEWL adsorption stage. Both SiO2and HEWL are
shown using a surface representation. SiO2is sown in green while the
protein is colored by hydropathy index32(left) and by total residue charge
[image:5.595.49.284.47.265.2](right) using the colour scheme of Fig. 1. The top and bottom figures show the plan and the side view, respectively. For clarity water molecules are not shown.
Table 1 HEWL monolayer surface amount measured for various protein orientations at a planar surface. Parameters a and b describe the HEWL footprint geometry;Apis the surface area (or footprint) occupied by the
protein;YRSA
andYCP
are the surface packing fractions of ellipsoids for Random Sequential Adsorption (RSA) and close-packing (CP) models;GRSA
andGCP
denote the adsorbed protein mass concentration for monolayer coverage in the RSA and CP models respectively
Orientation
Ap[nm2] 10.59 7.49 7.07 l=b/a 0.667 0.938 1.00 YRSA 0.577 0.558 0.547 YCP 0.907 0.907 0.907 GRSA[ng cm2] 129 177 184 GCP[ng cm2] 203 288 305
[image:5.595.304.553.120.338.2]As Fig. 4 indicates, at pH4 the maximal contact angle measured after 120 min exposure of the SiO2 surface to the
HEWL solution is 251and 301for protein concentration 0.5 and 5 ppm, respectively. These relatively small contact angles again suggest that there is incomplete monolayer adsorption, so that a significant proportion of the bare surface remains exposed to the water. This is in agreement with the SPR results above (Fig. 3), and seems to be consistent with island formation at the surface. Since a low contact angle is observed for both protein concentrations, we conclude that the amount of HEWL available for adsorption is not a limiting factor.
At pH7 a different scenario is apparent. At this pH the contact angle alterations caused by HEWL adsorption are significant (Fig. 4).
The final contact angles observed after 120 min exposure of the surface to the protein solution are 501 and 551 for protein concentration 0.5 and 5 ppm, respectively. Here the HEWL adsorption substantially increases the hydrophobicity of the modi-fied surface; under these conditions the contact angle is signifi-cantly greater than that of the bare surface (181). The difference between the 120 min angles obtained for both concentrations is most probably caused by an (as yet) incomplete layer formation at 0.5 ppm, since the slope of the plot decreases over the time as the adsorption progresses, but it does not fully level out within 120 min. In the case of the higher protein concentration the plot levels after 20 min of the experiment, suggesting that the surface is saturated and the adsorption is complete.
In Fig. 5 we show results for the zeta potential of the bare SiO2surface and the HEWL at different pH. For the surface the
zeta potential is65.5 mV at pH7, and +9.2 mV for HEWL. In these conditions, the electric field created by the SiO2surface
(equivalent surface charge density of0.12 e nm2at 0.01 M NaCl, which in our simulation is determined by the silicon and oxygen partial charges and the simulation cell dimensions) is strong enough to attract the positively charged HEWL. The surface tends to neutralize its negative potential and one of the ways to do that is adsorb the positively charged protein. As the pH is increased to 10, the smaller effective charge on the HEWL means that a higher surface amount can be adsorbed until complete monolayer coverage is achieved. Note that the adsorp-tion remains largely irreversible, so the results reflect the increased capacity of the surface as pH increases to 10. Even though the strength of the electrostatic interactions will be decreasing with increasing pH, it clearly remains strong enough for irreversible adsorption. Of course, the HEWL and the surface attract the buffer counter ions too and organizes the surface water layers, as observed in the MD simulations, and this complicates the picture.
Above pH7, the silica surface zeta potential plateaus at about
70 mV, whereas the HEWL zeta potential continues to decrease.
Fig. 3 Surface mass density of HEWL (in ng cm2) adsorbed at the silica
surface obtained from MP-SPR in the pH range 4 to 11.5. The mass density of close-packed (CP) and Random Sequential Adsorption (RSA) mono-layers of protein adsorbed in the side-on orientation are shown by dotted lines.
Fig. 4 Contact angle changes in time measured for various HEWL con-centrations at pH4 and pH7. Green circles: HEWL concentration 5 ppm and pH 4; red circles: HEWL concentration 5 ppm, pH 7, yellow triangles: HEWL concentration 0.5 ppm and pH 4; navy triangles: HEWL concen-tration 0.5 ppm and pH7. Insets show the shape of the water drop on the SiO2surface modified in given conditions.
Fig. 5 Zeta potential (in mV) measured for HEWL (red) and bare SiO2
surface (purple) at pH range 3 to 10.5 in ionic strength 1102M of NaCl.
The red and blue vertical dotted lines point the isoelectric point of SiO2
(at pH 3.0) and HEWL (at pH 10.0), respectively.
[image:6.595.52.286.45.214.2] [image:6.595.50.288.462.649.2] [image:6.595.305.551.497.670.2]Above pH10 HEWL is no longer positive and so charge compensation and electrostatic interactions cannot play a role in the adsorption. This explains the sharp decrease in adsorbed protein amount above pH10 that we observe in our MP-SPR measurements (Fig. 3). The small amount of protein adsorption (88.4 ng cm2and 33.3 ng cm2
at pH11 and 11.5, respectively) indicates a role for hydrophobic interactions, since the electrostatic component of the adsorption forces should be weakly repulsive here. Our MD simulations have indicated that hydrophobicity does have a role to play in adsorp-tion, albeit a minor one at the lower pH7. We note that since electrostatics does not drive the adsorption at pH 4 10, the adsorbed protein may no longer be oriented according to its dipole moment,35 and the dipole moment in any case will be different to that below the isoelectric point.
At low pH, the zeta potential for the surface decreases whilst that of the HEWL becomes still more positive. Therefore we would expect to find that the surface adsorbs decreasing amounts of the charged protein due to the decreasing surface charge density as pH is reduced. Indeed, returning to Fig. 3 we find a decrease in the adsorbed surface mass density as the pH is reduced. Together this provides a convincing picture for the dominant role that electrostatics plays in the adsorption, in agreement with our MD simulations.
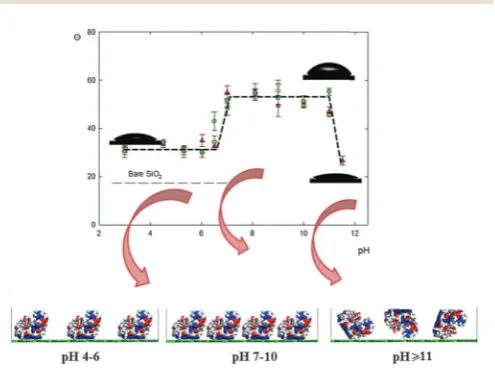
Our conclusion about how the protein adsorption depends on pH is nicely summarized by plotting the contact angle of the HEWL-modified SiO2surface as a function of pH in Fig. 6. Here
the long-time saturated adsorption surfaces are used. The contact angle for the modified surface is at the level of 331at pH range 3 to 6.5, indicating incomplete surface coverage by the protein. At about pH7, the contact angle rapidly increases to B551 indicating the formation of a compact monolayer. However, above pH10 the contact angle again drops, to about 271at pH11.5, so that again the extent of monolayer adsorption is greatly reduced.
All our findings are summarized in the lower part of Fig. 6. At low pH, islands of HEWL at the SiO2surface are created and
the main driving force is electrostatics, only slightly modified by hydrophobic interactions. At pH10, a complete HEWL monolayer is created. Note that in both cases we believe that the protein orientation on the surface is the same, namely ‘‘between’’ or ‘‘side-on’’, and not the ‘‘end-on’’ orientation. It is worth to mention that the difficulty in describing HEWL orientation on the surface can arise from HEWL shape depen-dence on pH, further MD simulations are required to clarify this issue. Finally at pH410 adsorption cannot be driven by electrostatics, instead it is driven by hydrophobic forces, so that the HEWL is sparsely distributed, its orientation on the surface is unknown, perhaps non-specific and possibly even unfolded.
Conclusions
In this work we have presented a series of fully atomistic MD simulations of HEWL adsorption at a model silica surface, together with MP-SPR and zeta potential measurements of bare SiO2and the HEWL itself as a function of pH. We have
also presented results of wettability measurements of HEWL adsorbed on a SiO2surface. Together these provide a picture for
the formation of the adsorbed protein layers at various pH, and the role that electrostatics plays in the process.
The MD simulations indicate that surface adsorption requires minor conformational changes of HEWL, with slight flattening on the surface. It is not accompanied with substantial tertiary structure changes, nor substantive changes to the structure of the protein’s active cleft, which implies that HEWL can remain active when adsorbed. Surface adsorption strongly reduces the HEWL mobility, nevertheless from our previous work we anti-cipate that the protein can slowly diffuse on the surface,26and
therefore cluster together to create close-packed islands and monolayers. Isolated HEWL typically adsorbs by its N,C-terminal face in the ‘‘between’’ orientation (the angle between protein long axis and the surface normal is in the range of 311 to 601). Adsorption is strong and rapid, driven by electrostatics with a minor role played by hydrophobicity. Adsorbed protein exposes hydrophilic residues to the solution, but also hydrophobic ones which tend to be around the perimeter when viewed from above, so that an adsorbed compact monolayer will create a more hydrophobic surface when compared to the bare silica.
Experimentally, we find that in the pH range where the SiO2
surface has a substantial negative zeta potential and the HEWL is positively charged, the surface tends to compensate its charge by adsorbing HEWL. In the vicinity of pH10, at the HEWL isoelectric point where electrostatic inter-protein repul-sion is minimized, this leads to an adsorbed mass consistent with a compact, near-complete monolayer. The adsorption appears to be irreversible, which is to be expected from the strong adsorption observed in the MD simulations.26At pH410, the HEWL is no longer positive, the electrostatics no longer favor surface adsorption, and we find a small adsorption mass. In contrast, at low pH4–6, the zeta potential of the silica surface is
Fig. 6 Contact angle measured for bare and HEWL-modified SiO2surface
at pH range 3 to 11. The insets into the plot shows the water drop shape created on the HEWL-modified SiO2surface. Green, yellow and red points
in the plot indicate the contact angle obtained for protein concentration 1000 ppm, 10 ppm and 5 ppm, respectively. The figures at the bottom of the picture shows the schematic HEWL orientation on the SiO2surface at
low (left), intermediate (middle) and high (right) pH.
[image:7.595.45.293.460.644.2]less negative and we again find sub-monolayer adsorption, since now the surface needs to adsorb a sub-monolayer of protein to compensate its charge. The picture that emerges for the complete-ness of the adsorbed monolayer is consistent with the modified surface hydrophobicity observed using contact angle measurements. In the literature, it is often assumed that the adsorbed protein follows the RSA model, and further that the proteins re-orientate at the surface when the adsorbed layer nears completion and becomes crowded. However, we have no evidence that these assumptions are necessary in our work, provided we assume that the protein monolayer is densely packed as a result of surface diffusion. This is consistent with a body of work into HEWL adsorption onto mica, both through Atomic Force Microscopy21,22,39and MD simulation.24,26We therefore believe that the picture we present here for HEWL adsorption to silica provides a consistent understanding of protein adsorption to negatively charged surfaces.
Acknowledgements
The presented work was supported by Grant NCN OPUS24 2012/07/B/ST5/00767. Part of MD results were obtained using the EPSRC funded ARCHIE-WeSt High Performance Computer (www.archie-west.ac.uk); EPSRC grant no. EP/K000586/1. The authors thank the A.P. Instruments and Malvern Company for the opportunity to use the Malvern surface potential cell ZEN 1020 apparatus to measure the surface zeta potential of the bare silica surfaces.
Notes and references
1 N. Huebsch and D. Mooney,Nature, 2009,462, 426–432. 2 W. Norde and A. C. I. Anusiem, Colloids Surf., 1992, 66,
73–80.
3 P. J. Scales, F. Grieser, T. W. Healy, L. R. White and D. Y. C. Chan,Langmuir, 1992,8, 965–974.
4 T. J. Su, J. R. Lu, R. K. Thomas, Z. F. Cui and J. Penfold, Langmuir, 1998,14, 438–445.
5 T. J. Su, J. R. Lu, R. K. Thomas, Z. F. Cui and J. Penfold, J. Colloid Interface Sci., 1998,203, 419–429.
6 S. M. Daly, T. M. Przybycien and R. D. Tilton, Langmuir, 2003,19, 3848–3857.
7 J. R. Lu, M. J. Swann, L. L Peel and N. J. Freeman,Langmuir, 2004,20, 1827–1832.
8 M. van der Veen, W. Norde and M. C. Stuart,Colloids Surf., 2004,35, 33–40.
9 S. Z. Qiao, H. Djojoputro, Q. Hu and G. Q. Lu,Prog. Solid State Chem., 2006,34, 249–256.
10 S. M. Daly, T. M. Przybycien and R. D. Tilton,Colloids Surf., B, 2007,57, 81–88.
11 F. Dismer and J. Hubbuch,J. Chromatogr. A, 2007,1149, 312–320. 12 M. van der Veen, M. C. Stuart and W. Norde,Colloids Surf.,
2007,54, 136–142.
13 F. Evers, K. Shokuie, M. Paulus, C. Sternemann, C. Czeslik and M. Tolan,Langmuir, 2008,24, 10216–10221.
14 B. Jachimska, M. Wasilewska and Z. Adamczyk,Langmuir, 2008,24, 6866–6872.
15 K. P. Fears, B. Sivaraman, G. L. Powell, Y. Wu and R. A. Latour, Langmuir, 2009,25, 9319–9327.
16 F. Felsovalyi, P. Mangiagalli, Ch. Bureau, S. K. Kumar and S. Banta,Langmuir, 2011,27, 11873–11882.
17 H. Hahl, F. Evers, S. Grandthyll, M. Paulus, C. Sternemann, P. Loskill, M. Lessel, A. K. Huseken, T. Brenner, M. Tolan and K. Jacobs,Langmuir, 2012,28, 7747–7756.
18 B. Jachimska, A. Kozlowska and A. Pajor-Swierzy,Langmuir, 2012,28, 11502–11510.
19 B. Jachimska and A. Pajor,Bioelectrochemistry, 2012,87, 138–146. 20 A. G. Richter and I. Kuzmenko,Langmuir, 2013,29, 5167–5180. 21 P. A. Mulheran, D. Pellenc, R. A. Bennett, R. J. Green and
M. Sperrin,Phys. Rev. Lett., 2008,100, 068102.
22 D. Pellenc, R. A. Bennett, R. J. Green, M. Sperrin and P. A. Mulheran,Langmuir, 2008,24, 9648–9655.
23 K. Kubiak-Ossowska and P. A. Mulheran, Langmuir, 2010, 26, 15954–15965.
24 K. Kubiak-Ossowska and P. A. Mulheran,J. Phys. Chem. B, 2011,115, 8891–8900.
25 A. Steudle and J. Pleiss,Biophys. J., 2011,100, 3016–3024. 26 K. Kubiak-Ossowska and P. A. Mulheran, Langmuir, 2012,
28, 15577–15585.
27 C. Mathe, S. Devineau, J. C. Aude, G. Lagniel, S. Chedin, V. Legros, M. H. Mathon, J. P. Renault, S. Pin, Y. Boulard and J. Labarre,PLoS One, 2014,8, e81346.
28 E. Pastor, E. Matveeva, A. Valle-Gallego, F. M. Goycoolea and M. Garcia-Fuentes,Colloids Surf., B, 2011,88, 601–609. 29 H. R. Luckarift, J. C. Spain, R. R. Naik and M. O. Stone,Nat.
Biotechnol., 2004,22, 211–213.
30 N. Carlsson, H. Gustafsson, Ch. Thorn, L. Olsson, K. Holmberg and B. Akerman,Adv. Colloid Interface Sci., 2014,205, 339–360. 31 C. Sauter, F. Otalora, J. A. Gavira, O. Vidal, R. Giege and J. M. Garcia-Ruiz,Acta Crystallogr., Sect. D: Biol. Crystallogr., 2001,57, 1119.
32 J. Kyte and R. F. Doolittle,J. Mol. Biol., 1982,157, 105–132. 33 J. C. Phillips, R. Braun, W. Wang, J. Gumbart, E. Tajkhorshid, E. Villa, Ch. Chipot, R. D. Skeel, L. Kale and K. Schulten, J. Comput. Chem., 2005,26, 1781–1802.
34 W. Humphrey, A. Dalke and K. Schulten, J. Mol. Graphics, 1996,14, 33–38.
35 K. Kubiak-Ossowska, P. A. Mulheran and W. Nowak,J. Phys. Chem. B, 2014,118, 9900–9908.
36 K. Xu, M. M. Ouberai and M. E. A. Welland,Biomaterials, 2013,34, 1461–1470.
37 H. Larsericsdotter, S. Oscarsson and J. Bujis, J. Colloid Interface Sci., 2004,276, 261–268.
38 J. Kim, R. J. Desch, S. W. Thiel, V. V. Guliants and N. G. Pinto,J. Chromatogr. A, 2011,1218, 6697–6704.
39 M. Sander, M. Madliger and R. P. Schwarzenbach,Environ. Sci. Technol., 2010,44, 887–8876.
40 D. T. Kim, H. W. Blanch and C. J. Radke,Langmuir, 2002,18, 5841–5850.
41 H. Lei, M. Wang, Z. Tang, Y. Luan, W. Liu, B. Song and H. Chen,Langmuir, 2014,30, 501–508.