City, University of London Institutional Repository
Citation: Reyes-Aldasoro, C. C., Wilson, I., Prise, V. E., Barber, P. R., Ameer-Beg, M.,
Vojnovic, B., Cunningham, V. J. and Tozer, G. M. (2008). Estimation of apparent tumor vascular permeability from multiphoton fluorescence microscopic images of P22 rat sarcomas in vivo. Microcirculation, 15(1), pp. 65-79. doi: 10.1080/10739680701436350This is the accepted version of the paper.
This version of the publication may differ from the final published
version.
Permanent repository link: http://openaccess.city.ac.uk/5510/
Link to published version: http://dx.doi.org/10.1080/10739680701436350
Copyright and reuse: City Research Online aims to make research
outputs of City, University of London available to a wider audience.
Copyright and Moral Rights remain with the author(s) and/or copyright
holders. URLs from City Research Online may be freely distributed and
linked to.
City Research Online: http://openaccess.city.ac.uk/ [email protected]
Title:
Estimation of Apparent Tumour Vascular Permeability from Multiphoton Fluorescence
Microscopic Images of P22 Rat Sarcomas in vivo.
Authors:
Constantino Carlos Reyes-Aldasoro a; Ian Wilson b; Vivien E. Prise b; Paul R.Barber b;
Simon M. Ameer-Beg c; Borivoj Vojnovic b; Vincent J. Cunningham d; Gillian M. Tozer a
Address:
a Cancer Research UK Tumour Microcirculation Group, Academic Unit of Surgical
Oncology, The University of Sheffield, Sheffield, UK
b Mount Vernon Hospital, Gray Cancer Institute, Northwood, Middlesex, UK
c The Richard Dimbleby Department of Cancer Research, Division of Cancer Studies,
King's College, London, London, UK
d GlaxoSmithKline, Clinical Imaging Centre, Imperial College, London, UK
*Corresponding author.
E-mail address: [email protected]
Telephone: 00 44 (0) 114 271 2850
Fax: 00 44 (0) 114 271 3791
Running Title:
Measurement of Tumour Vascular Permeability
Acknowledgements:
ABSTRACT
Objective: To develop an image processing-based method to quantify the rate of
extravasation of fluorescent contrast agents from tumour microvessels, and to
investigate the effect of the tumour vascular disrupting agent, combretastatin A-4-P
(CA-4-P), on apparent tumour vascular permeability to 40 kDa fluorescein isothiocyanate
(FITC) labelled dextran.
Methods: Extravasation of FITC-dextran was imaged in three dimensions over time
within P22 sarcomas growing in dorsal skin flap ‘window chambers’ in BDIX rats using
multiphoton fluorescence microscopy. Image processing techniques were used to
segment the data into intra- and extra-vascular regions or classes. Quantitative
estimates of the tissue influx (vascular leakage) rate constant, Ki, were obtained from the
time courses of the fluorescence intensitiesin the two classes. Apparent permeability, P,
was calculated, assuming Ki =PS/V, where Sis vascular surface area in tumour volume
V.
Results: Combining image processing and kinetic analysis algorithms with multi-photon
fluorescence microscopy enabled quantification of the rate of tumour vascular leakage,
averaged over a large number of vessels. Treatment with CA-4-P caused a significant
increase in Ki from 1.13 ± 0.33 to 2.59 ± 0.20 (s
-1
x 10-4; mean ± SEM), equivalent to an
increase in P from 12.76 ± 3.36 to 30.94 ± 2.64 (cm s-1 x 10⁻⁷).
Conclusions: A methodology was developed that provided evidence for a
CA-4-P-induced increase in tumour macromolecular vascular permeability, likely to be central to
its anti-cancer activity.
Keywords: Vascular permeability, multiphoton fluorescence microscopy, combretastatin,
INTRODUCTION
Vascular permeability of blood vessels in tumours is of great interest for the treatment
of cancer for three main reasons. First, the vascular wall represents a major barrier to
the entry of high molecular weight anti-cancer agents into tumour tissue [1]; second, it
controls the tumour microenvironment thus affecting tumour progression [2] and third,
changes in its barrier function may provide an early indicator of vascular damage
following treatment with anti-angiogenic or vascular disrupting drugs [3]. Despite the
importance of tumour vascular permeability [4], little attention has been paid to its
quantitative measurement. In some cases, permeability is simply observed by using a
marker, for example Evans blue, an albumin-binding dye, and determining if the marker
is present or absent in a specific tissue region [5-7]. Although this is useful in normal
tissues, where any significant extravasation is suggestive of vascular damage or in
determining breakdown of the blood-brain barrier following tumour growth, it is not
appropriate for determining the effects of treatment in tumours, where even unperturbed
blood vessels are highly permeable. In this case, a fully quantitative method is required.
The first aim of the present work was to develop methodology to quantify the rate of
extravasation of an intravenously-administered macromolecular fluorescent marker from
microvessels over a large tumour volume, using multiphoton fluorescence microscopy.
The advent of multiphoton fluorescence microscopy has allowed 3-D optical imaging in vivo of tissue at greater depth than confocal microscopy, with very precise geometric
localisation of the fluorophore and high spatial resolution [8]. This minimizes problems
such as scattered light from out-of-focus regions, associated with conventional
fluorescence microscopy [9]. To take full quantitative advantage of this technique we
have applied image processing and kinetic analysis techniques to obtain estimates of Ki,
the vascular leakage or tissue influx rate constant into tumour tissue of intravenously
the vascular volume, Vvess, within a given tumour volume, V, were measured to enable
calculation of an apparent vascular permeability, P.
The second aim of the study was to investigate the effect of the tumour vascular
disrupting agent, combretastatin A-4-phosphate (CA-4-P) on tumour vascular
permeability. CA-4-P is a tubulin binding agent, which has been shown to depolymerise
the tubulin cytoskeleton of vascular endothelial cells in vitro, within minutes of drug
exposure, and to selectively shut down tumour blood flow in vivo [10-13]. These vascular disrupting effects led to its entry into clinical trials as an anti-cancer agent in 1998, where
it is currently being tested in combination with conventional chemo- and radiotherapy. It
has been hypothesised from in vitro data [14] that an increase in vascular permeability to
macromolecules is an early effect of CA-4-P in vivo, indicative of vascular damage.
Indeed, we have previously reported a relative increase in tumour extravasation of a
macromolecular radiotracer following CA-4-P treatment [12]. However, we were unable
to obtain absolute rates of extravasation in that study and the spatial resolution was
poor. Here we report application of the above multiphoton fluorescence microscopy
technique to the quantitative estimation of the apparent vascular permeability of tumour
micro-vessels following CA-4-P treatment.
MATERIALS AND METHODS
Overview
The P22 rat sarcoma was grown in transparent dorsal skin flap ‘window’ chambers to
provide optically accessible tumour preparations for multiphoton fluorescence
microscopy. 3-D images of the leakage of intravenously administered 40 kDa
FITC-dextran into the tumour extra-vascular space were obtained over time in CA-4-P and
into intra- and extra-vascular tissue classes. A kinetic analysis was applied to the
time-courses of fluorescence in these classes to obtain estimates of parameters relating to
vascular permeability.
Animals and Tumours
The experiments were performed in male BDIX rats aged 6-8 weeks, weighing
approximately 200 g. All animals were bred in house. All animal procedures were carried
out in accordance with the UK Animals (Scientific Procedures) Act 1986 and with
approval of the Ethical Review Committee of the Gray Cancer Institute. Single small
fragments (approximately 0.5 x 0.5 x 0.5 mm3) of early generation P22 rat sarcomas
grown subcutaneously in donor rats were placed in contact with connective tissue held in
transparent window chambers surgically implanted into the dorsal skin flap of recipient
rats. Details of this technique have been described previously [12]. Immediately following
surgery, animals were given an intra-peritoneal (i.p.) injection of 2 ml of dextrose saline
and allowed to recover from anaesthesia on a warm pad. The animals were
subsequently kept in a warm room, 32 – 34 oC, until the day of the experiment. The
tumours were allowed to establish over a period of 10-14 days after surgery to a
diameter of 2 to 4 mm.
Preparation of Fluorophores
FITC-dextran (40 kDa, 0.013Mol FITC/Mol dextran) (Sigma, Poole, UK) was made up
in phosphate buffered saline (PBS) and washed through a 30 kDa spin filter at 4000 rpm
in a Sorvall RC-5B refrigerated fixed angle superspeed centrifuge (Dupont, Stevenage,
UK). Two washes of 4 hrs and one of 16 hrs were applied to remove any free FITC or
low molecular weight contaminants. The high molecular weight component was
re-suspended in PBS after each wash and used for investigation of fluorophore stability or
Fluorophore stability
Non-tumour-bearing rats were surgically anaesthetized using a mixture of
fentanyl-citrate (0.32 mg/kg) and fluanisone (10 mg/kg; Hypnorm; Janssen Animal Health) and
midazolam (5 mg/kg; Hypnovel; Roche, Welwyn Garden City, United Kingdom) and kept
warm with a thermostatically controlled heating blanket. One tail vein and one tail artery
were cannulated and 0.1ml of heparin (100 IU) followed by 40 mg/kg (20 mg/ml)
FITC-dextran were injected intravenously. Blood samples (0.5 ml) were taken via the arterial
cannula at various time-points up to 2 hours following fluorophore injection. Blood cells
were removed by spinning at 3000 rpm for 5 minutes. 0.2 ml of plasma from each
sample was diluted to 1ml in PBS and centrifuged through a 30 KDa spin filter (Millipore,
Watford, UK), separating the plasma into two fractions, one containing high molecular
weight (> 30 KDa) and one containing low molecular weight (< 30 KDa) fluorescent
components. Both high and low molecular weight components were then measured for
fluorescence intensity using a spectrometer (Perkin Elmer, Beaconsfield, UK). Samples
were excited at 450 nm and fluorescent emission collected between 470 nm and 650
nm.
Multiphoton Intravital Microscopy
Rats were surgically anaesthetized and kept warm as above. A tail vein was
cannulated to permit intra-venous administration of the dextran. 0.5 ml
FITC-dextran, at a concentration of 20mg/ml, was injected via the venous cannula as a bolus
over 2-3 seconds, immediately prior to image acquisition. Image acquisition was
instigated as soon as the microscope could be focused on the fluorescence,
Microscopy was performed with a multiphoton microscope system developed
in-house, although commercial systems with similar specifications are now available. The
in-house system was based on a modified Bio-Rad MRC 1024MP workstation,
comprising a solid state pumped (10 W Millennia X, Nd:YVO4, Spectra Physics), self
mode locked Ti:Sapphire (Tsunami, Spectra Physics) laser system, a focal scan head,
confocal detectors and an inverted microscope (Nikon TE200). Enhanced detection of
the scattered component of the emitted (fluorescence) photons is enabled by the use of
three, non-descanned detectors, situated in the re-projected stationary plane. Due to
geometrical constraints of the animal model, a long working distance objective was used;
all images were captured with a 10x Nikon Plan Fluor objective (16 mm WD, 0.3 NA).
Data collection
CA-4-P (30 mg/kg) or an equivalent volume of saline was administered i.p.
immediately prior to injection of fluorophore. Multiphoton fluorescent images were
collected every 4 minutes, at a working excitation wavelength of 890 nm. Emission
wavelength was 530 nm to 540 nm.
The 3-D data consisted of 512 x 512 x 11 voxels each of volume 2.6 x 2.6 x 4.5 µm3.
Fluorescence intensity, captured by the acquisition process, was assumed to be directly
proportional to the number of molecules of the fluorescent marker. 15 time-frames were
acquired over 60 minutes. Figure 1 shows the acquisition process graphically and
illustrates the marker leaking from the intra-vascular tissue over time. A total of 15
Image Pre-processing
Pre-processing of the data was required to address two important problems:
presence of noise, and tissue movement with time. All the image and statistical
processing was performed in MATLAB (The Mathworks, USA ©).
In order to reduce the noise in the 3-D volumes, a standard Oct Tree [15] averaging
was performed, where the intensities of a number of neighbouring elements, 8 voxels in
our case, are averaged. This procedure was carried out once, so that the final analysis
was performed on 256 x 256 x 6 voxels.
In order to correct for tissue movement, a tissue registration process was employed.
The window chamber glass limited the movement of the tissue in the third dimension,
reducing the degrees of freedom. Therefore, in most cases, the registration (i.e.
correction of the image motion) was performed with a rigid body registration. In these
cases, the whole image in each time-frame was moved and aligned to match the image
in the previous time-frame. In a few cases, the tissue movement was not uniform, with
parts of the image moving in different directions over time. In these cases, the data was
partitioned into 15 x 15 regions of 32 x 32 x 6 voxels with 50% overlap and a local rigid
body registration was performed for each of them individually. For both scenarios, the
displacement of the data was analysed and corrected through cross correlation [16].
Cross correlation is a measurement of similarity or ‘matching’ between two signals; if two
signal are identical, their relative similarity at the origin will be 1; if they are different,
relative similarity will be less than 1, and if one of them has moved, the relative similarity
will present a maximum value displaced from the origin according to the movement of
the signal.The accuracy of the registration was assessed visually, which is a generally
Segmentation
Following pre-processing corrections, the images corresponding to the first time point
were segmented into intra-vascular and extra-vascular classes using a double threshold
masking technique as described below. The masks, defining the class to which each
voxel from the corresponding intensity image belonged were applied to all subsequent
intensity images of the same tumour in order to obtain intensity versus time within both
intra-vascular and extra-vascular classes.
Voxels below a lower threshold were classified as extra-vascular, and those above a
higher threshold were classified as intravascular. Lower and higher thresholds were first
set to enclose 50% and 95% of the voxels respectively. Optimisation of the threshold
levels for each data set was then obtained by manual adjustment based on a visual
inspection of the segmented classes. The remaining voxels, between these two levels,
were then classified as follows.
The intra-vascular class was smoothed by a convolution (i.e. a weighted average of
each voxel and its neighbours sometimes called a Local Energy Function) with a [3 x 3 x
3] Gaussian kernel [18]. This gives rise to a boundary region, defined as voxels adjacent
to the intra-vascular class, hence allowing the surface area (in cm2) of the vessels (S) to
be calculated. The volume (in cm3) of the vessels (Vvess) was calculated by the sum of the
number of voxels of the intra-vascular class. Finally, isolated elements were eroded and
reassigned to the class of their neighbours [19]. Remaining voxels were classified as
uncertain.
Validation of the segmentation algorithm
Images from the first time-frame from two tumours were segmented manually using
methodology described previously [20], without any knowledge of classification obtained
images involved placing a series of points by eye along the length of individual vessels,
at the estimated mid-point between the vascular walls, and recording the (x,y,z)
co-ordinates. Wherever a vessel branching point was found, it was marked and a new trace
started. A ‘vessel’ was defined as the length traced between two branching points. The
average number of points in a vessel was approximately 10. The first tumour set
required 1415 points in 124 vessels and the second set required 3292 points in 385
vessels. The (x,y,z) coordinates of these points were then used to determine whether the
current segmentation technique allocated them correctly. A vessel was considered as
identified correctly if more than 50% of the manually described points for that vessel
were found within either the intra-vascular or boundary classes.
Kinetic analysis of extravasation
Segmentation allowed the extraction of fluorescence intensity-time curves for the
intra-vascular class (capillary input function) and the corresponding curve for the
extra-vascular class (tissue response function). In order to simplify the kinetic analysis of this
extravasation data, we employed a graphical representation originally described by
Patlak et al. [21], which is widely used in quantitative imaging studies [22], such as those employing magnetic resonance imaging (MRI) ([23-25]) and positron emission
tomography (PET) [26-29]. This method involves a transformation of the data such that
the ratio of extra-vascular intensity to intra-vascular intensity is plotted against a modified
time axis, which effectively transforms the data into that which would have been
observed had the capillary input function been constant throughout the experiment. This
transformation greatly simplifies the analysis. When there is a net irreversible
accumulation of fluorescence in the tissue over the time course of the experiment, it
follows that the plot becomes linear after sufficient equilibration time. Also, the terminal
the fluorescence from the capillary to the tissue (Ki) [21]. See also Padhani and Choyke
[22] for a text-book description of the Patlak approach.
The modified time axis in this plot is calculated as follows [21]: for each real time
point, t, of the experiment, the modified time, T, is given by the integrated concentration
of marker in blood up to time tdivided by the actual concentration of the marker at time t.
Therefore, for our data, the Patlak plot is given by y= Ct(t) Cvess(t)
against T=
∫
Cvess(t)dt Cvess(t),
where Ct(t) is fluorescence intensity in the extra-vascular class and Cvess(t) is fluorescence
intensity in the intra-vascular class at time t. In order to fit the transformed data and
obtain an estimate of the terminal slope, we used an equation describing an exponential
approach to a straight line y=
(
α
+β
T)
(
1−e−γT)
, with variables α, β and γ, where theslope of this straight line, β, is the estimate of Ki. Data were fitted using non-linear least
mean squares. The average time required for image processing and kinetic analysis
algorithms, from the intensity data to Ki for each tumour, was of the order of minutes.
Estimation of Apparent Permeability
Since the resolution of multiphoton fluorescence microscopy allowed the
measurements of the input function to be performed directly in the microvessels,
estimates of an apparent vascular permeability, P, were obtained from the relationship Ki
= PS/V (in sec -1) [30-32], where S is vascularsurface area for exchange in a volume V of
exchanging tumour tissue, obtained from the image analysis described above.
Statistics
A Student's t-test was used to test the significance of the difference in means
between the control and CA-4-P-treated groups for the different permeability parameters.
RESULTS
Fluorophore stability
5 minutes after intravenous administration of 40 kDa FITC-dextran, the high molecular
weight component (> 30kDa) of plasma fluorescence accounted for 99.8% of the total
fluorescence measured in rat plasma. This percentage remained constant throughout
the time-course of the experiment (2 hours). Total plasma fluorescence decreased from
approximately 4 x 10⁴ to 2.5 x 10⁴ fluorescence intensity units, over the same time-scale,
presumably due to tissue uptake and metabolism. Maintenance of the high molecular
weight component of fluorescence over this time-scale provided evidence for in vivo
stability of the FITC-dextran used in the imaging studies.
Image Pre-processing
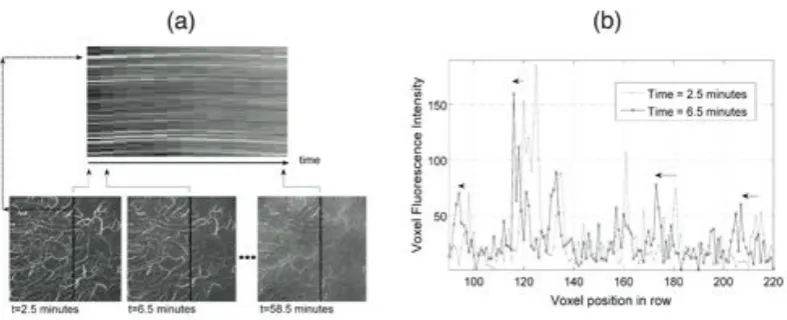
The tissue movement with time of one of the data sets is presented in two different
ways in figure 2; first as a ‘time cut’ (figure 2 (a)) and then as one dimensional (1-D) lines
(figure 2 (b)). In figure 2 (a), the top image is the time cut, formed by selecting a line of
intensity values from the same position in each of the intensity images and placing the
lines from images belonging to adjacent time points next to each other. Intensity images
from three separate time points are shown in the lower panels in figure 2 (a). It can be
seen that the intensities for the chosen line shift upwards and later downwards with time,
indicating tissue movement. Another characteristic of the time cut shown is the
decreasing contrast in intensities with time, indicating leakage of FITC-dextran from the
intra-vascular to extra-vascular space. Figure 2 (b) shows two 1-D signals corresponding
to one line of voxels from the time cut at two different time points. The tissue movement
Figure 3 illustrates the results for cross correlation, used in image registration to
correct for tissue movement with time. The relative similarity of the two 1-D signals
shown in figure 2 (b) is presented in figure 3 (a). The peak of the cross correlation,
indicating 95% relative similarity, is shifted towards the right of the centre, indicating
movement i.e. the line in the image at the second time point is most similar to the
selected line in the first image when it has moved to the right by approximately 20 µm. In
figure 3 (b) the cross correlation of two 2-D signals is presented as a 3-D mesh and
again it can be seen there is a shift in the rows, while there is no apparent movement in
the columns. The arrow indicates the movement of the tissue, so that its registration was
performed by a shift in the inverse direction.
Figures 3 (c, d) show two different registration maps, the first corresponds to a case
where rigid registration would correct the movement of the tissue and the second
corresponds to a movement that requires a non-rigid registration to compensate for the
movement of the tissue. The maps were obtained by partitioning the data into 15 x 15
regions of 32 x 32 x 6 voxels as described in Materials and Methods. Each arrow
denotes the correction required for each region of the partition. Finally figure 3 (e) shows
a time cut image of the registered data derived from the raw data shown in figure 2 (a).
The registration process has turned the curved lines corresponding to the bright
intra-vascular tissue into straight lines.
Validation of the segmentation algorithm
The semi-automated segmentation algorithm described above, applied to all 15
tumour data sets, gave overall classification of voxels as 8.8% intra-vascular, 67.8%
extra-vascular, 18.1% boundary, and 5.3% uncertain.
Two tumour sets were used for validation, as described in Materials and Methods. In
87.1% were designated correctly as intra-vascular. For the second set, the results were
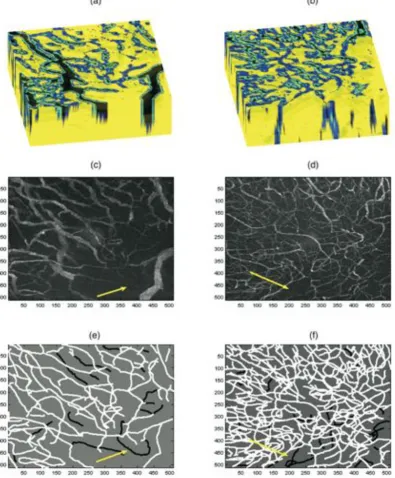
7.0% and 93.0% respectively. Figure 4 shows the semi-automated segmentation, as a
3-D rendering of the class masks for two tumours (a, b), the maximum intensity projections
for both sets (c, d) and the results of the comparison between semi-automated
segmentation and manual vessel identification (e, f). In e) and f), the vessels labelled in
white and black indicate correct and incorrect classification by the semi-automated
algorithm respectively. The vessels that were classified incorrectly were mainly due to
vessels with very low intensity, as indicated by the arrows in Figure 4 for example.
To evaluate the effect of omitting the incorrectly classified vessels in the analysis, we
measured the average fluorescence intensities of the hand-segmented vessels for both
tumours, firstly using only the correctly classified vessels and secondly using all the
vessels. In the first tumour, the average intra-vascular fluorescence intensity was 51.6
for correctly classified vessels only and 48.3 for all vessels. In the second tumour, the
corresponding values were 41.9 and 40.6. The corresponding extra-vascular levels were
19 for the first tumour and 8.7 for the second. The difference in intensities calculated by
the two segmentation methods accounted for a variation of 6.4% and 3.2% in the Ct/Cvess
ratio for the two tumours respectively, and therefore had minimal impact on calculations
of the apparent vascular permeability.
Estimation of Apparent Tumour Vascular Permeability
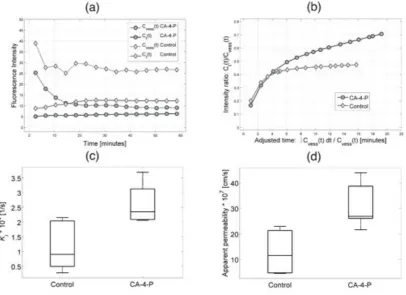
The time-courses of intra- and extra-vascular fluorescence intensity are illustrated in
figure 5 (a) with one control and one CA-4-P treated tumour. The intra-vascular intensity
(Cvess) decreased rapidly in the first 20 minutes of the experiment, as expected due to
whole body clearance of FITC-dextran. There was a significant difference in the rate of
extravasation of the marker between controls and CA-4-P-treated tumours. As shown in
described in Materials and Methods. Figure 5 (b) shows representative Patlak plots for
the same control and CA-4-P-treated tumours as in figure 5 (a). As described previously,
in these plots, the Ct/Cvess ratio is plotted against a modified time axis T, equivalent to a
tissue response to a constant concentration of the fluorescence marker in the
vasculature. The linear increase in the ratio is indicative of a net irreversible
accumulation of the marker in the extra-vascular regions of the tumour. The terminal
slope of the line, Ki, was significantly greater in the CA-4-P-treated tumours than in the
controls, as shown in Table 1 and figure 5 (c).
The vessel volume and surface area per unit tumour volume ( Vvess/V ) and (S/ V)
respectively were also calculated and values are given in Table 1.A mean value of
0.083 for Vvess/V in control tumours or 0.091 for the CA-4-P-treated tumours at the start of
the experiment (Table 1) are reasonable values for vascular volume for the
well-vascularised P22 tumour and is similar to the value reported by Yuan [9] for a different
tumour model. The value for S/V enables expression of the rate of extravasation in terms
of the capillary surface area, to give an apparent permeability P, where, P equals Ki x
V/S. P was significantly greater in the CA-4-P-treated tumours than in the control
tumours, as shown in Table 1 and figure 5 (d). The impact of the segmentation
thresholds was assessed by varying the optimum thresholds for each set and
re-calculating P. No significant difference was detected for variations of ± 2 in the grey
level intensity (approximately 10% of the optimal value) in the levels of both thresholds
(results not shown).
DISCUSSION
The present work builds on the inherent properties of multiphoton fluorescence
tissue. Application of image processing and kinetic analysis techniques to multiphoton
fluorescence images of the uptake of a fluorescent marker into tumour tissue allowed
estimation of the apparent tumour vascular permeability and its modification following
vascular-targeted treatment. 40 kDa FITC-dextran was found to have prolonged stability
in rat plasma. In contrast, we have found that administration of FITC-labelled albumin to
rats results in a significant proportion of fluorescence in a low molecular weight fraction
of plasma, within 20 minutes of injection, suggestive of significant instability of this
molecule in vivo (unpublished data).
There are several advantages of the methodology used here. The high spatial
resolution of optical techniques allows direct segmentation of the intra-vascular input
function from the tissue response function. This avoids the confounding effect that blood
flow has on the interpretation of Ki, when the input function is either assumed or
measured in great vessels, as used in other lower resolution imaging modalities such as
magnetic resonance imaging and positron emission tomography. Had the input function
been measured in arterial blood then it would have been necessary to take into account
the effects on Ki of both blood flow rate and the transport rate across the capillary walls,
as modelled for example in the Renkin-Crone equation [30,31]. The high spatial
resolution of optical techniques combined with the use of multiphoton fluorescence for
obtaining 3-D images also allows supplementary measures of capillary surface area and
volume to be taken into account when interpreting Ki in terms of apparent permeability,
P. Because of the acquisition of 3-D images, this does not involve any assumptions
regarding vessel diameter in the depth dimension. Furthermore, the semi-automated
method used here allows full use to be made of the 3-D data set instead of manual
selection of a very small sub-set of blood vessels within the imaged volume. User
methodology takes a matter of minutes, whilst manual tracing of blood vessels within a
tumour, as described in [20] takes many hours. Furthermore, it was possible to minimize
movement effects by application of image registration techniques to images obtained at
consecutive time points.
Two important observations regarding the segmentation technique used in the current
study arise at this point. First, even if parts of vessels were incorrectly classified as
extra-vascular tissue, those regions that were classified as intra-vascular were almost
certainly correct such that the numbers of false positives were very low. Clearly, if the
upper threshold that defines the intra-vascular tissue were lowered, more points would
belong to this class, but at the same time the number of false positives would also rise,
lowering the specificity of the method. Second, the geometry of the vasculature was only
of secondary interest for this work; such that disjointed or broken vessels could be
tolerated for estimation of Ki, as long as the average intensity of each class was
determined accurately. In other words, the sensitivity of the method to distinguish
vessels with low intensity is less crucial than the correctness of classes it detects.
Graphical representation of leakage data, as described by Patlak et al. [21], is a
useful analysis tool as it avoids the use of complex pharmacokinetic modelling, in the
case of net irreversibly accumulation of a marker in the extra-vascular space. In addition,
in our case, it allows easy visual assessment of the effect of CA-4P, which is not
immediately apparent from inspection of the original time-activity curves, where the
capillary input function is not constant. The early part of the transformed curves, such as
the ones shown in Figure 5b), cannot be accurately defined because of the time required
to focus the microscope. However, this is not critical because it is the terminal slope of
the ‘Patlak plot’ from which estimates of Ki are obtained.
chemical permeability for the chosen marker requires several qualifications, which are
often ignored in the literature. Strictly, the concentration of the intra-vascular fluorescent
marker should be expressed relative to plasma rather than whole blood. This correction
to the estimate of P would require knowledge of the haematocrit in individual
micro-vessels. We have also assumed that the Ki is limited by the uni-directional transport of
the fluorophore from capillary across the vascular wall and that there is no significant
reversible exchange occurring during the time-course of the experiment. We aimed to
minimize these effects by the use of a high molecular weight marker but we cannot
discount their existence. In the presence of reversible exchange of the fluorophore
across the capillary wall, the Ki would represent a lower bound estimate for PS/V. Finally,
we refer to P as an apparent permeability because an unknown proportion of leakage
occurs via convection currents. This is discussed in more detail below, with respect to
the CA-4-P-induced increase in Ki.
In [33] Gerlowski reported vascular permeability (P) measurements of 5.72 ± 3.92 x
10-7 cm/s for FITC-dextran 150 (150 kDa) in tumours grown in rabbit ear chambers. In [2]
Monsky reported 3.2 ± 13 x 10-7 cm/s (mammary fat pad) and 1.3 ± 0.5 x 10⁻⁷ cm/s
(cranial window) for tetramethylrhodamine-labeled BSA in ZR75-1 tumours growing in
different microenvironments in female severe combined immunodeficient (SCID) mice. In
[9] Yuan reported 6.06 ± 4.30 x 10⁻⁷ cm/s for Texas Red-BSA (67 kDa) in human
adenocarcinoma LS174T in SCID mice. Our value for untreated tumours was 12.76 ±
3.36 x 10⁻⁷ cm/s. Therefore, given the different animals, markers, molecular weights,
imaging modalities and tumour lines used in the studies, our estimates of the apparent
vascular permeability are of the same order as these published data. All these estimates
were obtained using conventional fluorescence microscopy and are subject to the
Both Ki and P were higher in the CA-4-P-treated group compared with controls. The
effect of CA-4-P on Ki clearly demonstrates that the leakage rate of FITC-dextran from
blood to the extra-vascular tumour space is increased after CA-4-P treatment, which
implies a generalized protein leak into the tumour tissue, as previously proposed [12].
Clearly, differences in charge, size and shape of dextran compared with plasma proteins
such as albumin means that the absolute P for these various macromolecules differ.
However, an increase in P for dextran is highly suggestive of an increase in P for plasma
proteins of similar molecular weight. The calculations of P from Kirequired additional
calculations of S and V from the segmented images, thus potentially introducing further
uncertainties in the estimates of P. However, the p-value obtained when P was
compared for the CA-4-P treated and control groups was low enough to reject the
hypothesis that the two groups belonged to a single distribution.
The CA-4-P-induced increase in apparent permeability P strongly implies that CA-4-P
disrupts the barrier function of tumour blood vessels. It should be pointed out that, as for
several previous studies using the window chamber model, high tumour pressure
imposed by the chamber glass could affect the absolute values of P obtained. Similarly,
systemic cardiovascular effects of dextrans could affect the absolute values [34].
However, in terms of the effect of CA-4-P on P, both the control and treated groups were
exposed to similar conditions, such that the statistical discrimination that was found
between the two groups is robust. In addition, we cannot dismiss the possibility that
there was an increase in fluid convection across the vascular wall following CA-4-P
treatment, which could contribute to the observed increase in P. This may occur as a
result of an increase in tumour perfusion pressure subsequent to a CA-4-P-induced
increase in mean arterial blood pressure, as reported previously in rats [35]. Finally, a
limitation of the method is that the values of permeability correspond to an average of all
analysed separately, but the partitioning of the data would increase the uncertainty of the
measurements of surface area and volume, as a lower number of elements would be
used for the calculations.
In summary, the multiphoton fluorescence imaging method described allows accurate
estimation of the tissue influx (vascular leakage) rate constant, Ki further allowing
estimation of the apparent tumour vascular permeability, P, for an intravenously
administered high molecular weight marker, with minimal user intervention and fewer
assumptions than for other imaging methods with lower spatial resolution. In addition,
results showed a significant increase in Kiand P following treatment with CA-4-P, which
is consistent with our in vitro data and may act as a trigger for tumour blood flow reduction.
ACKNOWLEDGEMENTS
We would like to thank the Biological Services staff at the Gray Cancer Institute for care
of the animals and Cancer Research UK for funding this work.
REFERENCES
1. Jain RK: Delivery of novel therapeutic agents into tumours: physiological barriers and strategies. JNCI 1989;81:570-576.
2. Monsky WL, Mouta Carreira C, Tsuzuki Y, Gohongi T, Fukumura D, Jain RK:
Role of host microenvironment in angiogenesis and microvascular functions in human breast cancer xenografts: mammary fat pad versus cranial tumors. Clinical Cancer Research 2002;8:1008-1013.
3. Tozer GM, Kanthou C, Baguley BC: Disrupting tumour blood vessels. Nat Rev
Cancer 2005;5:423-435.
4. McDonald DM, Baluk P: Significance of Blood Vessel Leakiness in Cancer.
Cancer Research 2002;62:5381-5385.
5. Baird LC, Canoll P, Bruce J: Effect of infiltrating tumor cells on the blood-brain barrier in a neonatal rat glioma model. In Society for Neuro-Oncology Eighth Annual Meeting. Keystone, Colorado, 2003.
6. Nakano S, Matsukado K, Black KL: Increase brain tumor microvessel
7. Inoue N, Venema RC, Sayegh HS, Ohara Y, Murphy TJ, Harrison DG: Molecular regulation of the bovine endothelial nitric oxide synthase by transforming growth factor-beta 1. Arterioscler Thromb Vasc Biol 1995;15:1255-1261.
8. Masters BR, So PTC: Antecedents of Two-Photon Excitation Laser Scanning
Microscopy, Microscopy Research and Technique. Microscopy Research and Technique 2004;63:3-11.
9. Yuan F, Leunig M, Berk DA, Jain RK: Microvascular permeability of albumin,
vascular surface area, and vascular volume measured in human
adenocarcinoma LS174T using dorsal chamber in SCID mice. Microvasc Res 1993;45:269-289.
10. Dark GD, Hill SA, Prise VE, Tozer GM, Pettit GR, Chaplin DJ: Combretastatin A-4, an agent that displays potent and selective toxicity toward tumor vasculature. Cancer Res. 1997;57:1829-1834.
11. Grosios K, Holwell SE, McGown AT, Pettit GR, Bibby MC: In vivo and in vitro evaluation of combretastatin A-4 and its sodium phosphate prodrug. Br. J. Cancer 1999;81:1318-1327.
12. Tozer GM, Prise VE, Wilson J, Cemazar M, Shan S, Dewhirst MW, Barber PR,
Vojnovic B, Chaplin DJ: Mechanisms associated with tumor vascular shut-down induced by combretastatin A-4 phosphate: intravital microscopy and
measurement of vascular permeability. Cancer Res 2001;61:6413-6422.
13. Tozer GM, Prise VE, Wilson J, Locke RJ, Vojnovic B, Stratford MRL, Dennis MF,
Chaplin DJ: Combretastatin A-4 phosphate as a tumor vascular-targeting agent: early effects in tumors and normal tissues. Cancer Res. 1999;59:1626-1634.
14. Kanthou C, Tozer GM: The tumor vascular targeting agent combretastatin
A-4-phosphate induces reorganization of the actin cytoskeleton and early membrane blebbing in human endothelial cells. Blood 2002;99:2060-2069.
15. Gaede V, Günther O: Multidimensional access methods. ACM Computing
Surveys 1998;30:170-231.
16. de Castro E, Morandi C: Registration of translated and rotated images using finite Fourier transforms. IEEE Transactions on Pattern Analysis and Machine
Intelligence 1987;5:700-703.
17. Hill DLG, Batchelor PG, Holden M, Hawkes DJ: Medical Image Registration
[invited topical review]. Physics in Medicine and Biology 2001;46:R1-R45. 18. Randen T, Husøy JH: Filtering for Texture Classification: A Comparative Study.
IEEE Trans. on Patt. Anal. and Machine Intel. 1999;21:291-310.
19. Schroeter P, Bigun J: Hierarchical Image Segmentation by Multi-dimensional Clustering and Orientation-Adaptive Boundary Refinement. Pattern Recognition 1995;28:695-709.
20. Barber PR, Vojnovic B, Ameer-Beg SM, Hodgkiss RJ, Tozer GM, Wilson J:
Semi-automated software for the three-dimensional delineation of complex vascular networks. J Microsc 2003;211:54-62.
21. Patlak CS, Blasberg RG, Fenstermacher JD: Graphical evaluation of
blood-to-brain transfer constants from multiple-time uptake data. J Cereb Blood Flow Metab 1983;3:1-7.
22. Padhani AR, Choyke PL: New Techniques in Oncologic Imaging. Boca Raton
FL, CRC Press, 2006.
23. Daldrup H, Shames DM, Wendland M, Okuhata Y, Link TM, Rosenau W, Lu Y,
24. Daldrup HE, Shames DM, Husseini W, Wendland MF, Okuhata Y, Brasch RC: Quantification of the extraction fraction for gadopentetate across breast cancer capillaries. Magn Reson Med 1998;40:537-543.
25. Roberts HC, Roberts TP, Ley S, Dillon WP, Brasch RC: Quantitative estimation
of microvascular permeability in human brain tumors: correlation of dynamic Gd-DTPA-enhanced MR imaging with histopathologic grading. Acad Radiol 2002;9 Suppl 1:S151-155.
26. Romer W, Hanauske AR, Ziegler S, Thodtmann R, Weber W, Fuchs C, Enne W,
Herz M, Nerl C, Garbrecht M, Schwaiger M: Positron emission tomography in non-Hodgkin's lymphoma: assessment of chemotherapy with
fluorodeoxyglucose. Blood 1998;91:4464-4471.
27. Smith IC, Welch AE, Hutcheon AW, Miller ID, Payne S, Chilcott F, Waikar S, Whitaker T, Ah-See AK, Eremin O, Heys SD, Gilbert FJ, Sharp PF: Positron emission tomography using [(18)F]-fluorodeoxy-D-glucose to predict the pathologic response of breast cancer to primary chemotherapy. J Clin Oncol 2000;18:1676-1688.
28. Lodge MA, Lucas JD, Marsden PK, Cronin BF, O'Doherty MJ, Smith MA: A PET
study of 18FDG uptake in soft tissue masses. Eur J Nucl Med 1999;26:22-30.
29. Vesselle H, Schmidt RA, Pugsley JM, Li M, Kohlmyer SG, Vallires E, Wood DE:
Lung cancer proliferation correlates with [F-18]fluorodeoxyglucose uptake by positron emission tomography. Clin Cancer Res 2000;6:3837-3844.
30. Renkin EM: Transport of potassium-42 from blood to tissue in isolated mammalian skeletal muscles. Am. J. Physiol. 1959;197:1205-1210.
31. Michel CC, Curry FE: Microvascular permeability. Physiol Rev 1999;79:703-761.
32. Bickel U: How to Measure Drug Transport across the Blood-Brain Barrier. NeuroRx 2005;2:15-26.
33. Gerlowski LE, Jain R, K.: Microvascular permeability of normal and neoplastic tissues. Microvascular Research 1986;31:288-305.
34. Briseid G, Briseid K: Inhibition by low molecular weight dextran of the blood pressure fall and the lowering of plasminogen proactivator induced by clinical dextran in the rat. Acta Pharmacol Toxicol (Copenh) 1983;52:143-149.
35. Prise VE, Honess DJ, Stratford MRL, Wilson J, Tozer GM: The vascular
response of tumor and normal tissues in the rat to the vascular targeting agent, combretastatin A-4-phosphate, at clinically relevant doses. Int J Oncol
TABLE 1
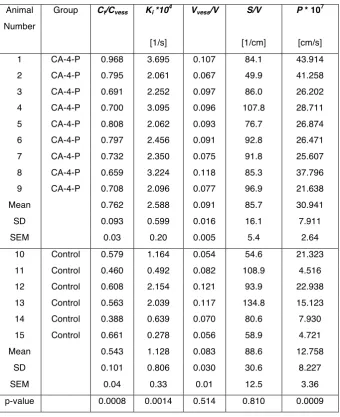
Estimates of vascular parameters in P22 tumours grown in dorsal skin flap window
chambers with/without treatment with combretastatin A-4-P (CA-4-P). (Ct/Cvess) is
extra-vascular versus intra-extra-vascular fluorescence intensity ratio for the last time sample (t =
58.5 min); Ki is the tissue influx (vascular leakage) rate constant; Vvess/V is the vascular
volume per unit volume of tissue; S/V is the vascular surface area per unit volume of
tissue; P is the apparent tumour vascular permeability calculated from Ki = PS/V. Mean
values, standard deviation (SD), standard error of the mean (SEM) and p-values for a
Student’s t-test between treated and untreated groups are also presented. Notice that
while there is no statistical difference in the geometrical parameters (S/V, Vvess/V), the
three indicators of permeability (Ct/Cvess, Ki, P) show a difference (p<0.05) between
Table 1
Animal Number
Group Ct/Cvess Ki *104 Vvess/V S/V P * 107
[1/s] [1/cm] [cm/s]
1 CA-4-P 0.968 3.695 0.107 84.1 43.914
2 CA-4-P 0.795 2.061 0.067 49.9 41.258
3 CA-4-P 0.691 2.252 0.097 86.0 26.202
4 CA-4-P 0.700 3.095 0.096 107.8 28.711
5 CA-4-P 0.808 2.062 0.093 76.7 26.874
6 CA-4-P 0.797 2.456 0.091 92.8 26.471
7 CA-4-P 0.732 2.350 0.075 91.8 25.607
8 CA-4-P 0.659 3.224 0.118 85.3 37.796
9 CA-4-P 0.708 2.096 0.077 96.9 21.638
Mean 0.762 2.588 0.091 85.7 30.941
SD 0.093 0.599 0.016 16.1 7.911
SEM 0.03 0.20 0.005 5.4 2.64
10 Control 0.579 1.164 0.054 54.6 21.323
11 Control 0.460 0.492 0.082 108.9 4.516
12 Control 0.608 2.154 0.121 93.9 22.938
13 Control 0.563 2.039 0.117 134.8 15.123
14 Control 0.388 0.639 0.070 80.6 7.930
15 Control 0.661 0.278 0.056 58.9 4.721
Mean 0.543 1.128 0.083 88.6 12.758
SD 0.101 0.806 0.030 30.6 8.227
SEM 0.04 0.33 0.01 12.5 3.36
FIGURES
Figure 1. Time course of the acquisition of one 3-D volume (512 x 512 x 11 voxels
corresponding to 1331.2 x 1331.2 x 50 µm3) of multiphoton images for one BDIX rat
treated with CA-4-P. Intra-vascular tissue is bright at the first time point allowing its ready
discrimination from surrounding tissue. Notice the reduced contrast in the tumour with
time, as contrast agent leaks into the extra-vascular tissue. Time t = 1 was used to
represent the start of image acquisition. The mid-point of each 3 minute imaging window
was used to represent the acquired time for each image in all subsequent plots.
[image:26.595.97.491.549.709.2]images at each time point and placed next to each other to form a new image, having
the time as the horizontal axis. Three 2-D images from the whole time series are shown
to illustrate the procedure. Dashed arrows indicate bright intra-vascular tissue in the first
2-D image and its corresponding voxel in the first column. Solid vertical lines indicate the
exact cut from where data for the columns are obtained and the solid arrows indicate the
position on the column at which they are placed. The movement is manifest as the
variation of the intensity upwards and then downwards with time. (b) Two 1-D lines
corresponding to the intensity of the voxels of one of the columns selected above at two
Figure 3. Registration of data through cross correlation. (a) The cross correlation of the
two 1-D signals shown in figure 2 (b). The degree of movement of the signals is depicted
by the maximum value of the relative similarity (close to 95%) being to the right of the
central value. (b) Cross correlation of two 2-D signals displayed as a 3-D mesh. Notice
again how the maximum is shifted from the centre. The movement in the direction of the
rows is close to 20 µm, while there is no apparent movement in the direction of the
columns. The arrow indicates the movement of the tissue. Rigid and non-rigid
registration maps (c, d) denoting the direction of the displacement required to correct for
the movement of the 15 partitioned regions of the data. (e) Registered time cut. The
curved lines that revealed the temporal movement of the images in figure 2 (a) appear
Figure 4. Comparison of the image segmentation algorithm with a manual method. (a, b)
3-D rendering of the class masks for two tumours. Intra-vascular voxels are labelled in
black, extra-vascular voxels in yellow and boundary region in blue, with a lighter shade
for the voxels closest to the intra-vascular region. In these two tumours there were
insignificant numbers of unclassified voxels.The rendering was performed with
transparency and details of different slices can be seen. (c, d) Maximum intensity
tissue with low intensities. (e, f) Comparison with manually segmented vessels. The
vessels that were correctly segmented with the algorithm (those with more than 50%
points correctly classified, see text) are labelled in white and those that were not are
labelled in black. The arrows show two regions of low intensity where the segmentation
with the proposed methodology detects less than 50% of the points of the manually
segmented traces.
Figure 5. (a) Time-activity curves of the intensities of intra-vascular tissue (Cvess(t)) and
extra-vascular tissue (Ct(t)) versus time for two data sets, one control and one treated
with CA-4-P. While Cvess decreased exponentially, Ct increased steadily. It was assumed
that this increase is due to the extravasation of the marker. The vertical axis denotes
average intensity in the intra- and extra-vascular regions and the horizontal axis denotes
time after fluorophore injection. (b) Transformed time plots for the same control and
CA-4-P-treated tumours. Data from time-activity curves were transformed, as described by
[image:31.595.96.503.230.525.2]such that the curves represent the intensity ratio versus time curves that would have
pertained in each case had the input functions (Cvess versus time) been constant
throughout the time-course of the experiment. The slope of the linear section of the plot
provides the estimate of Ki. Notice that the treated case has a higher slope than the
control. (c) Box plot (lines at the lower quartile, median, and upper quartile values) of the
Kiproduct for the two groups (1.13 ± 0.33 x 10
-4
sec-1 for the controls and 2.59 ± 0.20 x
10-4 sec-1 for CA-4-P, p = 0.0014) and (d) Box plot of the apparent permeability P for the
two groups (12.76 ± 3.36 x 10⁻⁷ cm/s for controls and 30.94 ± 2.64 x 10⁻⁷ cm/s for
CA-4-P, p = 0.0009). Both box plots denote statistical difference between treated and control