Cite this:
Phys. Chem. Chem. Phys
., 2011,
13
, 10577–10583
Modelling molecule–surface interactions—an automated
quantum-classical approach using a genetic algorithm
Claudia R. Herbers,
aKaren Johnston
band Nico F. A. van der Vegt*
aReceived 16th December 2010, Accepted 9th May 2011
DOI: 10.1039/c0cp02889d
We present an automated and efficient method to develop force fields for molecule–surface interactions. A genetic algorithm (GA) is used to parameterise a classical force field so that the classical adsorption energy landscape of a molecule on a surface matches the corresponding landscape from density functional theory (DFT) calculations. The procedure performs a sophisticated search in the parameter phase space and converges very quickly. The method is capable of fitting a significant number of structures and corresponding adsorption energies. Water on a ZnO(0001) surface was chosen as a benchmark system but the method is implemented in a flexible way and can be applied to any system of interest. In the present case, pairwise Lennard Jones (LJ) and Coulomb potentials are used to describe the molecule–surface interactions. In the course of the fitting procedure, the LJ parameters are refined in order to reproduce the adsorption energy landscape. The classical model is capable of describing a wide range of energies, which is essential for a realistic description of a fluid–solid interface.
1.
Introduction
Surface coatings, biomineralisation, wettability, electrochemical processes, surfactants, catalysis and medical implants are just a few examples where important chemistry happens in the interfacial region.1–11 To understand the influence of the interface on the macroscopic material properties it is essential to have a realistic microscopic description of a fluid–solid interaction. From the perspective of both classical simulations and experiment, a detailed picture of the adhesion of molecules on surfaces is still missing. Molecular modelling techniques are particularly useful in addressing these systems, since they provide a microscopic description of the system of interest.
Classical molecular dynamics (MD) simulations commonly use atomistic force fields that were developed to describe bulk properties of solids or liquids. Intermolecular interactions between different species in the bulk can be modelled by means of simple combination rules. This ansatz is applicable as long as it is validated against some experimental properties. In principle, the same approach can be used to develop fluid– solid interfacial potentials. However, the lack of experimental data describing the interfacial region turns the parametrisation of such surface potentials into a non-trivial problem.
To date, quantum-classical approaches have often been used to model surface interactions. Interfacial potentials have been fitted such that data from electronic structure calculations are reproduced.12–20Normally, the data obtained from these calculations include adsorption energies for the minimum energy structure or distance dependent information of the adsorption strength of the molecule with respect to some positions or atomic sites on the surface. In these studies the fitting of the classical potentials is usually based on a fairly limited number of quantum calculations and it is not always clear if the classical potentials obtained in this way are sufficiently transferable to describe the adsorption energy landscape in the x,y-dimension of the surface. In particular for solid–liquid interface systems where this landscape is characterised by a broad spectrum of energies that are all thermally accessible, new, computationally efficient quantum-classical parameterisation methods need to be considered.
In this work we present a model for a H20–ZnO(0001) interaction that is fitted to quantum calculations that attempt to provide a realistic description of the adsorption energy landscape. By doing so, we will demonstrate the importance of the right choice of the fitted data sample. In order to deal with such a large data set we implemented a genetic algorithm (GA) to automate the fitting procedure.21Often, classical interfacial force field parameters are fitted manually. This approach works well for simple systems, but for complicated systems with many atom pairs or many configurations the number of parameters increases rapidly and a manual fit is no longer feasible. A genetic algorithm is well suited for this problem, aCenter of Smart Interfaces-TU Darmstadt, Petersenstr. 32,
64287 Darmstadt, Germany. E-mail: [email protected]; Fax: +49 06151 162048; Tel: +49 06151 164356
b
Max Planck Institute for Polymer Research, Ackermannweg 10, 55128 Mainz, Germany
PCCP
Dynamic Article Links
www.rsc.org/pccp
PAPER
since it is particularly good at finding the global minimum in a large phase space and, unlike other optimisation techniques, such as local gradient methods, it does not face the problem of getting stuck in a local minimum. Furthermore, an initial starting guess for the parameters is not required, which is particularly important if the nature of the molecule–surface interaction is unknown. While genetic algorithms have been applied to many general optimisation problems and are implemented in other software packages, such as GULP22 and FFGenerAtor,23 it has never, to the best of our knowledge, been applied to the parameterisation of molecule– surface force fields.
As a benchmark system we have chosen water on a ZnO(0001) (pffiffiffi3pffiffiffi3) R301-O + (21)-H surface. This surface, which was thoroughly studied by Valtiner and coworkers,24 is stabilized by a partial OH adsorption and is therefore thermodynamically stable in the presence of water. The electronic structure calculations show no dissociation of water on the surface. The electronic structure and adsorption energy of various configurations of a water molecule on the ZnO surface were obtained from DFT calculations. These configurations of the water molecule on the surface were used to map out the potential energy landscape of the molecule– surface interaction. The GA was applied to perform a search of the parameter space so that the classical surface potentials reproduced the adsorption energies from DFT. The methodology is presented in detail in section 2 and the resulting force field is discussed in section 3. We will study the importance of the choice of the data set that enters in the GA fitting method.
2.
Methodology
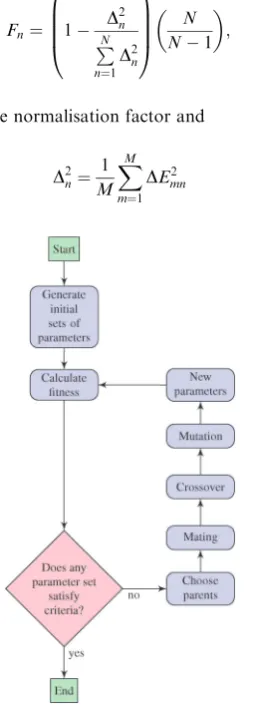
A schematic representation of the procedure for generating the force field parameters is shown in Fig. 1. In the first step an initial set of parameters for the classical force field (FF) is generated. The next step is to calculate the adsorption energy
landscape of the molecule in different conformations on the surface using these parameters. The FF and DFT calculations are described in section 2.1. The classical energy landscape is compared to the corresponding DFT energy landscape and if the classical energies differ significantly from the DFT results we refine the FF parameters until the classical and quantum energy landscapes converge. The FF parameters are optimised using a genetic algorithm, which is described in detail in section 2.2.
2.1 Computational details
DFT calculations.The water–ZnO surface interaction was sampled at 198 evenly spaced positions on the surface. For each configuration thexandycoordinates of the water oxygen atom and thex,yandzcoordinates of the surface atoms are held fixed while thezcoordinate of the water oxygen and all the coordinates of the water hydrogen atoms are allowed to relax. At each point the structure was optimised using the PBE25density functional, PAW,26,27and a 550 eV plane wave cutoff. The DFT calculations were performed by A. Berezkin et al.using the the VASP package28,29and will be described in detail in a forthcoming publication.30
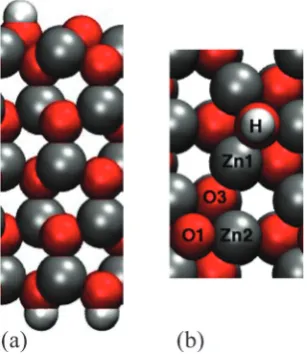
The ZnO(0001) (pffiffiffi3pffiffiffi3) R301-O + (21)-H surface slab is shown in Fig. 2. The ZnO slabs are partially OH-terminated on the surface exposed to water and on the bottom surface the dangling bonds were passivated by pseudo H atoms with a valence of 0.5 e. The charge distribution of the ZnO surface is calculated with DFT by means of modified Mulliken population analysis.31–33The partial charges of the surface atomsqjare obtained from DFT calculations and are shown in Table 1.
The adsorption energyEadsis defined as
Eads=EtotalEslabEmol (1)
where Etotal is the total energy, Eslab is the energy of the isolated surface and Emolis the energy of the isolated water molecule. The adsorption energy can be dependent upon the exchange and correlation functional and also on van der Waals
Fig. 1 Automated procedure for generating classical surface potentials from DFT calculations.
Fig. 2 The ZnO(0001) (pffiffiffi3pffiffiffi3) R301-O + (21)-H surface slab viewed in (a) the xz plane (side view) and (b) the xy plane (top view). Zn, O and H atoms are coloured in grey, red and white, respectively. The oxygen atom beneath the H is labelled O2. Figure created with VMD.35
[image:2.595.120.225.490.707.2] [image:2.595.349.503.496.676.2]forces. In this work the DFT energies do not include van der Waals interactions, however, in a strongly charged system we expect that the electrostatics is the dominant interaction. The 198 configurations cover a range of adsorption energies from around 12 to 55 kJ mol1. The lowest adsorption energy compares well with the experimental results of Schiek et al. who studied water adsorption on the H(11)O-Zn(0001) surface and found the binding energy of a single molecule to be55.2 kJ mol1.34
Classical force field. In order to obtain the water–ZnO
adsorption energies for the GA fitting procedure, we performed single point calculations as implemented in the GROMACS simulation package.36 This interaction between the water atoms iand the surface atoms jis described by a potential with a Lennard-Jones 12-6 pairwise non-bonded term and Coulomb term, and has the following form
VðrijÞ ¼4eij
sij
rij
12 sij
rij
6
" #
þ 1
4pe0 qiqj
rij
: ð2Þ
The parameterseij,sijfor each type of atom pair are adjusted using the genetic algorithm, which is described in the following subsection. For this system we have six atom pairs, which give a total of twelve parameters. The non-bonded interactions are cut off at a distance of 0.9 nm. The system is set up in such a way that one water molecule is positioned above a five atomic layer thick ZnO slab, as shown in Fig. 2(a). We have used a surface of dimensions 22.794 A˚ 19.94 A˚, which corresponds to 4 2 times the surface unit cell shown in Fig. 2(b). Periodic boundary conditions were applied in thex,yandzdirections. To avoid image interactions in the z-direction, a vacuum of E13 A˚ is added above the surface. Coulombic interactions were treated with the particle-mesh Ewald (PME) method.37The water partial charges were taken from the SPC water model.38The water and surface partial charges were not modified in the fitting procedure.
2.2 The genetic algorithm
The genetic algorithm is based on the principle of evolution, which selects good or ‘fit’ individuals to be parents and rejects the others. In the present case an ‘individual’ refers to a particular parameter set and the ‘fitness’ is the agreement
between the classical and DFT energy landscapes. The good parameter sets are then paired ‘mated’ and they procreate. New sets of parameters are generated, where also ‘crossover’ and ‘mutation’ had occurred. The algorithm is shown schematically in Fig. 3 and the various terms are described in detail in the text below.
The first step is to generateNsets of parameters. These can be generated randomly since the algorithm will search over all parameter space and does in principle not require an input close to the final results. However, we have chosen the parameters, for convergence reasons, to be of the order of the OPLS-AA force field39 parameters. The number of sets should be large enough to introduce sufficient variation in the sets and the success of the algorithm depends onN. For each parameter setnwe calculate the energy of interactionEFFmnfor each single structurem of the totalM conformations of the molecule on the surface. In this implementation the total number of sets is kept constant.
The value that measures the quality of an individual parameter set n is called the fitness, Fn and in our case it depends on the difference between the DFT and classical adsorption energiesDEmn= E
DFT
m E
FF
mn. The convergence of the method depends critically on the definition of the fitness function. We have used a fitness function of the form
Fn¼ 1
D2n
PN n¼1
D2n
0 B B B @
1 C C C A
N N1
; ð3Þ
where N
N1is the normalisation factor and
D2n¼ 1 M
XM
m¼1
[image:3.595.51.289.98.237.2]DEmn2 ð4Þ Table 1 Partial charges for the ZnO slab obtained by Mulliken
population analysis. The top surface, which is in contact with the water, is partially hydroxylated and the bottom surface is fully hydroxylated. Each of the central layers is neutral
Layer Atom qj
Top O1 0.718
O2 0.616
H +0.251
Zn1 +0.760
Zn2 +0.729
O3 0.752
2,3,4 Zn +0.777
O 0.777
Bottom Zn +0.740
O 0.714
H +0.162
Fig. 3 Genetic algorithm fitting procedure used to generate classical force field parameters.
[image:3.595.365.492.352.706.2]is the mean square deviation of the energy difference. The fitness value ranges from 0 to 1, whereFn= 1 corresponds to perfect agreement between the DFT and classical adsorption energy landscapes.
The next step is the selection process, which accepts sets with a certain probabilityPnthat is based on the fitness. The probability depends on the fitness function as shown
Pn¼
ðFnÞp
PN n¼1
ðFnÞp
ð5Þ
The exponentpis one of the GA convergence parameters and we have chosenp of the order of 500. The selected sets are paired randomly. In the crossover stage the parameters are written in binary and the corresponding numbers from the parents crossed over at a random point along the binary. This crossover point divides the parameters into two parts and the second parts of the parameters are interchanged. The mutation randomly switches 1 to 0 and vice versa with a mutation rate of r. This has a significant influence on the performance. A rate that is too high is not likely to converge and a rate that is too low will not introduce enough variation in the parameter sets and the algorithm will stagnate. These last four steps generate anotherNsets of new parameters and the procedure is repeated until the criteria is reached,i.e.the
root mean square deviation (RMSD),Dn, is below a certain value or a maximum number of iterations has been reached.
The GA convergence parameters, N andr, were tested to find the optimal values for an efficient minimisation. We found that a rate ofr= 1% andN= 16 sets was optimal for our system. The initial guesses foreijandsijwere chosen randomly but within the range of physically realistic values. If the parameters are treated fully independently in the fitting procedure, the algorithm could converge to a set of parameters wheresHwj4sOwji.e.the ‘size’ of the water hydrogen is larger than the water oxygen, which is physically unrealistic. To address this issue, we added a constraint to keep the values of sij for the hydrogen atoms smaller than those for the oxygen atoms.
3.
Results and discussion
The DFT energy landscape for the water–ZnO system was created by placing water molecules on the ZnO surface in 198 different configurations, which differ in position and orientation with respect to the surface. This ensures that the adsorption energy landscape of the water–ZnO surface interaction is well sampled. In this section we will discuss the importance of the choice of the sample that is used in the fitting procedure. Furthermore we address the question of the non-uniqueness of the resulting parameters and compare the result to the performance of a standard force field, namely the OPLS force field.39
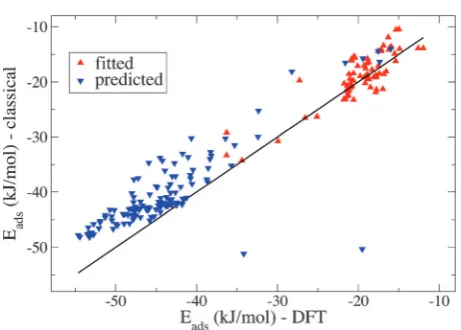
The choice of the sample is an important factor in the fitting procedure. One would assume that the full set of the 198 data points should be used to fit the classical potentials. While this might lead to an improved set of classical force field parameters it is potentially computationally costly, so it is interesting to see if it is possible to reproduce the full DFT data set using only a subset of all the structures. A subset of 100 configurations has been chosen, which is representative of the full energy range of the whole set of 198 configurations. In Fig. 4 the fitted and predicted energies obtained by the resulting force field of the GA fitting procedure are shown. It can be clearly seen, that the qualitative agreement between the DFT data and the GA force field is excellent. Quantitatively, the fit (taking into account the fitted and predicted energies) gives an overall RMSD of 3.21 kJ mol1, which is within the error of the DFT calculations. The corresponding force field parameters are reported in Table 2. In addition, a fit using the full data set of 198 conformations was performed and the RMSD is 3.37 kJ mol1, which is similar to the result of the 100 structure subset. This leads to the conclusion that a fit with 100 configurations is sufficient to reproduce the full set of energies.
[image:4.595.54.286.53.217.2]Fig. 4 Comparison of the DFT results for the adsorption energies with the ones from classical simulations. The black line is the perfect match, where the classical adsorption energies are in full agreement with the DFT results. The red up-triangles represent the results obtained with the GA fitting method (100 different low and high energy conformations). The blue down-triangles are the predicted adsorption energies for the remaining 98 configurations, obtained with the fitted classical force field.
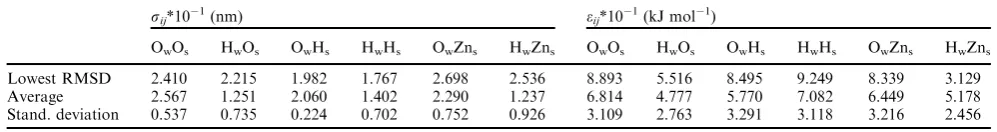
Table 2 50 GA fits using the subset of 100 low and high energy structures. In the first row the parameters corresponding to the lowest RMSD of the fitted set (2.264 kJ mol1) are reported. In the second row the average parameters over all 50 different GA fits are shown and in the third row the standard deviation is reported
sij*101(nm) eij*101(kJ mol1)
OwOs HwOs OwHs HwHs OwZns HwZns OwOs HwOs OwHs HwHs OwZns HwZns
Lowest RMSD 2.410 2.215 1.982 1.767 2.698 2.536 8.893 5.516 8.495 9.249 8.339 3.129 Average 2.567 1.251 2.060 1.402 2.290 1.237 6.814 4.777 5.770 7.082 6.449 5.178 Stand. deviation 0.537 0.735 0.224 0.702 0.752 0.926 3.109 2.763 3.291 3.118 3.216 2.456
[image:4.595.48.547.666.732.2]We compared the GA adsorption energies with the adsorption energies one would get from a classical simulation with a standard OPLS force field.39 We took the Lennard Jones parameters for the Zn, O and H atoms of the surface, the SPC water parameters and used the geometric combination rule to obtain the pairwise interaction potentials i.e. sij¼
ffiffiffiffiffiffiffiffi sisj
p
andeij¼pffiffiffiffiffiffiffieiej. The partial charges for the surface are,
as previously mentioned, obtained from the DFT calculations. In the SPC water model the LJ parameters of the Hwatoms are zero. Therefore, the LJ part of the force field is described by only four parameters, namelysOwOs= 0.3143 nm, eOwOs= 0.6801 kJ mol1,sOwZns= 0.2486 nm andeOwZns= 0.7975 kJ mol1. In comparison to the GA fit the OPLS force field performs worse with an RMSD of 7.49 kJ mol1. Nevertheless, it seems that the OPLS force field is not completely wrong. This is mainly due to the strong electro-static contribution. If one considers only the electroelectro-static interaction, the RMSD is 6.10 kJ mol1. The predicted energies from the electrostatics, OPLS and GA force field are shown in Fig. 5. The Coulombic interaction alone is already a good estimate for the adsorption energies. By modifying the LJ parameters for the surface potentials, one can further improve the force field so that the GA converges to a lower RMSD than the pure electrostatic contribution. This improvement can be also qualitatively seen in Fig. 5. On the contrary, the LJ parameters of the OPLS force field deteriorate the overall results and systematically predict too high energies for the deep minima of the potential energy surface.
Generally, the genetic algorithm converges to a non-unique set of parameters, but the results are comparable. To get a better idea of the spread of the parameters, we run 50 independent GA fits using the same configurations. The average value and standard deviation of each of parameters sijandeij are reported in Table 2. For each pair interaction the spread ofeijis larger than that ofsij. We have calculated the energies for the 198 structures using a force field with the average parameters and the RMSD is 5.01 kJ mol1. Taking the average parameters, therefore, does not lead to any improvement in the RMSD.
We have investigated the importance of choosing a data set that is representative with respect to the to the adsorption energy landscape. In the case of liquid water in contact with a solid this means that not only the deep but also the shallow minima of the potential energy surface must be sampled. To study the dependence of the choice of the parameter set thoroughly, we compare two more data subsets. The first subset contains mostly low energy structures (70 different configurations) and the second contains mostly high energy structures (70 different configurations). In Fig. 6 the result of the fit using the subset of lower-energy structures are shown. One can clearly see, that the fitted energies are in good agreement with the DFT energies. The resulting RMSD deviation for the 70 fitted structures is 2.11 kJ mol1. Also shown are the predicted energies, which deviate significantly from the DFT energies. The total RMSD with respect to all 198 configurations is 39.14 kJ mol1. Fig. 7 shows the fitted and predicted energies for the second subset. The RMSD for the fitted points is 2.63 kJ mol1and the RMSD for the full data set is 5.31 kJ mol1. The quantitative agreement with the DFT energies is reasonably good, although especially in the very low energy cases one can see a clear deviation from the DFT results. However, this good result is by chance and by performing 15 GA fits, using the same subset of structures, we get very different results. In each case the GA converged to approximately the same RMSD for the fitted subset, however, the RMSD of the entire set of 198 DFT energy points varies widely. For example, in one fit to the subset 70 low energy points, the RMSD of the fitted set is 2.33 kJ mol1, but the fit to the the full set of 198 configurations results in an RMSD of 2171.40 kJ mol1. This clearly demonstrates the importance of choosing a sample that is representative of a wide range of structures and energies. Therefore the quality of the resulting parameter sets must be rechecked after the fitting procedure, especially when the fit is performed on a subset of energies, but Fig. 5 Comparison of the DFT adsorption energies (black line) for
the 198 configurations with the results from the GA fitting method (black triangles) and the OPLS force field (red squares). Furthermore we show the contribution of the electrostatic interaction (orange circles) for the different configurations.
Fig. 6 Comparison of the DFT results for the adsorption energies with the ones from classical simulations. The black line is the perfect match, where the classical adsorption energies are in full agreement with the DFT results. The red up-triangles represent the results obtained with the GA fitting method (70 different low energy configurations). The blue down-triangles are the predicted adsorption energies for the remaining 128, mostly high energy configurations, obtained with the fitted classical force field. 15 data points, for which the classical energy is higher than 30 kJ mol1, are not shown.
[image:5.595.55.285.53.218.2] [image:5.595.312.538.474.632.2]by using the GA fitting method this can be done in a fast and efficient way.
4.
Summary and outlook
A genetic algorithm was used to optimise classical force field parameters to model molecule–solid interfaces. We took water–ZnO(0001) as a benchmark system to test the perfor-mance of the method. The adsorption energies from the classical force field were matched to the DFT calculations for various conformations of the water molecule on the surface. In order to describe the fluid–solid interface realistically, the force field must be capable of reproducing a wide range of structures and energies and we have shown that the GA method can efficiently handle a large data set. A subset of 100 low and high energy configurations of water molecules on the ZnO(0001) surface resulted in a classical force field that reproduced well the DFT potential energy landscape of the water–ZnO interfacial interactions and predicted good adsorption energies for a further 98 conformations that were not used in the fit. We also demonstrate the importance of the right choice for the fitted data sample. If the subset contains mostly low energy configurations the fitting procedure does not necessarily lead to good results for the high energy configurations and vice versa. This means that fitting to a non-representative sample of the adsorption energy landscape could lead to wrong predictions of physical properties in a molecular dynamics study.
Although this work has been applied to the specific system of water on a ZnO surface, the method can be used to model any system. It is especially suitable for more complicated systems where there are a large number of interaction parameters, such as the adsorption of complex molecules on surfaces with a variety of adsorption sites. Although large systems are beyond the reach of density functional calculations the algorithm can be used in combination with the ‘building block approach’,14,16,17
where the macromolecules are broken down into smaller chemical subunits. The GA fitting procedure can be applied to these smaller sub-molecules and, assuming transferability of the parameters, the classical force field of the whole macromolecule can be developed.
We presented a method that generates surface potentials for interfacial systems in a very fast and efficient way. A standard LJ and Coulombic potential is able to capture the complexity of the interfacial interaction over a broad energy distribution. However, the method is implemented in a flexible way so that other potential forms could be used. Additionally, the GA is in principle capable of fitting the partial charges, assuming neutral conditions at the surface, without having any pre-information from DFT calculations. In this work the fit is based on energy differences for a variety of conformations, however, other data, such as structural information, could be used by modifying the information that enters the fitness function.
Acknowledgements
We wish to thank Anatoly V. Berezkin and P. Ulrich Biedermann from theMax Planck Institut fu¨r Eisenforschungfor making their DFT calculations available for us and for valuable discussions. Furthermore, we would like to thank Pim Schravendijk for his help and fruitful discussions and Christoph Junghans for critical reading of the manuscript. Funding for Karen Johnston was provided by the MMM Initiative of the Max Planck Society.
References
1 K. Wandelt and S. Thurgate,Solid–liquid interfaces: Macroscopic phenomena—microscopic understanding, Springer-Verlag, Berlin, 2003.
2 S. Mann,Biomineralization, Principles and Concepts in Bioinorganic Materials Chemistry, Oxford, 2001.
3 D. K. Chattopadhyay and K. V. S. N. Raju,Prog. Polym. Sci., 2007,32, 352–418.
4 E. Rauls, S. Blankenburg and W. G. Schmidt,Phys. Rev. B, 2010, 81, 125401.
5 L. Pastewka, S. Moser and M. Moseler,Tribol. Lett., 2010,39, 49–61.
6 J. H. Harding and D. M. Duffy, J. Mater. Chem., 2006, 16, 1105–1112.
7 G. Voskerician, M. S. Shive, R. S. Shawgo, H. von Recum, J. M. Anderson, M. J. Cima and R. Langer,Biomaterials, 2003, 24, 1959.
8 G. Grundmeier, W. Schmidt and M. Stratmann, Electrochim. Acta, 2000,45, 2515–2533.
9 A. A. Skelton, T. Liang and T. R. Walsh, ACS Appl. Mater. Interfaces, 2009,1, 1482–1491.
10 D. Bonn, J. Eggers, J. Indekeu, J. Meunier and E. Rolley,Rev. Mod. Phys., 2009,81, 739–805.
11 D. J. Cole, M. C. Payne and L. C. Ciacchi,Phys. Chem. Chem. Phys., 2009,11, 11395–11399.
12 M. I. McCarthy, G. K. Schenter, C. A. Scamehorn and J. B. Nicholas,J. Phys. Chem., 1996,100, 16989–16995. 13 A. V. Bandura and J. D. Kubicki,J. Phys. Chem. B, 2003,107,
11072–11081.
14 L. Delle Site, C. F. Abrams, A. Alavi and K. Kremer,Phys. Rev. Lett., 2002,89, 156103.
15 P. Schravendijk, N. F. A. van der Vegt, L. Delle Site and K. Kremer,ChemPhysChem, 2005,6, 1866–1871.
16 P. Schravendijk, L. M. Ghiringhelli, L. Delle Site and N. F. A. van der Vegt,J. Phys. Chem. C, 2007,111, 2631–2642.
17 L. M. Ghiringhelli, B. Hess, N. F. A. van der Vegt and L. Delle Site,J. Am. Chem. Soc., 2008,130, 13460–13464.
Fig. 7 Comparison of the DFT results for the adsorption energies with the ones from classical simulations. The black line is the perfect match, where the classical adsorption energies are in full agreement with the DFT results. The red up-triangles represent the results obtained with the GA fitting method (70 different high energy configu-rations). The blue down-triangles are the predicted adsorption energies for the remaining 128, mostly low energy configurations, obtained with the fitted classical force field.
[image:6.595.55.286.51.216.2]18 D. J. Cole, M. C. Payne, G. Csanyi and S. M. S. L. C. Ciacchi, J. Chem. Phys., 2007,127, 204704.
19 T. G. A. Youngs, D. Weber, L. F. Gladden and C. Hardacre, J. Phys. Chem. C, 2009,113, 21342–21352.
20 J. Schneider and L. C. Ciacchi,J. Chem. Theory Comput., 2011,7, 473–484.
21 D. E. Goldberg,Genetic Algorithms in Search, Optimization and Machine Learning, Addison-Wesley Professional, 1989.
22 J. D. Gale,J. Chem. Soc., Faraday Trans., 1997,93, 629. 23 T. Strassner, M. Busold and A. H. Wolfgang,J. Comput. Chem.,
2002,23, 282–290.
24 M. Valtiner, M. Todorova, G. Grundmeier and J. Neugebauer, Phys. Rev. Lett., 2009,103, 065502.
25 J. P. Perdew, K. Burke and M. Ernzerhof,Phys. Rev. Lett., 1996, 77, 3865.
26 P. E. Bloechl,Phys. Rev. B: Condens. Matter, 1994,24, 17953. 27 G. Kresse and J. Joubert,Phys. Rev. B: Condens. Matter, 1999,3,
1758.
28 G. Kresse and J. Fuerthmueller,Comput. Mater. Sci., 1996,6, 15. 29 G. Kresse and J. Fuerthmueller,Phys. Rev. B: Condens. Matter,
1996,54, 11169.
30 A. V. Berezkin, P. Schravendijk and P. U. Biedermann, manuscript in preparation.
31 R. S. Mulliken,J. Chem. Phys., 1955,23, 1833–1840.
32 I. G. Csizmadia, Theory and Practice of MO Calculations on Organic Molecules, Elsevier, Amsterdam, 1976.
33 F. M. Bickelhaupt, N. J. R. van Eikema Hommes, C. F. Guerra and E. J. Baerends,Organometallics, 1996,15, 2923–2931. 34 M. Schiek, K. Al-Shamery, M. Kunat, F. Traeger and C. Wo¨ll,
Phys. Chem. Chem. Phys., 2006,8, 1505–1512.
35 W. Humphrey, A. Dalke and K. Schulten,J. Mol. Graphics, 1996, 14, 33–38.
36 B. Hess, C. Kutzner, D. van der Spoel and E. Lindahl,J. Chem. Theory Comput., 2008,4, 435–447.
37 U. Essmann, L. Perera, M. L. Berkowitz, T. Darden, H. Lee and L. G. Pedersen,J. Chem. Phys., 1995,103, 8577–8593.
38 H. J. C. Berendsen, J. P. M. Postma, W. F. van Gunsteren and J. Hermans,Interaction Models for Water in Relation to Protein Hydration, in Intermolecular Forces, D. Reidel Publishing Company, Dordrecht, 1081.
39 W. L. Jorgensen, D. S. Maxwell and J. Tirado-Rives,J. Am. Chem. Soc., 1996,118, 11225–11236.