10th International Conference on Hydroinformatics HIC 2012, Hamburg, GERMANY
MAXIMUM ENTROPY DESIGN OF WATER DISTRIBUTION
SYSTEMS UNDER MULTIPLE OPERATING CONDITIONS
ANNA M. CZAJKOWSKA, TIKU T. TANYIMBOH
Department of Civil Engineering, University of Strathclyde Glasgow John Anderson Building, 107 Rottenrow, Glasgow G4 0NG
This paper presents an optimal design methodology for the design of water distribution systems based on a multi-objective genetic algorithm, namely NSGA II, coupled with water distribution network simulation software, EPANET 2 and subroutine that calculates entropy. The novelty of this research is that it is a reliability-based approach that combines least cost design based on real-world commercial pipe sizes with maximum entropy for water distribution systems working under multiple operating conditions. The new approach has been demonstrated by designing a well known benchmark network. Results generated using multiple operating conditions and the commonly used single operating condition are presented and compared. It is shown that designs based on multiple operating conditions do not entail excessive cost, have more uniform pipe diameters and are more reliable.
INTRODUCTION
The optimal design of water distribution systems (WDSs) belongs to an inherently complicated class of problems that has always been characterised as NP-hard in the literature. Obtaining optimal design of WDS using discrete pipe sizes is a most challenging problem. Many researchers have endeavoured to use multi-objective evolutionary algorithms, which have ability to handle discrete variables, and combined them with hydraulic simulation software.
Another complexity in designing the optimal WDS is to choose the method to evaluate network reliability, a measure of the ability of network to satisfy demands under normal and abnormal operating conditions. There is no general definition for hydraulic reliability and more importantly, it is time consuming and complicated to calculate. As an answer, researchers have proposed different surrogate measures, such as entropy.
An accurate entropy formulation was first introduced by Tanyimboh and Templeman [13] and since then it was tested on many different networks over the years. In the same paper, there is evidence that designs based on entropy are not only more reliable in comparison to minimum cost designs but also computationally easy to achieve. The same authors [14] proved that the uniformity of pipe diameters corresponds to higher entropy value. Tanyimboh and colleagues [9, 12] demonstrated strong positive correlation between entropy and reliability, and between entropy and failure tolerance. In addition, Tanyimboh and Setiadi [10] proved that relationship between reliability and entropy is robust and an increase in entropy value coincides with a better network performance as measured by reliability.
usually referred to as steady-state simulation which assumes that nodal demands are constant. It is common practice to use maximum daily demand and steady state modelling in designing WDS. However in reality demands vary with the time of the day and there are many different loading patterns that have to be satisfied by the network. It should also be mentioned that even if a network satisfies maximum daily demand it does not mean other operating conditions will be satisfied, as the pressure constraints might not be satisfied [6]. Moreover, feasible designs based on SOC will generally be infeasible for multiple operating conditions (MOCs). Accordingly, the aim of this paper is (a) to extend the maximum entropy approach to MOCs and (b) to demonstrate that designs based on MOC and maximum entropy approach not only can handle multiple loading patterns satisfactorily but are also more reliable than SOC designs.
PROBLEM FORMULATION AND SOLUTION
The objectives considered are minimisation of the network’s initial construction cost, subject to ensuring adequate pressures at all nodes and maximization of entropy. Since there is more than one objective included, it has to be solved using multi-objective genetic algorithm (MOGA). An important problem associated with MOGA is the poor ability to handle constraints that are mainly carried out by penalizing infeasible solutions. Therefore it could obstruct the search capabilities and may direct to suboptimal designs. To ensure that achieved design is optimal or near optimal, the approach does not assign any penalties (i.e. constraint violation penalties are not used in the present approach). The overall problem formulation can be summarised as follows.
Minimization of Network Cost
The objective function used to minimize the network cost is formulated as
∑
=
= np
i
i i
i D L
C Cost
1
) ,
( (1)
where Ci(Di,Li) is the cost of the pipe i with diameter
D
i and lengthL
i; np representsnumber of pipes in the system.
Above formulation is subject to following constraints:
1. Nodal mass balance and energy conservation, that are satisfied externally by
EPANET 2 hydraulic solver;
2. Discrete pipe sizes selected from a set of commercially available sizes which are
included within NSGA II code; and
3. Minimum pressure at critical node must be greater than or equal to the desired
Minimization of Critical Node Pressure Deficit
i des
i H
H
Deficit= − ; des
i
i H
H < (2)
where i is the critical node; H is the available head at node i; and i des
i
H is the desired head
at node i. The desired head is the nodal head above which the demand is satisfied in full and the critical node is the node with the lowest pressure within the network.
Maximization of Entropy
Knowing the pipe flow rates and directions, the entropy function can be written as [12]:
+ − − =
∑
∑
∑
∈ =∉ iNj j
ij j ij j j j j J j j IN j j j T q T q T Q T Q T T T Q T Q K S ln ln 1 ln 1 (3)
where S is the entropy, K is an arbitrary positive constant often taken as 1. IN represents the set consisting of source or input nodes and J the number of nodes. T is the total supply and
Tj the total flow reaching node j. Also Qj represents the demand at demand node or supply
at supply node and qij is the flow rate in pipe ij, while Nj means all the nodes immediately
upstream of and connected to node j.
METHODOLOGY
The general multi-objective genetic algorithm code, namely NSGA II [3], was modified for the WDS purposes and coupled with hydraulic simulation software, EPANET 2 [7] to enable the approach to handle the various system components in the design and optimization process. In order to include reliability measure within the code, external program, that can calculate entropy for any given layout, was developed and integrated with NSGA II and EPANET 2. In order for genetic algorithm to handle SOC and MOC, certain changes within code were performed. Created multi operating conditions genetic algorithm (MOCGA) can work for any number of operating conditions.
It is necessary to ensure, that pressure constraints are satisfied for all loading patterns, so each operating condition of each design undergoes nodal pressure and pipe flow evaluation performed by EPANET 2 (i.e. in case of three operating conditions, one design goes through EPANET 2 three times). Then, to reduce several values (i.e. each representing one loading pattern) into one value for each objective function, different methods have been employed and applied as follows.
1. In case of entropy, the MOCGA adds together the individual values to reflect
2. For node pressure deficit, the MOCGA chooses the maximum deficit, so if nodal pressure for any loading pattern is lower than desired pressure, the design is treated as infeasible.
3. The cost does not require further analysis, as each operating condition has
identical cost for the particular design (i.e. the same set of pipe diameters).
For comparison purposes solutions for both one and three operating conditions based on 200 000 function evaluations (i.e. a population size of 200 for 1000 generations) were allowed. The probability of crossover and mutation rate was set to 1.0 and 0.03125 respectively. CPU time required for one operating condition was about 8 minutes and 20 minutes for three operating conditions, on PC with following configuration: Intel Core i3 @ 2,4GHz and RAM 3GB.
Among all 200 000 achieved designs, feasible solutions have been selected using sorting subroutine written in BASH (Unix shell). Then, according to cost and entropy, only non-dominated designs have been chosen to analyse. Finally, the achieved designs undergo reliability calculations using Head-Dependent Analysis software, called PRAAWDS, developed by Tanyimboh and Templeman [11]. Definition of reliability used in this approach can be found in Tanyimboh and Templeman [12].
SAMPLE NETWORK
To illustrate the new approach, the well known hypothetical 2 loop network was chosen. The network (Figure 1) was first presented by Alperovits and Shamir [1] and consists of 7 nodes, 8 pipes with 2 loops and is gravity fed from 1 reservoir. The pipes are all 1000m long with Hazen-Williams coefficient of 130. The details of 14 discrete pipe sizes used, as well as other data, can be found in Alperovits and Shamir [1].
Figure 1. Schematic of sample network
multiplied by 0.6 as in well known “Anytown” network [15]. Both demand multipliers were applied to all nodes.
RESULTS AND DISCUSSION
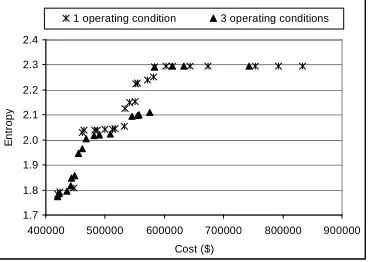
Figure 2 illustrates Pareto optimal fronts of cost versus entropy for SOC and MOC. As it can be seen entropy values are approximately 3 times higher for 3 operating conditions, simply because entropies have been added together within the program in the case of MOC. The main reason for adopting the sum of the entropy values was to obtain more spread in the solutions by increasing the distinction between the solutions. However, to facilitate comparing results achieved using SOC and MOC, entropy values obtained from 3 operating conditions have been divided by 3, then analysed and presented on the figures shown below.
1.5 2.0 2.5 3.0 3.5 4.0 4.5 5.0 5.5 6.0 6.5 7.0
400000 500000 600000 700000 800000 900000 Cost ($)
E
n
tr
o
py
[image:5.595.207.391.471.602.2]1 operating condition 3 operating conditions
Figure 2. Pareto optimal fronts for 1 and 3 operating conditions
1.7 1.8 1.9 2.0 2.1 2.2 2.3 2.4
400000 500000 600000 700000 800000 900000 Cost ($)
E
n
tr
o
p
y
1 operating condition 3 operating conditions
Figure 3. Pareto optimal fronts after merging solutions from 1 and 3 operating conditions
R2 = 0.83
R2 = 0.96
250 270 290 310 330 350 370 390 410
1.7 1.8 1.9 2 2.1 2.2 2.3 2.4 Entropy A v e ra g e d ia m e te r (m m )
[image:6.595.204.390.155.285.2]1 operating condition 3 operating conditions 1 operating condition 3 operating conditions
Figure 4. Effect of entropy on average pipe size
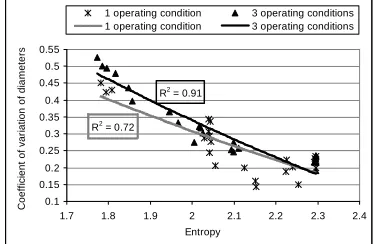
R2 = 0.72
R2 = 0.91
0.1 0.15 0.2 0.25 0.3 0.35 0.4 0.45 0.5 0.55
1.7 1.8 1.9 2 2.1 2.2 2.3 2.4 Entropy C o e ff ic ie n t o f v a ri a ti o n o f d ia m e te rs
1 operating condition 3 operating conditions 1 operating condition 3 operating conditions
Figure 5. Effect of entropy on pipe size distribution
Figure 4 clearly demonstrates correlations between entropy and average pipe diameter. Entropy increases as the pipes sizes increase, which appears to contribute to the growth of the network reliability, simply because larger pipes have lower breakage rates than the smaller ones [10]. What is more important, the results of Figure 4 show that coefficient of correlation is higher for 3 operating conditions. It strengthens previous assumption that using multiple operating conditions leads to more uniform pipe sizes. As it is already known, the more uniform pipe sizes result from more uniform flows, which yield higher hydraulic reliability [10].
A comparison of the correlation between pipe size distribution and entropy is shown in Figure 5. Pipe size distribution in other words means the coefficient of variation of the diameters - all the pipes have the same length - which measures the uniformity of the pipe diameters. It has been chosen to present the results as previously it has been demonstrated to be simple but very efficient way to show the best solution [10]. Higher positive correlation for designs achieved using 3 operating conditions suggests that solutions based on MOC outperform the ones obtained by SOC.
To fully validate the new approach and results, additional reliability calculations [12]
were performed and presented in Figure 6. An excellent correlation of 2=0.97
R between
[image:6.595.203.391.314.436.2]operating condition produced much less correlation and showed a lot more scatter than the ones obtained using 3 operating conditions. This clearly confirms that the approach based on MOC produces designs which are more reliable.
R2 = 0.87
R2 = 0.97
0.99955 0.99960 0.99965 0.99970 0.99975 0.99980 0.99985 0.99990
1.7 1.8 1.9 2 2.1 2.2 2.3 2.4 Entropy
R
e
lia
b
ili
ty
1 operating condition 3 operating conditions 1 operating condition 3 operating conditions
Figure 6. Correlations between reliability and entropy
It should be highlighted that designs based on MOC have similar entropy values for similar cost. This leads to a conclusion that using approach presented in this paper to incorporate MOCs will lead to more reliable designs, which also will satisfy all the loading conditions used in the design.
CONCLUSIONS
A new penalty-free reliability based approach that combines least cost design and maximum entropy for WDSs has been presented. The novelty of this research is that the algorithm can work under multiple operating conditions for any given network. The model was applied to well known 2 loop network. Two cases were studied, one with SOC, the other considering MOC. It is known that designs based on SOC are generally infeasible for MOC, however both sets of solutions were presented to demonstrate that MOC approach is competitive. In both cases, the proposed model found comparable entropy values for similar cost. However designs based on MOC clearly outperform solutions obtained by SOC in terms of feasibility, pipe size distribution and reliability. In order to extend the new approach to real world networks, further work is required to include network components like pumps, tanks and valves. Also, this investigation to extend the maximum entropy design approach to MOCs is still at an early stage and more research is indicated.
ACKNOWLEDGEMENT
REFERENCES
[1] Alperovits, E. and Shamir, U., “Design of optimal water distribution systems”, Water Resources
Research, Vol. 13, No. 6, (1977), pp 885-900.
[2] Cunha, M.C. and Sousa, J., “Water distribution network design optimization: simulated annealing approach”, Journal of Water Resources and Management, Vol. 125, No. 4, (1999), pp 215-221.
[3] Deb, K., Pratap, A., Agarwal, S. and Meyarivan, T., “A fast and elitist multi-objective genetic algorithm: NSGA II”, IEEE Transactions on Evolutionary Computation, Vol. 6, No. 2, (2002), pp 182-197.
[4] Eusuff, M.M. and Lansey, K., E., “Optimization of water distribution network design using the shuffled frog leaping algorithm”, Journal of Water Resources and Management, Vol.129, No. 3, (2003), pp 210-225.
[5] Prasad, T.D. and Park, N.S., “Multiobjective genetic algorithms for design of water distribution networks”, Journal of Water Resources and Management, Vol. 130, No. 1, (2004), pp 73-82.
[6] Prasad, T.D., “Design of pumped water distribution networks with storage”, Journal of Water
Resources Planning and Management, Vol. 136, No. 1, (2010), pp 129-132.
[7] Rossman, L.A., “EPANET 2 users manual”, US Environmental Protection Agency.
[8] Surendran, S., Tanyimboh, T.T. and Tabesh, M., “Peaking demand factor-based reliability analysis of water distribution system”, Advances in Engineering Software, Vol. 36, No. 11-12, (2005), pp 789-796.
[9] Tanyimboh, T.T., Tietavainen, M.T and Saleh, S.A.E., “Reliability assessment of water distribution systems with statistical entropy and other surrogate measures”, Water Science and
Technology – Water Supply, Vol. 11, No. 4, (2011), pp 437-443.
[10] Tanyimboh, T.T. and Setiadi, Y., “Sensitivity analysis of entropy-constrained designs of water distribution systems”, Engineering Optimization, Vol. 40, No. 5, (2008), pp 439-457.
[11] Tanyimboh, T.T. and Templeman, A.B., “Seamless pressure-deficient water distribution system model”, J. Water Management, ICE, Vol. 163, No. 8, (2010), pp 389-396.
[12] Tanyimboh, T.T. and Templeman, A.B., “A quantified assessment of the relationship between the reliability and entropy of water distribution systems”, Civil Engineering and Environmental
Systems, Vo. 19, No. 3, (2000), pp 223-253.
[13] Tanyimboh, T.T. and Templeman, A.B., “Optimum design of flexible water distribution networks”, Civil Engineering Systems, Vol. 10, No. 3, (1993a), pp 243-258.
[14] Tanyimboh, T.T. and Templeman, A.B, “Using entropy in water distribution networks”,
Integrated computer applications in water supply, Vol. 1, (1993d),