City, University of London Institutional Repository
Citation
:
Bowyer, S., Caraher, M., Eilbert, K. and Carr-Hill, R. (2009). Shopping for food:
lessons from a London borough. British Food Journal, 111(4-5), pp. 452-474. doi:
10.1108/00070700910957294
This is the unspecified version of the paper.
This version of the publication may differ from the final published
version.
Permanent repository link:
http://openaccess.city.ac.uk/489/
Link to published version
:
http://dx.doi.org/10.1108/00070700910957294
Copyright and reuse:
City Research Online aims to make research
outputs of City, University of London available to a wider audience.
Copyright and Moral Rights remain with the author(s) and/or copyright
holders. URLs from City Research Online may be freely distributed and
linked to.
City Research Online:
http://openaccess.city.ac.uk/
publications@city.ac.uk
Shopping for Food: Lessons from a London Borough.
Sarah Bowyer 1
Martin Caraher 2
Kaye Eilbert ?
Tom Duane 3
Professor Roy Carr-Hill 4
1
Senior Associate Lecturer and
Research Fellow
Faculty of Health
Leeds Metropolitan University
Calverley Street
Leeds
LS1 3HE
s.bowyer@leedsmet.ac.uk
2
Reader in Food and Health Policy
Centre for Food Policy
City University
Northampton Square
London EC1V OHB
m.caraher@city.ac.uk
020 7040 4161
3
Geographical Information System
Officer
Research and Analysis Team
Customer and Corporate Services
Directorate
London Borough of Hackney
Hackney Town Hall
Mare Street
E8 1EA
4
Centre for Health Economics
University of York
Heslington
York
Kay W. Eilbert
Senior Public Health Strategist
Tower Hamlets Primary Care Trust
Mile End Hospital Burdett House
Bancroft Rd
London E1 4DG
kay.eilbert@thpct.nhs.uk
02082238598
Dr Kay Eilbert
At the time of this research, Kay led on obesity and cancer work for City &
Hackney PCT. Her interests lie in primary prevention and in practical
applications of the social determinants of health model through such efforts as
food studies to influence local policy on food provision. In Tower Hamlets
PCT she is responsible for cancer and for a healthy workplace initiative across
the borough and is currently leading on food mapping research around
secondary schools in Tower Hamlets. She has experience in public health in
the UK and the US, as well as internationally while working for UNICEF in
Africa. She has a Master of Public Health, as well as a Doctor of Public Health
for which her dissertation topic was community health partnerships.
Bios
Sarah Bowyer
community roles relating to both treatment and prevention of ill health. In 2004 she returned to academia to complete an MSc in Food Policy at the Centre for Food policy at City University and was subsequently employed as a research assistant working on a project looking at food access and at consumer attitudes to food. She currently holds a position as a senior associate lecturer and research fellow at Leeds Metropolitan University delivering on a project assisting schools in the implementation of school food standards and a research project studying free school meals. Through her work she aims to bring clarity on food issues to all members of the community.
Dr Martin Caraher
Martin has worked extensively on issues related to food poverty, cooking skills, local sustainable food supplies, the role of markets and co-ops in promoting health, farmers markets, food deserts & food access, retail concentration and globalisation.
Recent work has focused on the policy development of food advertising, the impact of advertising regulation, food taxation and cooking skills.
He sits on the London Food Board which advises the Mayor of London on food in London and the South East Food and Public Health Group. He chaired the National Primary Care Team Community Food Access programme.
Tom Duane
Tom works as a Geographical Information System Officer in Hackney Council. He is interested in how we can use maps to display complex information in an accessible and way that is understandable to all.
Professor Roy Carr-Hill
Roy has extensive experience in co-ordinating and managing major research projects especially those concerned with the design of monitoring and evaluation systems for aid programmes in basic education, non-formal education, health manpower planning. Participation in many overseas consultancies and development projects in relation to health and education on behalf of international agencies such as Swedish International Development Authority (SIDA), Department for International Development, UK (DfID), UNICEF, UNESCO, and the British Council. He has expertise in research methodology and statistics as applied across the social sciences; and in educational planning and management.
Abstract
Purpose To measure access to food in an inner London Borough.
Methodology There were six phases, which included designing food baskets, consultation with local residents and a shop survey. Recognising the cultural make up of the borough we developed food
baskets and diets for four key communities namely White British, Black Caribbean, Turkish and Black
African. We choose three areas to study and these were defined within a 500 metre radius.
Findings The findings paint an intricate web of interactions ranging from availability in shops to accessibility and affordability being key issues for some groups. We found that in the areas studied
there was availability of some key healthy items, namely fresh fruit and vegetables, but other items
such as fresh meat and poultry and fresh fish, lower fat versions of milk, high fibre pasta and rice were
not available. In addition for some groups such as elderly people there was heavy reliance on the bus to
a major supermarket as fresh cuts of meat and fish were not available locally. Other groups such as
Black African and Black Caribbean similarly found it difficult to source their culturally appropriate
food needs locally. Access was found be defined as wider than just physical distance to shops, for
many shopping was made more difficult by having to use taxis and inconvenient buses. Small shops
were important in delivering healthy food options to communities in areas of deprivation and offered a
better range and more appropriate food than the branches of the major supermarket chains.
Policy Implications The existence of small shops is fragile and many are shutting down, this can change the face of local provision from one week to the next and this points to the importance of
monitoring the impact of shops and shop closures on healthy food availability. Relying on indicators
such as fruit and vegetables may miss the availability of other healthy options in the diet. Cultural
INTRODUCTION
The academic literature is redoubt with arguments over the existence of ‘food deserts’ with
some arguing that the term is the result of an over active policy imagination but not based on
any empirical research (Cummins and MacIntyre, 2002). Such claims are generally made on
the basis of one dimensional measurement indices such as physical distance from shops and
often do not relate food prices to actual income (Cummins and MacIntyre, 2002; Cummins,
Pettricrew, and Sparks, 2005). On the other hand, when a number of different measures are
used, as in the Seacroft study in Leeds, problems are identified with accessing a healthy
affordable diet (Wrigley, 2002; Wilson, Alexander and Lumbers, 2004). The Seacroft study
showed that the location of a large superstore, in an area that was previously labelled a ‘food
desert’, helped improve access for some in that community (Wrigley, 2002).
The mapping of ‘food deserts’ in Staffordshire by the National Consumer Council (O’Neill,
2005) and by White and colleagues in Newcastle (White et al, 2004) showed that in peri-
urban areas that access and ‘food deserts’ are complex and multi-layered, as indeed did the
original work by Dowler and colleagues in a London borough and subsequent follow-on work
in the West Midlands (Donkin et al, 1999; Rex and Blair, 2003). Problems with access to food
tend to be seen either as the result of social and retail planning or as the consequences of
individual choices, in reality they are a combination of both structural and individual influences
(Caraher, 2005). Food access can be limited by many factors ranging from physical distance
to shops, physical and social impairment, to lack of skills such as budgeting, cooking and food
knowledge (Dibsdall, Lambert and Frewer, 2002; Dibsdall et al, 2003).Rather than arguing
that one is more important than the other or that the issues are structural or individual, it can
be contended that there is a complex interplay of factors and that a lack of cooking skills can
be exacerbated by a lack of money or resources, whereas money and resources can help
increase your chances of easing your way out of the situation and compensate for limited
cooking skills. Similarly with availability and access there is a complex interplay (Lang et al,
1999; Dowler, Turner with Dobson, 2001). In this article we refrain from using the term ‘food
desert’ unless quoting others and prefer use of the term ‘food access’. Food access can be
taken to have a broader meaning than just the availability or lack of shops or food in shops
(food deserts) and incorporate issues such as credit access, cultural capital and prices
relative to income. There are five words which act as metonyms for the various processes
involved in individuals or families obtaining their food and these are:
Access.
Affordability.
Awareness.
Acceptability and
Many definitions of food poverty or food insecurity have cultural or social elements to them
(acceptability and appropriateness), it is not just that the correct amount of food should be
available but also that food on offer should be culturally appropriate and acceptable, as well
as affordable. Many of those living in food poverty report this aspect of food insecurity
themselves. For example, many say that not being able to afford a ‘roast’ or a ‘hot’ meal is for
them an indicator of both absolute and cultural poverty (Dowler, 1998). Food poverty data for
those on low incomes in an area of London showed that food insecurity may be a common
feature of households that have incomes at the level of the UK national minimum wage or
lower, with 20% being food insecure and 6% food insecure with hunger (Tingay et al, 2003). A
2007 FSA report showed that just over two-fifths on low incomes (39%) reported worrying
about running out of money for food and 36% indicated that they could not afford to eat
balanced diets (Nelson et al, 2007). In terms of policy to address food inequality some key
issues emerged in ‘The Tackling Health Inequalities’ report which saw local planners as
mapping ‘food desserts (sic) so local 5-A-DAY programmes can improve food access’
(Department of Health, 2003; p 33).
Some studies have discovered a positive association with self-reported health and health
service provision, access to financial services for women and for men a positive association
between health and access to large food stores (Stafford et al, 2005, Cummins et al,2005). It
is unlikely that these are direct pathways but indicative of other developments in an area such
as regeneration or rising affluence in that area. It is also likely that there is a tipping point.
One study from Alameda County in the US (Yen and Caplan, 1999) showed a correlation
between a high number of stores and increased risk of death. It may be that, in the early
stages of an area being developed, the location of a store may be an indicator of growing
affluence and meets a demand for basic needs; and that after certain basic needs are met the
distress caused by over-choice of rising affluence, indicated by a large number of stores and
the food on offer in an area, has a negative impact on health. These latter developments may
be an indicator of rising relative poverty levels or a growing divide between the rich and the
poor in that area. Some studies have shown the impact of improved local retail on wider
indicators such as crime and disorder (Carley, Kirk and McIntosh, 2001).
At a supply level in London the retail situation is complicated, with two major retailers
controlling 78% of the London food retail sector (Sustain, 2004). Alongside this concentration
is the existence of the independent retail sector, competing not only against the major
supermarket chains but also one another and with little differentiation in who they serve or
what they serve. Not only do small shopkeepers have to compete with the major supermarket
chains opening up branches (superstores greater than 2500m2; supermarkets less than
2500m2) but now the supermarket chains are moving into the convenience sector and
competing like for like in the same streets. Tesco, Asda and Sainsbury’s have all indicated
five years. There are fears that the high street will become homogenised and that the major
retailers will obliterate the small independent retailers (New Economics Foundation, 2003;
House of Commons All-Party Parliamentary Small Shops Group, 2005). The consequences of
market concentration are widespread and in the long-term may not be good for consumers
(Caraher, 2005).
Hackney, where the research took place, is one of the most culturally and ethnically diverse
boroughs in London. This is reflected in its food habits and cuisines. The key ethnic groups in
Hackney are:
White 59% (44% White British, 15% White Others).
Black Caribbean 10%.
Black African 12%.
There is also a significant Turkish and Kurdish community, many of whom are heavily
engaged in the fruit and vegetable retail trade. According to data from the Office of the Deputy
Prime Minister (ODPM), Hackney’s wards are all within the top 20 per cent of the most
deprived wards in the country. One third of the population of Hackney is overweight. Also
relevant to this study is the fact that less than 50 per cent of households have a car (BMG
Research Report, 2004). A 1999 East London City Health Authority report, three areas in
Hackney were identified with poor access to food and called ‘food deserts’ (Frize, 1999). The
borough of Hackney is targeted for redevelopment for the Olympics in London in 2012.
Methodology
This research was designed to inform and contribute to future work in the borough.
The aims of the research were:
1. To produce indices of access to ‘healthy’ food baskets in shops in deprived wards of
Hackney and use this data to inform local strategy development for promoting healthy
eating among low-income households in the borough.
2. To map the locations of both outlets selling healthy ‘healthy’ and ‘unhealthy’ food in
the selected wards (and compare with existing food premises databases).
3. To contribute to work with local retailers to improve access to healthy food for
deprived areas within Hackney.
The research was carried out between February and May 2006. There were six phases to the
research process:
1. Identifying and agreeing study areas with the Steering Group.
2. Consulting the local community-eight focus groups were run with sixty five individuals
participating this included four parents groups (two males, thirty one females), one
young peoples group (five males, three females), one older peoples group (three
males, seven females), a Turkish group (five females) and an African group (five
3. Designing the food basket and the seven day menu case studies concomitant with
phases 2 and 4.
4. Designing the form and process for shop data collection on availability and price.
5. Conducting a census of shops.
6. Conducting Shopkeeper interviews with retailers.
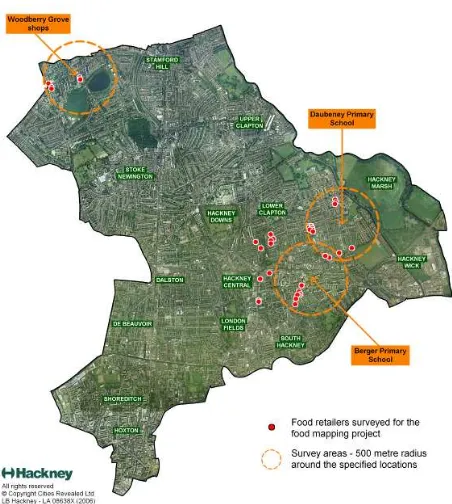
In the three ward areas chosen for the study, a central point was chosen to determine
catchment areas to study (see figure 1). These three areas were chosen as the local authority
had already identified them as areas for regeneration and two of them coincided with the
areas identified in the 1999 report on food access in East London (Frize, 1999). The focus
was on exploring the shopping experience within these areas as opposed to using postcodes
to map distance of homes from shops. Our rationale for this were twofold, firstly the
regeneration staff in the local authority informed us that the main focus was on town centres
and that this was where the spotlight of any follow on work would be, secondly we wanted to
map the shopping experiences of key groups in these areas. In line with other studies the
distance of a 500m radius was agreed as a measure of reasonable physical access to a shop,
hence our results explore access for those households within these catchment areas (Donkin
et al,1999; Dowler et al,2001).
Recognising the cultural diversity of the borough and considering culturally acceptable diets
healthy food baskets were developed for four key communities namely White British,
Black-Caribbean, Turkish (Turkish as used in this article refers to both the Turkish and Kurdish
communities) and Black African.
The starting point was analysis and adaptation from food baskets from past work by people
such as Donkin et al (1999), Dowler et al,(2001), work from Mid Lothian (Midlothian Social
Inclusion Forum and NHS Lothian, 2003) and Newcastle (White et al,2004). The ethnic
groups identified in the Sandwell work, and for which an availability food list was developed,
included White groups, Indian, Pakistani, Bangladeshi and Black (Caribbean). We also used
unpublished data from Scotland in constructing food baskets.* To define a food as healthy or
not the Food Standard Agency ‘nutrient profile scores’ were used and the basket was
constructed around the healthy balanced diet message using the five food groups in the
National Food Model of the Balance of Good Health (Rayner et al,2005), recently revised by
the Food Standards Agency as the ‘eatwell plate’ access (at
www.food.gov.uk/healthiereating/eatwellplate/, accessed 20/09/07). The ‘eatwell plate’ refers to the five food groups (1. fruit and vegetables; 2. bread, rice potatoes, pasta and other
starchy foods; 3. meat, fish, eggs, beans and other non-dairy sources of protein; 4. milk and
the fist four groups each day‘, will provide the body with the wide range of necessary
nutrients. The fifth group, ‘foods and drinks high in fat and/or sugar’, contains items that are
not essential but add variety and palatability to meals and should form the smallest part of the
diet. We consulted with dieticians with experience of working with four defined communities,
both in the initial construction and for later comments on drafts. We also used the focus
groups to consult and comment on the appropriateness of the food baskets in reflecting the
ethnic mix and acceptability and affordable to the populations in the defined areas.
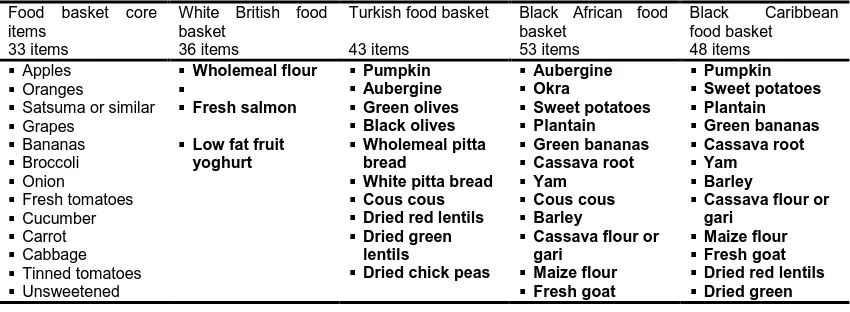
There is a mainstay of 33 food items which are core and common to all baskets. Other items
were added to the food baskets for the White British (three extra items) Black African (focus
on West African, 20 extra items), Turkish (10 extra items) and Black Caribbean (15 extra
items), table 1 contains a list of items). The intention, as already stated, was not to develop
one typical basket (as in the Scotland work) but to include foods which contribute to a healthy
balanced diet and are appropriate for the local populations (as in Sandwell).8 The reason for
the seemingly large number of extra items in the ethnic baskets was that they contained the
original 33 core items which reflect traditional English food availability as well culturally
appropriate foods. This does not necessarily reflect greater calorific intakes but does offer the
potential for a wider variety of food in the diet.
Alongside the food baskets a weekly menu was devised, using the items from the food
baskets, this incorporated three case studies to look at shopping patterns and their effect on
price within the defined catchment areas. They were designed for a family, with a mother
aged 30 years with two children aged eight and three years and represent an ideal, as they
reflect a healthy diet using healthy cooking methods, assume people can cook and have
facilities, and do not include extravagant meals or regular consumption of foods classified as
high in fat and or sugar. We assumed the children were at school and entitled to free school
[image:10.595.86.511.572.728.2]meals so there was no need to cook at home for the family in the middle of the day.
Table 1 Food baskets (items in bold are additions to the core basket).
Food basket core items
33 items
White British food basket
36 items
Turkish food basket
43 items
Black African food basket
53 items
Black Caribbean
food basket 48 items
Apples
Oranges
Satsuma or similar
Grapes Bananas Broccoli Onion Fresh tomatoes Cucumber Carrot Cabbage Tinned tomatoes Unsweetened Wholemeal flour Fresh salmon
Low fat fruit yoghurt Pumpkin Aubergine Green olives Black olives Wholemeal pitta bread
White pitta bread
Cous cous
Dried red lentils
Dried green lentils
Dried chick peas
Aubergine Okra Sweet potatoes Plantain Green bananas Cassava root Yam Cous cous Barley
Cassava flour or gari Maize flour Fresh goat Pumpkin Sweet potatoes Plantain Green bananas Cassava root Yam Barley
Cassava flour or gari
Maize flour
Fresh goat
Dried red lentils
Dried green
*
orange juice Baked beans Reduced sugar baked beans Potatoes Wholemeal bread White bread Weetabix Cornflakes Oats Wholemeal pasta White pasta Brown rice
White long grain rice
Fresh chicken
Lean minced beef
Fresh cod
Fresh eggs
Semi skimmed milk
Skimmed milk
Low fat plain yoghurt
Unsaturated margarine
Fresh tilapia
Dried red lentils
Dried green lentils
Dried kidney beans
Dried black eyed beans
Dried chick peas
Ground nuts Reduced fat evaporated milk lentils Dried kidney beans
Dried black eyed beans
Reduced fat evaporated milk
The data collection form was designed around the food basket items to ascertain if food items
were on shop shelves and the price of the items specified by weight and/or pack size. We
assumed that people on a low-income are under strain to take the cheapest price items and
that choice of brand and perceived quality and variety are not prime considerations although
we know from other work that parents on low-incomes compensate by buying branded goods,
so that other family members do not feel further stigmatised.
Mapping of shops employed two methods, which were iterative, firstly use of local authority
databases and secondly through street-by-street mapping in the ward area chosen. The
Environmental Health Department were contacted and provided lists of all food shops on their
database. Two members of the research team then physically on bicycle and foot, identified
all shops in the three ward areas. Through the census of shops, researchers collected
address and postal code while crosschecking with the Environmental Health database,
together with information on the availability of food list items, prices by specific weight or pack
size, indicators of the quality of the fruit and vegetables and observational commentary on the
shops themselves. Observational protocols were developed to record the overall quality of
shops (cleanliness etc).
This resulted in a total of 50 premises for our chosen study area. If a ward boundary fell along
the middle of a street, the shops on either side were included, since the shopping experience
for the area would include both sides of the street. A letter was sent to all shops in the wards
informing them of the research and inviting them to take part in interviews.
A shop survey of availability of key food items for a healthy food basket, costs and services
not give permission within the timescales to take part in the shop survey and shopkeeper
interviews.
All independent shops were asked if they would like to take part in an interview that focused
on their difficulties in surviving in the current retail climate. Permission was obtained and
[image:12.595.92.318.242.494.2]recorded.
Figure 1 Map of three areas with 37 food shops surveyed
An excel database was then used to analyse the availability of food items; the cost of the full
basket, where available and sub-sections of the basket, according to food groups. The
'descriptives' function in a statistical analysis database (SPSS) was used to analyse the
availability of items and the variation in price in apparently the same items between shops
(prices were converted into per kilogramme prices). Variation in price of core items in each of
the three ethnic baskets was studied and minimum and maximum prices calculated. This data
was used to help construct three case studies, which looked at the availability, price and
shopping pattern regarding a shopping list, constructed from a seven day healthy menu,
designed around the food baskets, for three of the ethnic groups.
For the calculation of the price of the proposed healthy menus it was assumed that an
individual would go to their nearest shop first and buy what they could from there. For the
remaining items they would go to the next nearest shop and so on up to a maximum of five
shops. Finally, for those items available in none of the shops in the local area, as defined in
few shops where they were available was used. In some cases, the initial shop of the
consequent sequence of nearest shops was not realistic, however this appeared to be the
only logical and reasonable way of incorporating pedestrian accessibility.
All qualitative data was transcribed and analysed using a computer programme NUD*IST, a
software package to help manage and explore qualitative data and link ideas and construct
theories relating to the data. The analysis focused on identifying themes and a conceptual
mapping of emerging themes from the stories told and experiences identified.
FINDINGS
First, some commentary on the quality issues before turning to the findings. Our fieldwork and
street-by-street observation discovered more shops than were initially estimated by the
Steering Group and the Environmental Health Department databases. This necessitated
some renegotiating of timescales since original estimates of shops were too low.
The shops
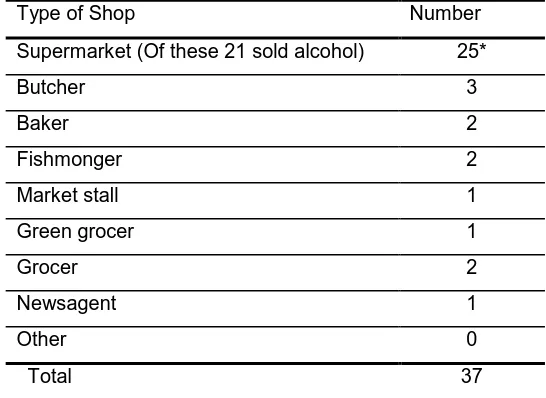
Table 2 provides a breakdown of the 37 shops surveyed, three of these were branches of
major supermarket chains. Thirty one independent shop owners, agreed to be interviewed
[image:13.595.160.433.452.651.2]with three independent shops unable or declining.
Table 2 Breakdown of the 37 shops surveyed for price and availability as classified by our study
Type of Shop Number
Supermarket (Of these 21 sold alcohol) 25*
Butcher 3
Baker 2
Fishmonger 2
Market stall 1
Green grocer 1
Grocer 2
Newsagent 1
Other 0
Total 37
*This included twenty two small, local, independently owned supermarkets and branches of three major
supermarkets , a Tesco Metro and Tescosupermarket, the third was a Somerfield
Analysis of data from interviews with the shop owners or managers found the following:
All of the 31 small shops were family owned with two family owned franchises, the average length of operation was 10 years with the shortest we interviewed being in
There were 63 full time employees, including owners where they worked in the shop, and a total of 53 part time employees.
The shopkeepers reported that one of the major changes in the last five years in Hackney
was the influx of new residents from varying backgrounds. Among those mentioned were
Eastern Europeans (especially Polish), South Americans (Brazilians were mentioned) and
Chinese. This meant that shopkeepers were constantly striving to meet changing cultural food
needs.
In the focus groups consumers viewed local shops as offering an important service and these
can be classified under the four categories of:
Availability and range of choiceof ethnic and culturally appropriate foods.
For some the price of certain foods and raw ingredients.
Providing a friendly face-to-face service.
Convenience, whether for top-up shopping or other services.
On the negative side, small shops were perceived as not being big enough to have a large
variety of goods on offer thus making one-stop shopping untenable. Some negative practices
were pointed out such as ‘the local shop sells soft drinks, chips and sweets and [we] have to
queue for a till alongside {the} sweet counter often with kids in tow’.
Another part of the retail landscape in Hackney are the local markets and the range and
prices of food on offer there, as well as the social element that is enjoyed by many, although
these are situated outside of the areas surveyed here. There were some positive comments
regarding the farmers markets (the young people's focus group) but others were suspicious of
farmers markets and organics and the opinion was expressed that farmers markets were
expensive, ‘they sell food at the high end of the scale’ was a typical comment from the focus
groups.
Food availability and cost
Mapping of the availability of the 33 items in the core food basket showed that:
Every shop surveyed had at least one item from the list on sale.
In 19 shops (51% of shops sampled) there was over 50% of the core basket items.
In three shops (8% of the sample) 100% of the core basket items were available. In these instances the cost of all 33 items was £29.89, £35.05 and £37.84. These three
shops were branches of major national supermarket chains.
The results regarding the availability of core items and availability of complete baskets in
[image:14.595.86.511.728.766.2]shops can be seen in table 3 below.
Table 3 Food basket availability and cost in shops
Core food basket
White British Basket
Turkish Basket
Black African Basket
Black Caribbean
Number of items in basket
33 36 43 53 48
Percentage of shops selling full basket
8% 5% 5% 0% 0%
Price range for cost of all items
£29.89-£37.84 £37.26-£42.55 £37.67-£42.64 0** 0
Price difference
£7.95 £5.29 £4.97 - -
Percentage of shops selling at least half (50%) of basket
51% 57% 51% 46% 46%
*We chose 50% as the cut off point on the basis that this was reasonable range to expect small shops to sell. ** The value is 0 since no shops sold all the foods for Black African and Black Caribbean diets as selected for our food baskets
Only three shops stocked all 33 core items. Only the White British basket could be purchased
completely in a ‘one stop shop’ which was possible in branches of the major supermarket
chains The Turkish basket could be purchased in this manner if packaged olives (e.g. jars)
were substituted for loose olives. Bottled olives, though widely available, were judged to be
unacceptable by Turkish respondents in the focus groups and so for the remainder of the
calculations we have given two figures, one which includes loose olives and one which
excludes olives from the Turkish basket as the price differential is significant.
Availability of the five types of fresh fruit (which were apples, oranges, satsuma or similar,
grapes and bananas) in the core basket was high with 17 shops (46 per cent) selling all five
items but with a price range from £4.79 to £9.39, almost double the cost. Nine shops (24 per
cent) sold all six vegetables and the price ranged from £4.45- £5.94.
The core basket contained two cuts of meat. Six shops sold both meat types and the price
ranged from £4.49 to £7.37/kg. The most and least expensive were in major supermarket
chains.
The core basket contained one type of fish (cod). Five shops sold cod and the price ranged
from £4.41/kg to £7.99/kg. The cheapest cod was in an independent fishmonger despite
‘’specialoffers’’ at one of the major supermarket chains.
The healthier option of some foods e.g. milk (skimmed), pasta (wholemeal) and rice (brown)
of shops selling rice) sold both white and brown rice and 17 (61% of shops selling rice) selling
only white rice.
Shopping for items to purchase a healthy balanced diet
One indicator of access to healthy food, often used, is the number of shops selling fresh fruit
and vegetables, often called the ‘green retail’ index. An analysis of the availability of fresh fruit
and vegetables was made of the surveyed shops as can be seen in the maps in figures 3 and
4, which indicate adequate access to fruit and vegetables in physical terms, as defined by 500
metres, for people living in the defined catchment areas. However further analysis shows a
potential vulnerability if shops were to close or were to stop selling fruit and vegetables in the
future.
Figure 4 shows the shops selling fresh fruit and vegetables. Those living to the east of our
catchment circle have one shop approximately 250 m away from them, but if this shop closed
their nearest shop would be 500m away to the west side of the catchment area. Our maps
indicate physical access but on analysing access with respect to variety and price differences
table 5 shows that there could be issues in accessing culturally acceptable fruits and
vegetables at an affordable price. Vulnerability could be increased if an accessible shop
selling desired fruit and vegetables at an acceptable price shuts down or changes its opening
[image:16.595.165.432.468.656.2]hours.
Figure 3 Daubeney and Berger School areas showing shops selling fruit and vegetables
Cost of a healthy food basket
For all fruit and vegetables the White British basket was the least expensive (it also contained
the least number of items). For all fruit and vegetables there was a price variation ranging
from £2.60 for the Black African to £3.75 for the White British basket (table 4). Regarding the
Turkish basket, we calculated the price excluding the loose olives since these were rarely
available and their cost per kilogramme unit could inflate the basket price by between £5.00
[image:17.595.165.432.68.258.2]and £10.00.
Table 4 The availability and price of fresh fruit and vegetable items in the food baskets
Core food basket
White British Basket
Turkish Basket Black African Basket
Black Caribbean Basket
Number of items in basket
33 36 43 53 48
Number. of fruit items in basket
5 5 5 5 5
Number of shops selling all fruit items
17 17 17 17 17
Price range for cost of £4.79- £9.39 £4.79- £9.39 £4.79- £9.39 £4.79- £9.39 £4.79- £9.39 Price
difference for all fruit items
£4.60 £4.60 £4.60 £4.60 £4.60
Number of vegetable items in basket
6 6 10
(including olives)
8 7
8
(excluding olives)
Number of shops selling all vegetable items
9 9 2
(including olives)
5 6
7
(excluding olives)
Price range for cost of all
vegetable items
£8.77-£9.67 (excluding olives)
Price
difference for all vegetable items
£1.49 £1.49 £3.80
(including olives)
£1.73 £2.32
£0.90 (excluding olives)
Number of shops selling both all fruit
and all
vegetable items
9 9 2
(including olives)
5 6
7
(excluding olives)
Price range for cost of all fruit and vegetable items £11.11-£14.86 £11.11-£14.86 £20.87-£25.38 (including olives) £17.24-£19.84 £12.63- £16.24 £15.23-£17.62 (excluding olives) Price
difference for all fruit and vegetable items
£3.75 £3.75 £4.51
(including olives) £2.39 (excluding olives)
£2.60 £3.61
Data on the quality of the fruit and vegetables was collected by means of a rating scale. On
the whole this was judged by data collectors to be satisfactory to excellent. The range of
prices did not necessarily reflect better quality or convenience and in terms of accessibility the
issue was still one of the customer having to exercise choice to shop around for best value.
Some of the mapping clearly shows this vulnerability of access to other key food items such
as fresh fish and fresh meat, see figure 5. Here we have mapped data from environmental
health records on the location of take-aways alongside our own data on the local shops
selling fresh meat and fish- there is poor access to fresh meat and fresh fish but there is an
[image:18.595.185.415.570.733.2]abundance of fast-food outlets located nearby.
Figures 5 highlights the presence of a large number of take-aways - this shows the number of
shops selling the raw ingredients as compared to the cooked, ready to eat food item. Here
you can buy prepared meat and fish (as fast-food) for prices below that for which the raw
items can be purchased, even if they were readily available.
Experiences of using local shops and markets
These macro issues of access do not address issues of (micro) access for those with
disabilities or other needs and is focused on how far people are from the shops not how far
the shops are from where people live. It should also be noted that this is a linear
measurement and does not necessarily take account of the actual routes people take to
shops, usually because of the safety of pedestrian routes .One mother with children said ‘I go
through the fields… footpath... walk with kids. I wouldn’t go at night.’ Some groups would
have to travel further than 500 metres to complete their shopping list and this could include
the necessity to travel outside the borough for some culturally preferred foods. This was also
reported in the focus groups.
Access was defined by our samples in wider terms than just physical distance to shops or the
availability of food in local shops. Focus group participants who used a free ‘community bus’
to get to a major supermarket complained of it not having storage space for buggies or bags
of shopping. In addition many complained of the lack of parking in shopping areas in the
borough, and reported going outside of the area to shop in edge of town stores in a
neighbouring borough, although this was only an option for those with access to cars.
Transport to shops as a pedestrian or bus user in accessing shops and shopping areas was
noted as problematic. Some, especially in the elderly groups, reported using a community bus
to get to a major supermarket but complained of having to wait for ‘an hour between buses’.
A complaint from mothers regarding both the major supermarket chains and the small
independent shops was the difficulty in getting into shops and aisles with a buggy. One mum
said ‘trolleys at supermarket are really unpractical because you’d have to put babies in a
trolley and then they‘d be no space for food. You need to be two people at least, I don’t know
how people do it’.
Focus group members reported the reasons for using the local major supermarket because of
it being ‘convenient to everyone, that’s why they use it’ and this combined with a lack of other
options meant that ‘most people shop there (at Tesco) because they don’t know where else to
go’.
Foodways: food culture and behaviour
We included this as culture is a key determinant of food behaviour and given the range of
to help inform the healthy food baskets and to highlight specifics eg African as an ethnic
group covers many geographies and ethnicities.
In our focus group interviews many individuals expressed a preference for specialist stores
(e.g. butcher, baker etc) closely grouped together. In our modelling process of shopping for
the various healthy food baskets it was necessary to visit a number of shops to complete the
different food baskets, this was based on the assumption that a shopper would go from shop
to shop seeking out their preferred items, although in practice this my not happen.
In the focus group with Turkish participants it was said that ‘we make …..salads out of wheat,
tomatoes parsley, olive tomato paste’. This developed into a discussion where it was said
‘traditional to eat main meal at night. The dinner is very important and everyone gets together.
It’s a family thing. Most of cooking is from fresh’ and later on that ‘we make our own natural
yoghurt.’ Both Black Caribbean, Black African and Turkish groups reported the difficulty in
finding fish that were familiar and all reported having to improvise and use what is available
(see figures 8 and 9 for confirmation of this lack of availability). There were trends in the
narrative of ethnic groups whose food habits are changing, one example was the
consumption of bread when a woman from a Turkish background reported ‘I don’t eat bread,
we have flat bread. My husband eats white. My son [eats] brown. Both Turkish and English.’
The availability of goods and convenience foods was a factor in changing diets and habits as
were the wider experiences of young people. Some traditional practices were under threat
because of time constraints. One woman from a Kurdish background told the story of how you
‘make own natural yoghurt. Fruit yoghurts [are] a new generation practice we did not know
them. The traditional breakfast of cheese, two to three types, olives, green and black,
tomatoes and cucumber with Pitta bread and sliced brown bread is going - breakfast cereals
eaten by children and others if no time for traditional breakfasts.’
DISCUSSION AND POLICY IMPLICATIONS
In policy terms a key issue remains not just to document the prevailing problems but to decide
on appropriate courses of action to address food inequality (McGlone, Dallison and Caraher,
2005).Our findings paint an intricate web of interactions ranging from shops and availability in
these shops to accessibility and affordability being key issues for some groups. We found that
generally ‘food deserts’ as commonly understood do not exist in the areas studied, in that
certain healthy food options from specific food groups were available, e.g. fruit and
vegetables, in geographical access terms. However access to these healthy food options with
respect to affordability paints a more complicated picture. Physical access also needs to be
balanced with the accounts from the focus groups where problems with physical access along
with ‘credit’ access were identified as barriers to accessing food in shops. We need to point
other wards in Hackney, and indeed the whole of the Hackney borough may paint a different
picture of food availability and access.
We found that some healthier foods options within food groups as defined using the ‘eatwell
plate’ are available, namely fresh fruit and vegetables, but other items such as fresh meat and
poultry and fresh fish, are not always available within the catchment areas. We also found
that healthier options such as lower fat versions of milk, high fibre pasta and rice were not
widely available. In addition for some groups, such as elderly people there was heavy reliance
on the bus to the local major supermarket since fresh cuts of meat and fish were not locally
available. Other groups such as Black African and Black Caribbean similarly found it difficult
to source their food needs in a local area. Fresh fruit and vegetables are an important part of
an overall healthy balanced diet but the other food groups of the ‘eatwell plate’ are of equal
nutritional importance. The other big picture to emerge is the importance and role of small
shops in delivering healthy and culturally appropriate food options to communities living in
these deprived areas. Aligned to this is how the choices that individual consumers make have
wide-ranging impacts on cost variations. In terms of offering appropriate cultural choices,
small shops offer a better range and more appropriate foods and services than the branches
of the major supermarket chains. National data, and data from London, shows that the
existence of small shops is fragile and many are shutting down. So local provision can
change from one week to the next with the closure of a small number of shops. This points to
the importance of monitoring the impact of shops and shop closures on healthy food
availability and health status.
It is important to represent the cultural preferences of groups in food choice. Cost is important
and is a prime determinant but culture and family food preferences also play a part.
Availability of fruit and vegetables was widespread in the study areas but there were problems
with availability and access to other healthy items such as fresh fish and low-fat and high fibre
items.
Our pricing survey for items in the core basket found that the complete basket of 33 items
was only available in three shops, these being major supermarket branches, both Tesco, one
a Tesco Metro and the other a Tesco supermarket, between which there was a price variation
of £5.16 (£35.05-£29.89). The other supermarket, a Somerfield, was the most expensive of
the three at £37.84. Another issue is that apart from the White British and Turkish food
baskets (when including bottled olives) the other two baskets, Black African and Black
Caribbean, could not complete their shopping in these three shops. Some of the local shops
were cheaper on some key food items, for example there were 17 shops that sold all fruit
items and there was a range from £4.79 to £9.39 in price. The major supermarkets were not
necessarily always the cheapest (£6.66 in the Tesco Metro, £6.59 for the Tesco supermarket
Tesco were the cheapest. However the most expensive was Somerfield, more expensive
even than the independent butcher. Thus showing that major supermarket branches as a
whole are not necessarily the cheapest option. Similarly the cheapest fresh fish was in an
independent fishmonger offering value for money and supporting the promotion of healthy
eating advice to eat more fish. For these reasons monitoring cost across small shops is
important. Using the comparator of welfare benefits and income and with the provisos
highlighted in the methodology which assumed cooking skills and facilities, children in receipt
of free school meals and a cupboard of basics such as condiments etc. as well our menu
assumed use of leftovers for subsequent meals, it was not extravagant. The amounts spent
on food in our three case studies represents a major proportion of household expenditure
from a low of 19% to 30% (see table 6).
Table 5 Black African food menu and shopping list
Black African seven day menu Shopping list
Breakfast
Maize Porridge or oat porridge Cornflakes and semi skimmed milk Egg and onion omelette at the weekend Glass orange juice
Lunch Okra soup
Green banana salad
Children have school lunches Sandwiches at weekend
Evening meal Ground nut stew
Goat stew e.g. oluwombo Green banana curry
Chicken and fried plantain, black eye beans, rice and cabbage
Grilled tilapia, cous cous and salad Chicken stew and boiled yam Fish Jellof and salad
Desert Fruit
Sweet potato pie
Supper Not usual
Snacks
Pieces of fruit from oranges, apples, grapes, bananas, satsuma
Gari porridge
Apples 250g Oranges 600g
Satsuma or similar 300g Grapes 150g
Bananas 700g Broccoli 500g Onion 1kg
Fresh tomatoes 1kg Cucumber 2 x whole Carrot 500g
Cabbage 500g Aubergine 600g Okra 600g
Sweet potatoes 1kg Plantain 1kg
Green bananas 700g Cassava root 1kg Yam 1kg
Unsweetened Orange juice 2 litres Tinned tomatoes 1 x 400g tin Cornflakes 250g pack Oats 500g
White Long grain rice 500g Cous cous 500g
Barley 500g
Cassava flour or gari 500g Maize flour 500g
Fresh chicken 1.5kg Fresh goat 300g Fresh cod 300g Fresh tilapia 300g Fresh eggs x 12 eggs Dried green lentils 500g Dried black eyed beans 500g Ground nuts 375g
At the time of the research a mother and two children entitled to income support and child
allowance (exclusive of housing costs) for the two children was entitled to £138.00 per week.
(£57.45 for the adult, £40-42 per child (Child Poverty Action Group, 2006). Table 5 shows the
food menu and shopping list for a Black African family and table 6 the percentages spent on
food to meet the requirements of our healthy baskets and menus. For all the groups this is
higher than the average 12-15% spent by the average English family on food for the home.
This compares to data from the Family Food Survey where households with children spent 24
per cent less than the UK average on food and drink eaten at home and averaged across the
UK at £23.56 per person per week on household food (ie not including food eaten outside the
[image:23.595.86.508.269.349.2]home) (National Statistics, 2006).
Table 6 Percentage of household expenditure on healthy food basket
Price range for healthy food
basket
Percentage of income
support
White British basket £27.02 up to £36.75 19.5% -26%
Turkish basket £34.45 up to £39.44 24.9%-28.5%
Black African £35.05 up to £40.77 25.39%-29.5%
As was noted in figure 4,there was a dominance of availability of ‘ready to eat’ foods through
fast food takeaways over the fresh, raw item. These often offered complete meal solutions at
prices below that of the raw product. The health problems relating to this choice of food are
the high fat, salt and sugar levels and the lack of individual control over ingredients. We also
suggest that this should become a focus for any group implementing school food policies in
Hackney, due to the impact this can have on the food choices children make including prices
and menus. Access to fresh meat, poultry and fresh fish was problematic in one of the
catchment areas for all ethnic groups. Reliance on take-away or processed sources is likely to
increase intake of foods high in fat, salt and/or sugar. The availability of take-aways and their
promotion of all-in-one meals for low prices means that some individuals are in danger of
excluding the vegetable portion of their meal.
The above findings needs to be set alongside policies which support shops in existing areas
of deprivation and not simply ‘bus’ people to areas where there are concentrations of food
shops, such as a free bus to a Tesco supermarket from some, but not all of the areas we
studied. Such an approach is suggested in the impact assessment of the draft Hackney
Transport Policy where it said that ‘accessible transport may reduce ‘food deserts’ and
increase access to healthy foods’. The current picture for many low-income Hackney
residents, living in areas of deprivation, is that local shops are important in accessing a
healthy diet. The encroachment of the major retailers into convenience retailing and its impact
on access to healthy foods in local areas needs to be monitored. To state the obvious, the
major multiple food retailers are responding to market forces and go where there are the best
market opportunities. Major stores are less likely to locate in areas with, amongst other
Older people who are less wealthy and rely on the state pension.
Council estates with high unemployment.
Council estate with greatest social hardship and crime and disorder.
These usually correspond with the areas of greatest deprivation and while major stores not
locating in these areas does not mean that the major multiples do not impact on local shops in
these areas, auditing needs to be on the basis of health impacts and inequalities. The existing
spread of shops in the ward areas and access to them could be seriously altered by the
closure of a small number, which could affect physical access for some of the estates and
create problems for some specific groups such as the elderly and those on benefits.
Regeneration teams involved in the development of areas should ensure that food shops and
their locations are addressed (Carley, Kirk and MacIntosh, 2001; Rampton, 20002). of these
estates. Regeneration of areas needs to be set within a wider framework of influences. Food
and other retail shops can contribute to social and economic regeneration of an area by
tackling anti-social behaviour, contributing to local jobs and ensuring that money flows are
enhanced in a local area. The absence of food shops are often the result or symptom of
wider social influences and not the cause of them.
Within the catchment areas studied there were many healthy options on sale in the small
independent shops however people’s abilities and resources to carry shopping home or the
safety of walking routes should also be considered. Access is not just about physical distance
to shops. Although this is a key factor, for many people weekly shopping is difficult if you have
to negotiate expensive taxis and inconvenient buses. If a family of four follows health
recommendations to eat five portions of fruit and vegetables a day, and makes a weekly
shopping trip, they will need to carry around two stones (12.7 kg) essentially in fruit and
vegetables, excluding potatoes. Lifting this from the trolley into the boot of a car is
uncomplicated. Carrying it to and from the bus stop is more demanding even for young and
physically fit shoppers. As was shown in the findings, accessing a healthy basket for some
communities can be problematic when having to shop at multiple shops to fulfil their needs.
Our findings suggest that those who do have a car simply go outside the borough to shop in
major supermarket chains where they can park, parking restrictions along high streets (red
routes) may thus may be encouraging shoppers who have access to a car to travel outside
the borough. Given that the majority of food shopping trips in Hackney are done by public
transport the quality of this experience should be improved.
At the micro level of access, whether this be in-shop access or accessing services such as
delivery or credit facilities, there are numerous issues. Dobson et al (1994) found that
low-income shoppers felt uncomfortable in supermarkets, where their limited budgets set them
apart from other shoppers. Part of the reason for this feeling is that without a credit or debit
card opportunities for shopping in a large supermarket can become a disheartening
Whilst it was heartening to see the variety and range of fruit on offer in the area, less
impressive were the issues of quality and costing policies. Food was important to those from
the ethnic minority groups we spoke to in three ways:
As part of foodways or traditions and familiarity;
As a means of cultural identification;
As a social bonding mechanism.
Many were suspicious of prepared food and expressed a preference for multiple and regular
shopping visits for fresh food. To achieve this they wanted a variety of shops to offer different
options. Indeed many of those we talked to expressed a preference for a mixed retail
environment where they could take advantage of local shops and use major supermarkets
branches as necessary. Some expressed a suspicion of ‘ethnic’ foods being sold by the major
chains as anglicised versions of traditional foods e.g. the bottled olives, made for the British
palate and not being culturally or ethnically appropriate foods. Similar fears were expressed of
processed and ready-to-eat meals, which were seen as undermining cultural identities
(National Consumer Council, 2005).
Health sector policy documents have highlighted the problems of retail access, but locate the
solutions in local food projects (social enterprises whether food co-ops or farmers markets),
because retail and regeneration strategies are outside their capacity and possibly their
understanding and skills base (McGlone et al, 1996; Dowler, 2000; Dowler and Caraher,
2003; Caraher and Cowburn, 2004). The current public health white paper and action plan for
food and health would seem to (re)endorse these approaches and already PCTs and others
are gearing up for such initiatives (Department of Health, 2005). The recent report from the
Food Standards Agency on the diets of low income group paints a picture that is far from
ideal, our findings in a local area add to this picture by outlining what it is like to live in a low
income area and the experience of shopping for culturally appropriate food (Nelson et al,
2007). In addition our findings caution against just using fruit and vegetables, as other studies
have done, as the sole means of measuring proxy access and availability to a healthy diet,
our results show that other items on the ‘eatwell plate’ need to be considered.
As noted above, at the time of the research a mother and two children in receipt of income
support and child allowance for two children was entitled to £138.00 per week. The
percentages spent on food to meet the requirements of our healthy baskets and menus show
that they would have to spend more than the national average -in both absolute and relative
terms- to eat healthily. This percentage appears equivalent to the findings from other research
such as that by Morris and colleagues and points to the fact that it is cheaper to eat
unhealthily (Morris et al 2000; Morris et al 2005). Our costings are a year old and predate the
rise in food prices that have occurred in the year and are expected to continue into 2008. The
total impact of world food prices are yet to be seen and not all consumers are equally
standards among high-income consumers by approximately 3 per cent, for low-income
consumers this reduction in an already poor diet could be as high as 20 per cent. For the
vulnerable and price dependant poor this will mean having to spend more on food and
possibly more on travel to access basics, a healthy diet will cost more.
From a policy perspective our findings suggest such approaches based on individual agency
should be balanced with upstream public health nutrition approaches in order to influence the
options available. The findings above have particular resonance for the area of Hackney as it
is one of the main areas in East London scheduled for development for the 2012 Olympics,
what becomes clear is that food and food access needs to be borne in mind as plans are set
up for the influx of visitors and competitors to the Olympics and that a lasting and improved
REFERENCES