A Multi-Criteria Performance Study of an Integrated Demand/Supply Energy System
for Low and Zero Carbon Technologies within Domestic Building Design
J. Clarke.
1, J. Hong
1, C.
Johnstone
1, J. Kim
1, P. Strachan
1, I. Hwang
2, and H. Lee
21
Energy System Research Unit, University of Strathclyde, Glasgow, Scotland, U.K.
2Fire & Engineering Services Research Department, Korea Institute of Construction
Technology, Korea
ABSTRACT
When low carbon and renewable energy (RE) systems are adopted in a building, matching the outputs from RE systems (e.g. photovoltaic, solar collectors, small scale wind turbines and heat pumps) to demand has to be taken into account to fully realise the potential of the hybrid energy system. Considering the varying demand profiles due to different building design options(e.g. orientation, construction types etc), it is necessary to evaluate key technology elements in an integrated context and establish appropriate strategies for simultaneously meeting heating and electricity loads as well as matching demand and supply.
This paper presents a new approach to evaluate the interactive effects of low carbon technologies and demand reduction measures in the early design stage of a new building. A case study of a sustainable domestic building project (PLUS 50), was implemented on the basis of the proposed design approach.
KEYWORDS
Hybrid energy system, performance, assessment, multi-storey domestic building
INTRODUCTION
To successfully integrate low-carbon and renewable energy (RE) systems within a building, appropriate technology types and capacities must be identified and integrated. In a previous study, a new approach to deal with the interactive effects of RE systems and buildings was suggested to support the early design stage (Kim et al, 2005). The study focused on the feasibility testing of building design options and RE systems including PV, solar collectors and heat pumps, and concentrated on the matching of outputs from RE systems to demand.
This paper presents a methodology for evaluating the energy performance of domestic buildings where the Hybrid Energy Systems (HES) has been installed . HESs are systems where demand side measures, RE and low carbon technologies such as µCHP are integrated. The methodology
allowsgbuilding designers to identify the effects of energy efficient demand-side measures (e.g. roof-top gardens, innovative under-floor heating systems) and maximise the utilisation of HESs. The methodology was tested in a case study of a sustainable domestic building project (PLUS 50),in Korea. The result of the case study is also presented here.
PERFORMANCE ASSESSMENT OF
HYBRID ENERGY SYSTEM
Integration of renewable and low carbon technology
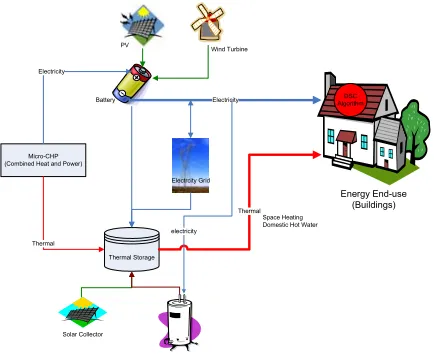
[image:1.595.314.531.565.742.2]In order to provide a reliable energy (electricity or thermal) supply, the energy supply from intermittent renewable sources must be supplemented by other energy supply systems (e.g. grids, boilers, thermal storage tanks, batteries, etc). When integrating RE systems and low carbon energy systems in a building as illustrated in Figure 1, it is necessary to design the HES that combines effective supply elements as well as an efficient operational strategy. Low Carbon Technology (LCT) systems such as µCHP and heat pumps, deal with electricity and heat simultaneously, so it is important to effectively match year-round heating and electricity loads to achieve a high level of efficiency.
Figure 1: Schematic diagram of an HES integrated in a building.
Micro-CHP (Combined Heat and Power)
Thermal Storage
Solar Collector Electricity
Electricity
Thermal
Thermal
Energy End-use (Buildings)
Space Heating Domestic Hot Water Electrcity Grid
Battery
PV Wind Turbine
DSC Algorithm
Therefore, it is necessary to evaluate key technology elements in an integrated context and establish appropriate strategies for simultaneously meeting heating and electricity loads as well as matching demand/supply. The design goals are:
• to minimise the importation of electricity from a grid;
• to reduce fuel consumption for heating/cooling and electricity;
• ultimately, to reduce CO2 emissions
against both thermal and electrical demand.
Criteria of performance assessment of HESs
The criteria of assessment and optimization of demand measures and supply systems in HESs installed in buildings depend on design strategies and targeting aspects. Born (2001) proposed the match assessment method mainly for RE systems and demand profiles. Two matching elements, magnitude and phase, are mainly used to judge how well time-series profiles match. This demand/supply matching assessment is based on the design strategy aimed at minimizing the exporting of electricity from RE systems to a grid and maximizing the potential of RE-generated supplies.
In the case of LCTs installed alongside RE systems, which are inherently intermittent and unpredictable energy supply sources, it is hard to tell which is the best by simply comparing match rates. The match rates for these systems are supposed to be high because demand-driven energy systems follow the demand profile. The partial load performance of demand-driven energy systems should be taken into account when evaluating systems that follow a certain demand profile over a period of time. Examining the hours spent running at different supply rates relative to demand can be regarded as an indicator of how well the system operates. Fuel consumption, equivalent GHG emissions and the overall efficiency over a given period are also significant in terms of appraising the operating performance of low carbon energy systems.
[image:2.595.316.551.86.244.2]If any modification is made to the thermal aspect of HESs, it could also affect the matching of electricity demand/supply as well. For example, when a new CHP system is adopted in an HES to meet thermal demand, the matching rate for electricity demand/supply must be changed if the electricity generated by the CHP system is used to meet electricity demand. Heat pump systems and thermal storage, also require electricity to generate a thermal supply for the HES. In order to examine the overall performance of an HES, the use of electrical and thermal energy) must be taken into account during the assessment process.
Figure 2: Multi-criteria assessment view of RE and LCT energy systems.
In this study, comprehensive criteira are used in the performance assessment of HESs in terms of overall energy use, cost, environmental impact (e.g. CO2 emission) as well as the demand/supply
matching rate. Figure 2 illustrates this multi-criteria assessment view for RE and LCT combined energy systems.
SOFTWARE TOOLS
Software framework
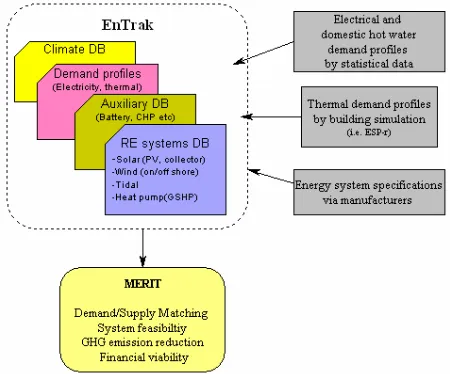
As shown in Figure 3, the software systems used in the study consisted of an integrated building energy simulation program, ESP-r (Clarke, 2001), a new and RE modelling and matching tool, Merit (Born et al, 2004), and an information management tool,
EnTrak (Kim, 2004).
Figure 3: Software tools.
[image:2.595.316.541.519.706.2]supply and demand in order to make informed decisions about the suitability of certain supply mixes for particular applications. EnTrak, an energy and environment information management tool, is used to store climate databases as well as demand and supply profiles for use with MERIT’s
profile matching feature. ESP-r is used to model the proposed design in order to generate virtual demand profiles corresponding to the building’s environmental control systems.
New functional development in Merit
As discussed previously, to maximize the overall performance of an HES, thermal and electrical demand and supply should be taken into account in the assessment process. To this end, the following new assessment tools and models have been created in MERIT:
• CHP operation model allowing the examination of different types of CHP engines, part load performance (of fuel consumption and heat-to-power ratio), the minimum load required to run the CHP, and the different types of fuel and their GHG emissions;
• The multi-criteria performance view presenting statistical information on total demand, total supply, import/export, matching rate, fuel consumption, CO2
emission, efficiency of CHP, partial load operation of CHP and cost;
• the dual match view mechanism and user interface for dual energy type models (e.g. CHP, heat pumps, thermal storage tanks) which include electrical and thermal aspects of simulation.
CASE STUDY: PLUS 50 BUILDING
Overview of the PLUS 50 project
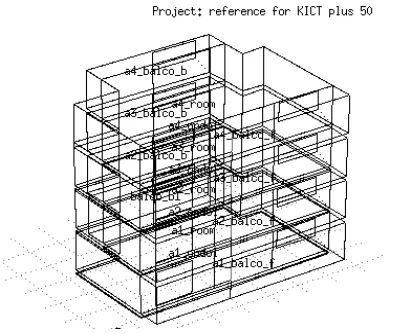
[image:3.595.320.541.72.214.2]The purpose of the PLUS 50 project is to develop technologies related to design, construction structure, materials and energy systems for residential buildings which can prolong a building’s life by up to 50% and reduce the environmental impact by up to 50%. A number of individual technologies are involved, including energy efficient demand measures (e.g. roof-top gardens, panel under-floor heating systems, external insulation) and HESs consisting of low carbon and RE systems as illustrated in Figure 4.
Figure 4: the Plus 50 building model.
Thermal and electrical demand profiles
The PLUS 50 building model comprises of 16 households with 4 apartments on each of the 4 storeys. The thermal model of the PLUS 50 building was generated by ESP-r including the Ondol (under-floor) heating system and roof-top garden. First, a model of a single column comprising of four aparments was created, and then by changing the boundary conditions, the demand profile of the entire building was simulated. Two variations of the thermal model were created: a reference building (i.e. conventional pipe-embedded concrete Ondol and flat roof) and the PLUS 50 building (i.e. panel-type Ondol, roof-top garden, reinforced external insulation).
The conventional roof has a U-value of 0.46 W/m2K. The roof-top garden has 120 mm soil
coverage over insulation and concrete, with an improved U-value of 0.35 W/m2K. The main façade
of the model is assumed to face South for all cases. The hourly climate data of Seoul (37.34˚N, 126.58˚E) was used. The simulation focused on the heating season (Jan-Mar) only.
[image:3.595.314.516.551.718.2]DHW and electricity demand profiles
The demand profile for domestic hot water was based on typical Korean domestic hot water profiles. It is assumed that individual households have the same profiles regardless of the apartments’ position and orientation. Therefore, the total demand profile was obtained by multiplying the typical DHW (W/m2) against the total area of the apartment
building. Electricity demand profiles were based on a survey conducted by the Korea Power Exchange (2004) in which typical daily use patterns of home appliances were identified through seasons by monitoring the electricity usage of 500 households. The typical electricity usage pattern was adjusted for the PLUS 50 building (i.e. 16 households) and extended to cover annual profiles using MERIT’s
profile designer.
RE and LCT technologies
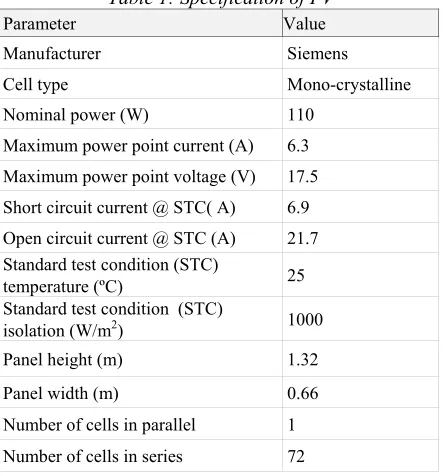
Ground source heat pumps, solar collectors and photovoltaic modules were adopted for the heating and electricity energy supply system. The capacity and COP of the heat pump system are 10 kW and 3.8 respectively for heating. Assuming that the heat pump is operated in an on/off mode, the supply from the system is essentially constant as ground temperature at a depth of 70-100m is steady at around 13ºC in winter and 15ºC in summer according to a year-round field measurement made by the Korea Institute of Construction Technology. Based on the feasibility test of solar-power RE conducted in a previous study (Kim et al, 2005), a 110-watt mono-crystalline photovoltaic module and solar collector were installed on top of the roof. The two types of RE systems are tested in terms of integrated energy performance with other LCTs within the HES. The specifications of the RE systems are given in Table 1 and Table 2.
Table 1: Specification of PV
Parameter Value
Manufacturer Siemens
Cell type Mono-crystalline
Nominal power (W) 110
Maximum power point current (A) 6.3
Maximum power point voltage (V) 17.5
Short circuit current @ STC( A) 6.9
Open circuit current @ STC (A) 21.7
Standard test condition (STC)
temperature (ºC) 25
Standard test condition (STC)
isolation (W/m2) 1000
Panel height (m) 1.32
Panel width (m) 0.66
Number of cells in parallel 1
Number of cells in series 72
For the CHP, a 30 kWe µCHP was selected for the PLUS 50 building instead a 50 kWe supply to meet demand (Kim et al, 2006). The specification of the µCHP is shown in Table 3 (Energy Nexus Group, 2002).
Table 2: Specification of Solar Collector.
Parameter Value
Collector length (m) 2.49
Collector width (m) 1.323
Collector depth (m) 0.095
Plate thickness (m) 0.0005
Plate length (m) 1.17
Plate longwave emittance 0.95
Plate solar absorbance 0.95
Plate conductivity (W/mK) 380
Number of tubes 11
[image:4.595.66.289.522.760.2]Spacing between tubes 0.0114
Table 3: Specification of µCHP
Parameter Value
Fuel Type Natural Gas
LHV (MJ/m3) 34.6
Nominal Power (kW) 30
Engine Type Micro-turbine
0.08 0.13
0.13 0.22
0.17 0.29 Fuel
Consumption (m3/min)
0.22 0.37
Turbine Efficiency (%) 92
Power Factor 0.98
Generator Efficiency (%) 92
Electricity Frequency (Hz) 50/60
4.74 4.44
3.02 2.83
2.49 2.33
Heat-to-Power Ratio
2.13 1.99
HES Scenarios
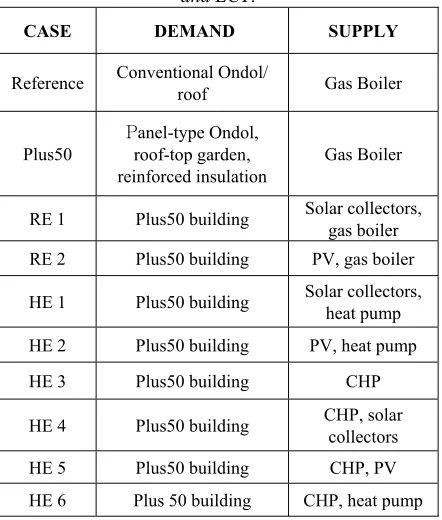
The ‘PLUS 50’ building model was used for all of the other scenarios with RE and LCT supply systems.
‘RE 1’ and ‘RE 2’ are examples of RE systems with gas boilers based on the ‘PLUS 50’ building. The solar collectors (84 panels) for ‘RE 1’ or photovoltaic panels (229 panels) for ‘RE 2’ are installed on the roof (256m2 coverage).
[image:5.595.314.531.92.246.2]The CHP follows thermal demand- for all cases. No thermal storage was considered in this study. DHW and electricity demand profiles apply to all cases. It is assumed that the electricity from the grid is imported when the RE and LCT systems cannot meet the electricity demand.
Table 4: Scenarios involving combinations of RE and LCT.
CASE DEMAND SUPPLY
Reference Conventional Ondol/ roof Gas Boiler
Plus50
Panel-type Ondol,
roof-top garden, reinforced insulation
Gas Boiler
RE 1 Plus50 building Solar collectors, gas boiler
RE 2 Plus50 building PV, gas boiler
HE 1 Plus50 building Solar collectors,
heat pump
HE 2 Plus50 building PV, heat pump
HE 3 Plus50 building CHP
HE 4 Plus50 building CHP, solar collectors
HE 5 Plus50 building CHP, PV
HE 6 Plus 50 building CHP, heat pump
Results analysis
The thermal effect of the PLUS 50 building gives rise to a 12-28% demand reduction against the reference building depending on the orientation of external walls (see Table 5). As the thermal improvement effect of the roof-top garden/reinforced insulation walls is restricted to an envelope (i.e. roof, external wall), , the reduction rate is subject to the postion of the apartment (e.g. the worst performing apartment has a reduction rate of 2.4 %). This implies that as the proportion of apartments located in the middle of a PLUS 50-like building increases (those not on the top floor or at each side of the building), the thermal effect due to demand-side measures becomes less significant, although it can still reduce the peak demand.
Table 5: Thermal demand (kWh) of the PLUS 50 building against the reference building.
Reference Plus50
West Mid East West Mid East Top 5.30 4.04 5.14 3.92 3.23 3.79
2nd 2.60 1.15 2.02 1.70 1.10 1.59 1st 2.30 1.23 2.19 1.79 1.2 1.68 Ground 5.38 3.55 4.35 3.79 3.22 3.83
Total 15.58 9.97 13.7 11.20 8.77 10.8 9 Rate %
* - - - 28 12 20
*Thermal demand reduction of Plus 50 building against reference building
Table 7 displays the results of the performance assessment for the heating season (January to March). Energy usage and CO2 reduction rates
against the reference case are presented in Table 6.
Table 6: Energy usage and CO2 reduction rates
against the ‘reference’ case. CASE ENERGY
USAGE REDUCTION
RATES (%)*
CO2 REDUCTION
RATES (%)
Reference 0 0
Plus50 6.08 4.23
RE 1 12.94 9.01
RE 2 14.58 14.56
HE 1 25.93 13.63
HE 2 32.20 23.49
HE 3 24.10 25.13
HE 4 28.84 33.84
HE 5 43.42 33.59
HE 6 33.76 29.38
*Energy usage from GHG emission energy systems (i.e. Grid, CHP, boiler)
The electricity generated by RE 2 (PV-installed roof) contributes to the reduction of electricity imported from the grid, while RE 1 (solar collector-installed roof) contributes to the reduction of energy from the gas boiler. However, in terms of CO2 reduction, RE 2 makes more of a contribution.
This is because th e natural gas boiler has a better a CO2 emission factor than the national grid CO2
emission rate. In terms of the matching rate and residual, RE 1 generates a surplus supply. Especially during the warmer season, this surplus increases and the matching rate decreases. Figure 6 and Figure 7 displays surplus/deficit profile of thermal energy supply from solar collectors and PVs. Although the overall CO2 reduction
[image:5.595.66.287.305.565.2]was adopted (e.g. an oil boiler), PV is preferable to solar collectors in terms of the way it can fully utilise the energy generated with a resulting reduced environmental impact.
A fuel consumption reduction rate of 18-39% can be achieved when adopting an HES. In terms of energy use reduction, HE 5 is the best.
By using the electricity produced by the CHP and PVs and the heat produced by the CHP and solar collectors, HE 5 and HE 4 make the greatest contribution to CO2 reduction. However, there are
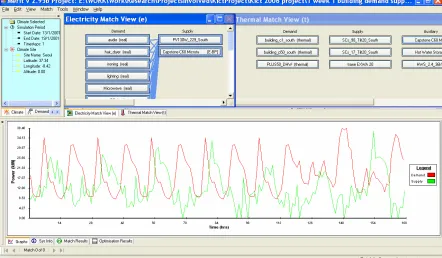
still some distance from the target (50%), as the deliverable energy of these two scenarios is limited. Figure 8 shows the match view of the electricity produced by the CHP according to demand in HE 5 scenario.
If a heat pump is adopted, the extra consumption of electricity for the heat pump system is taken into account. While a heat pump can be used for the base load, a CHP system follows residual demand. HE 6 is also a reasonable energy system choice. It can improve the efficiency of a CHP. However, the durability of CHPs should be considered as well. In order to achieve the target of the PLUS 50 project (50% reduced energy use and CO2
emission), it is important to install an HES which can overcome the limitations of demand-side measures. To reduce overall energy consumption and CO2 emission by over 50%, advanced
demand-side measures such as active demand-demand-side control (DSC) systems and the export of surplus energy generated by RE or CHP or others could be considered. The DSC is used to control devices to match the individual demand/supply profile. It coordinates with available supply resources to create more favourable demand profiles for intermittent and unpredictable energy supply resources. To further reduce the CO2 emission, the contribution of energy export should be also taken into account.
CONCLUSION
An approach to the evaluation of RE and LCT integrated energy systems was established, including consideration of heat and power demand profiles, energy system combinations, building design options and strategies for matching supply to demand. A case study was conducted with the Korean PLUS 50 eco-friendly domestic building project. A series of demand/supply matching-based analyses and performance evaluations of the PLUS 50 building and HESs were undertaken on the basis of the proposed approach. The effect of energy efficient demand measures and favourable combination of HESs were identified in terms of total energy usage and CO2 emission reduction.
On the basis of the performance information obtained at the conceptual design stage, the design
team can pinpoint energy efficient demand/supply combinations, and therefore maximise the impact of the adoption of HESs. The assessment methodology can also be applied to RE and LCT community energy plans.
REFERENCES
Born F, Clarke J and Johnstone C, 2004, Development of a Simulation-Based Decision Support Tool for Renewable Energy Integration and Demand-Supply Matching,
Proc. eSim 2004, pp205-12, Vancouver. Born F, Clarke J, Johnstone C, Kelly N, Burt G,
Dysko A, McDonald J and Hunter I, 2001. On the integration of renewable energy systems within the built environment, Building Services Engineering Research and Technology, V22, N1, pp3-13.
Clarke J, 2001, Energy Simulation in Building Design (2nd Edn), Butterworth-Heinneman,
London.
EPA (U.S. Environmental Protection Agency), 2003, Environmental Technology Verification Report: Combined Heat and Power at a Commercial Supermarket-Capstone 60 kW Microturbine CHP System, SRI/USEPA-GHG-VR-27, available from www.microturbine.com
Energy Nexus Group, 2002, Technology Characterization Micro Turbines, http://www.eere.energy.gov/buildings/
building_america/pdfs/db/37804.pdf
Kim J, 2004, Integrated Information System Supporting Energy Action Planning via the Internet, PhD Thesis, University of Strathclyde.
Kim J, Clarke J, Hong J, Strachan P, Hwang I and H. Lee, 2005, Simulation-based Design Procedure to Evaluate Hybrid-Renewable Energy Systems for Residential Buildings in Korea, Proc. Building Simulation '05, Montreal, 15-18 August, 2005.
Kim J., Clarke J., Strachan P., Hong J., I.Hwang, H. Lee, 2006, A Strategic Study of Energy Efficient and Hybrid Energy System Options for a Multi-family building in Korea, EUROSUN 2006 conference.
Korea Power Exchange, 2004, Survey on Electricity Consumption Characteristics of Home Appliance, http://www.kpx.or.kr/
Table 7: Comparison of the performance index of cases.
CO2 Emission 1)
(ton) Scenario
Demand [MWh]
Electricity / Thermal
RE total generation [MWh]
Electricity /Thermal
RE Energy Surplus [MWh]
Electricity /Thermal
RE Energy Deficit [MWh]
Electricity /Thermal
RE Energy Delivered [MWh]
Electrical /Thermal
Match Rate [%]
Electricity /Thermal
Efficiency (CHP) [%]
Aux Supply [MWh]
Electricity /Thermal
Grid Import4)
[MWh]
Energy usage 5)
(MWh)
Electricity / Thermal
(Total)
Reference 41.0 / 59.8 -/- - - - - -/68.772) 41.0 109.77 19.8 / 15.3 35.1
Plus50 41.0 / 54.0 -/- - - - - -/62.12) 41.0 103.10 19.8 / 13.9 33.7
RE 1 41.0 / 54.0 -/13.97 -/7.11 -/47.04 -/6.55 -/31.60 - -/54.562) 41.0 95.57 19.8 / 12.2 32
RE 2 41.0 / 54.0 9.33 /- 1.73/- 33.35/- 7.51/- 32.7/- - -/62.102) 33.49 93.77 16.2/ 13.9 30.1
HE 1 47.0 / 54.0 - / 36.9 -/12.11 - /28.94 -/24.20 -/50.2 - -/19.672) 47.0 81.31 22.7 / 7.6 30.3
HE 2 47.0 / 54.0 9.3/ 22.9 0.95 /0.73 38.61 /31.45 8.32/22.04 31.2 / 46.1 - -/36.752) 38.68 74.42 18.7 / 8.2 26.9
HE 3 41.0 / 54.0 - 0.37/- 29.29/- 11.19/52.98 42.1 /95.7 55.7 11.93) / 53.0 29.81 83.31 14.4 / 11.9 26.3
HE 4 41.0 / 54. 0 -/14.0 0.34/7.33 30.60 /0.96 9.89/52.99 39.9 / 82.5 58.2 10.53) / 46.5 31.11 78.11 15.0 / 8.2 23.2
HE 5 41.0 / 54.0 21.2/- 3.46/- 23.07/- 17.34/52.98 52.8 /95.7 55.7 11.93) / 53.0 23.66 62.11 11.4 / 11.9 23.3
HE 6 47.0 / 54.0 -/22.9 0.058 (CHP) / 0.79 (HP)
40.45 (CHP)
/1.26 (HP) 6.38/52.68 22.6 /96.1 38.7 6.5
3) / 30.6 40.62 72.71 19.6 / 5.2 24.8
1) CO2 emission factor: 223 kg CO2/MWh for natural gas boilers (based on gross calorific value) and 483.6 kg CO2 /MWh for electricity from the grid (national average in Korea) .
2) Gas Boiler efficiency 85 %.
3) Electricity generated by the CHP when running on thermal-follow mode. 4) Grid Import = demand – energy delivered
Figure 6: Surplus/deficit of thermal energy supply from solar collector during a year.
[image:8.595.71.513.500.758.2]Figure 7: Surplus/deficit of electrical energy supply from PV during a year.