environmental correlates of active travel and physical activity in a deprived urban population.
International Journal of Behavioral Nutrition and Physical Activity, 5 (1). p. 43.
ISSN 1479-5868
http://strathprints.strath.ac.uk/13389/
This is an author produced version of a paper published in International Journal of Behavioral
Nutrition and Physical Activity, 5 (1). p. 43. ISSN 1479-5868. This version has been peer-reviewed
but does not include the final publisher proof corrections, published layout or pagination.
Strathprints is designed to allow users to access the research output of the University
of Strathclyde. Copyright © and Moral Rights for the papers on this site are retained
by the individual authors and/or other copyright owners. You may not engage in
further distribution of the material for any profitmaking activities or any commercial
gain. You may freely distribute both the url (
http://strathprints.strath.ac.uk
) and the
content of this paper for research or study, educational, or not-for-profit purposes
without prior permission or charge. You may freely distribute the url
(
http://strathprints.strath.ac.uk
) of the Strathprints website.
Open Access
Research
Personal and environmental correlates of active travel and physical
activity in a deprived urban population
David Ogilvie*
1,6, Richard Mitchell
2, Nanette Mutrie
3, Mark Petticrew
4and
Stephen Platt
5Address: 1Medical Research Council Social and Public Health Sciences Unit, Glasgow, UK, 2Section of Public Health and Health Policy, University
of Glasgow, Glasgow, UK, 3Department of Sport, Culture and the Arts, University of Strathclyde, Glasgow, UK, 4London School of Hygiene and
Tropical Medicine, London, UK, 5Research Unit in Health, Behaviour and Change, University of Edinburgh, Edinburgh, UK and 6Medical Research
Council Epidemiology Unit, Cambridge, UK
Email: David Ogilvie* - dbo23@medschl.cam.ac.uk; Richard Mitchell - r.mitchell@clinmed.gla.ac.uk;
Nanette Mutrie - nanette.mutrie@strath.ac.uk; Mark Petticrew - mark.petticrew@lshtm.ac.uk; Stephen Platt - steve.platt@ed.ac.uk * Corresponding author
Abstract
Background: Environmental characteristics may be associated with patterns of physical activity in general or with particular types of physical activity such as active travel (walking or cycling for transport). However, most studies in this field have been conducted in North America and Australia, and hypotheses about putative correlates should be tested in a wider range of sociospatial contexts. We therefore examined the contribution of putative personal and environmental correlates of active travel and overall physical activity in deprived urban neighbourhoods in Glasgow, Scotland as part of the baseline for a longitudinal study of the effects of opening a new urban motorway (freeway).
Methods: We conducted a postal survey of a random sample of residents (n = 1322), collecting data on socioeconomic status, perceptions of the local environment, travel behaviour, physical activity and general health and wellbeing using a new 14-item neighbourhood rating scale, a travel diary, the short form of the International Physical Activity Questionnaire (IPAQ) and the SF-8. We analysed the correlates of active travel and overall physical activity using multivariate logistic regression, first building models using personal (individual and household) explanatory variables and then adding environmental variables.
Results: Active travel was associated with being younger, living in owner-occupied accommodation, not having to travel a long distance to work and not having access to a car, whereas overall physical activity was associated with living in social rented accommodation and not being overweight. After adjusting for personal characteristics, neither perceptions of the local environment nor the objective proximity of respondents' homes to motorway or major road infrastructure explained much of the variance in active travel or overall physical activity, although we did identify a significant positive association between active travel and perceived proximity to shops.
Conclusion: Apart from access to local amenities, environmental characteristics may have limited influence on active travel in deprived urban populations characterised by a low level of car ownership, in which people may have less capacity for making discretionary travel choices than the populations studied in most published research on the environmental correlates of physical activity.
Published: 27 August 2008
International Journal of Behavioral Nutrition and Physical Activity 2008, 5:43 doi:10.1186/1479-5868-5-43
Received: 20 February 2008 Accepted: 27 August 2008
This article is available from: http://www.ijbnpa.org/content/5/1/43 © 2008 Ogilvie et al; licensee BioMed Central Ltd.
Background
Until recently, research on correlates of physical activity was dominated by studies of individual demographic and psychosocial characteristics [1]. This reflected an empha-sis on promoting sport, recreation or health-directed exer-cise using techniques to encourage individual behaviour change [2]. However, there is little evidence that such approaches are effective in increasing physical activity in the medium-to-long term [3]. If habitual patterns of behaviour are environmentally cued, sustained change is likely to require a supportive environment in which peo-ple can be active [4,5]. There is therefore increasing inter-est in the influence of the social and physical environment on physical activity.
With respect to the physical (natural or built) environ-ment, a growing body of evidence suggests that certain environmental characteristics may be associated with pat-terns of physical activity in general or with particular types of physical activity such as walking or cycling as modes of transport [4-10]. Among the correlates most frequently identified in such reviews – some ascertained using 'objec-tive' measures, and others in terms of people's perceptions – are the aesthetic quality of the surroundings, the pres-ence of pavements (sidewalks), the convenipres-ence of facili-ties for being active, the availability of green space, access to amenities (destinations) within walking or cycling dis-tance, safety from traffic and personal attack, and the lack of heavy traffic. Some of these local characteristics reflect higher-order aspects of urban design and spatial policy such as population density, connectivity and mixed land use [6,8]. Importantly, different characteristics may be associated with different types of physical activity; for example, Owen and colleagues found that the aesthetic quality of the surroundings was associated with walking for exercise or recreation and with walking in general, but not with walking for transport, whereas perceptions of traffic were associated with walking for transport and walking in general, but not with walking for exercise or recreation [5].
Despite the growing volume of published studies in this field, many authors remain circumspect in their interpre-tation of the available evidence. Giles-Corti and Donovan have described access to a supportive physical environ-ment as a necessary, but insufficient, condition for an increase in physical activity in the population [11], while Handy found 'convincing' evidence of an association between physical activity and the built environment in general but 'less convincing' evidence as to which specific environmental characteristics were most strongly associ-ated [7]. One limitation of the available evidence is that most research has been conducted in North America and Australia [9,12], and it is not clear whether associations observed in those countries are generalisable to other
set-tings with different aggregate socioeconomic characteris-tics (e.g. wealth or access to private cars) or environmental characteristics (e.g. climate, patterns of land use, or avail-ability of public transport). For example, North American researchers are often interested in the presence or absence of pavements (sidewalks), but it is unusual for streets in the United Kingdom (UK) not to have a pavement or foot-path beside them. Hypotheses about putative environ-mental correlates of physical activity therefore need to be tested in a wider range of settings.
A more profound limitation of the available evidence is that identifying a relationship between, for example, urban form and walking for transport is not the same thing as showing that changing the built environment will lead to a change in behaviour [13]. Few researchers have taken up the opportunity (or challenge) presented by 'nat-ural experiments' to investigate the effects of environmen-tal interventions on physical activity [14]. We therefore established a longitudinal study to examine changes asso-ciated with the opening of a new urban section of the M74 motorway (freeway) currently under construction in Glas-gow, Scotland. The rationale and design for this study have been described previously [15]. It is claimed that the new motorway, which will mostly pass through or close to densely-populated urban neighbourhoods, will contrib-ute to the regeneration of a region which includes some of the most deprived and least healthy working-class com-munities in Europe [16]. It is also claimed that the new motorway will divert traffic from local streets, reduce traf-fic noise and bring new local employment opportunities, thereby improving characteristics of the local environ-ment held to be associated with active travel. Others claim that the new motorway will encourage car use, degrade the aesthetic quality of the surroundings and reduce the safety and attractiveness of routes for pedestrians and cyclists across the line of the motorway – all changes which may be expected to discourage active travel [15]. The eventual aim of the M74 study will be to assess the effects of this major modification to the urban built envi-ronment and transport infrastructure on perceptions of the local environment and on population health and health-related behaviour, the primary outcome of interest being a change in the quantity of 'active travel' (walking and cycling for transport).
environment in which people live and by their objec-tively-assessed proximity to motorway and major road infrastructure.
Methods
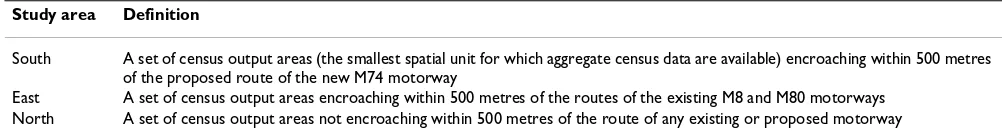
Delineation of study areas
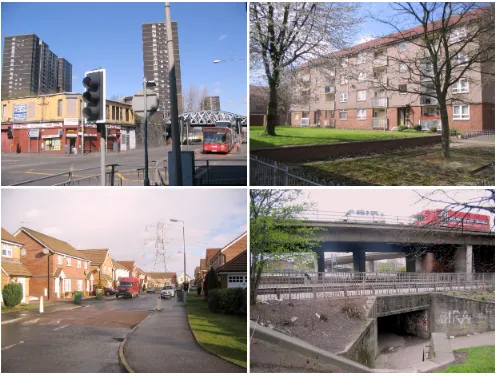
We used spatially referenced census and transport infra-structure data held and analysed in a geographical infor-mation system (GIS), combined with field visits, to delineate three study areas in Glasgow with similar aggre-gate socioeconomic characteristics and broadly similar topographical characteristics apart from their proximity to urban motorway infrastructure (Table 1, Figure 1). All three study areas extended from inner mixed-use districts close to the city centre to residential suburbs, contained major arterial roads other than motorways, and contained a mixture of housing stock including traditional high-den-sity tenements, high-rise flats and new housing develop-ments (Figure 2).
Sampling and survey administration
We used the Royal Mail Postcode Address File (PAF) (ver-sion 2005.3) to identify all residential addresses whose unit postcode (zip code) was within one of the study areas (total n = 35601) and drew a random sample of 3000 households from each area. Unit postcodes (e.g. G12 8RZ) are the smallest available unit of postal geography in the UK; residential unit postcodes cover about 15 addresses on average. We sent the survey to all households (total n = 9000) between 28 September and 4 October 2005 and resent the survey to all non-responding house-holds between 26 and 31 October 2005. We alerted households to the survey by means of a postcard sent a few days in advance, used coloured paper for some of the survey materials, and posted survey packs in white enve-lopes printed with the university crest; these techniques have been shown in a meta-analysis to be associated with increased response rates to postal surveys [17]. We asked householders to ensure that the questionnaire was com-pleted by a resident aged 16 or over; if more than one res-ident was eligible, we asked householders to select the person with the most recent birthday. Respondents who consented to follow-up were entered into a prize draw to win a £50 ( 63; US$92) gift voucher. Responses received more than three months after the first mailing wave were disregarded in analysis.
Data collection
The questionnaire included items on demographic and socioeconomic characteristics, health and wellbeing (including the the SF-8 scale), perceptions of the local environment, travel behaviour and the short form of the International Physical Activity Questionnaire (IPAQ) (Additional file 1). We developed a new 'neighbourhood scale' to assess perceptions of relevant characteristics of the local environment (aesthetics, green space, access to amenities, convenience of routes, traffic, road safety and personal safety). The development, principal components analysis and reliability of the items in this scale and the derivation and reliability of summary variables are reported in an accompanying paper [18].
Data cleaning and derivation of variables
Demographic and socioeconomic characteristics
We excluded from analysis all respondents who failed to enter their age or sex. We then examined the distributions of all raw variables and carried out range and consistency checks to identify any anomalous values or variables with a high proportion of missing responses. As a consequence, we collapsed responses on distance to place of work or study, housing tenure, car access and working situation into fewer categories by merging categories with small numbers of responses; we also disregarded household composition and working situation of spouse or partner in analysis because of the large numbers of missing values for these variables.
Health and wellbeing
We calculated body mass index (BMI) by converting, where necessary, self-reported heights and weights from imperial to metric units and dividing the height in metres by the square of the weight in kilograms; we also catego-rised respondents into quintiles of BMI. We calculated physical (PCS-8) and mental (MCS-8) health summary scores from the SF-8 data and scaled these to population norms using the method and coefficients given in the SF-8 manual [19].
Objective environmental characteristics
[image:4.612.52.553.659.727.2]We linked each record to the unit postcode of residence. We then constructed concentric buffers at 100-metre intervals up to 500 metres around the routes and access points of existing and planned motorways and around the
Table 1: Definitions of study areas
Study area Definition
South A set of census output areas (the smallest spatial unit for which aggregate census data are available) encroaching within 500 metres of the proposed route of the new M74 motorway
network of other major (A- and B- class) roads, and assigned each respondent to a category of proximity to each type of road infrastructure (within 100 metres, 101– 200 metres, etc.) based on the location of the centroid of their unit postcode.
Travel behaviour
For travel time analysis we included travel diaries which recorded no travel at all, but we disregarded travel data from respondents who had not been at home on the day of the travel diary, whose questionnaire had been mis-printed such that the travel diary pages were unusable, who had recorded journeys without reporting valid quan-titative data on the durations of those journeys, or whose completed travel diary appeared implausible. We also dis-regarded journeys whose purpose was not stated or was beyond the scope of the travel diary (Additional file 1,
page 8). We summed the reported travel time for each mode of transport, calculated a total travel time by active modes (walking plus cycling) and by all modes com-bined, and calculated the proportion of total travel time contributed by each mode of transport.
Physical activity
We cleaned and analysed IPAQ data in accordance with the IPAQ scoring protocol http://www.ipaq.ki.se. We therefore disregarded physical activity data from respond-ents who had reported more than 16 hours of physical activity per day or who had missing or internally incon-sistent data on the frequency or duration of any of the three categories of physical activity (walking, moderate-intensity activity or vigorous activity). We also recoded reported durations of activity of less than ten minutes to zero, and of greater than 180 minutes to 180 minutes. We
Boundaries of local study areas defined in terms of census output areas Figure 1
Boundaries of local study areas defined in terms of census output areas. Data and raster image © Crown Copyright/
calculated the estimated total physical activity energy expenditure for each respondent (MET-min/week) and used a combination of frequency, duration and total energy expenditure to assign each respondent to a 'high', 'moderate' or 'low' category of overall physical activity in accordance with the prescribed IPAQ algorithm. The 'high' category corresponds to a sufficient level of physical activity to meet current public health recommendations for adults [20].
Analysis
We considered it unlikely that the statistical assumptions required for linear regression could be met because the distributions of time spent walking and cycling and of estimated total physical activity energy expenditure were both strongly positively skewed and dominated by a large number of zero values which meant that the data were not
amenable to log-transformation. We therefore modelled the correlates of active travel and physical activity using multivariate logistic regression. We defined 'active travel' as a binary condition achieved by any respondent who had reported at least 30 minutes of travel by walking, cycling or both in their travel diary, reflecting the current recommendation that adults should accumulate at least 30 minutes of moderate-intensity physical activity on most days of the week [20], and we defined 'physical activity' as a binary condition achieved by any respondent whose overall physical activity was categorised as 'high' using IPAQ. We then built separate multivariate models for active travel and physical activity following the method of Hosmer and Lemeshow [21], first including only 'personal' (individual or household) variables and then adding 'environmental' variables (Additional file 2).
[image:6.612.56.553.88.465.2]Examples of scenes in and around the local study areas Figure 2
Results
ResponseWe received 1345 completed questionnaires. After sub-tracting from the numerator 23 completed questionnaires with missing critical demographic data (age or sex), and after subtracting from the denominator 676 addresses from which survey packs were returned as undeliverable, this left 1322 valid responses to be entered into analysis – a response rate of 1322/(9000-676) = 15.9%.
Characteristics of study participants
Demographic and socioeconomic characteristics
Respondents were aged between 16 and 89 years (median age 48 years). 804 (61%) were women. Only 136 (26%) of the men and 145 (18%) of the women reported having access to a bicycle. For those who usually travelled to a place of work or study, the median reported distance was 3.5 miles (about 5.5 kilometres). Other characteristics of study participants are summarised in Table 2.
Health and wellbeing
25% of respondents reported difficulty walking for a quar-ter of a mile, 39% reported a long-quar-term health problem or disability, and 50% were overweight (median BMI 25.1
kg/m2). The median mental health summary score
(MCS-8) was significantly lower (i.e. poorer) than the popula-tion norm (median 47.3, 95% CI 46.4 to 48.1); the median physical health summary score (PCS-8) was not
significantly different from the population norm (median 50.9, 95% CI 49.6 to 51.7).
Descriptive data on travel behaviour and physical activity
Travel behaviour
1099 travel diaries were suitable for travel time analysis. Men and women were equally likely to have returned usa-ble travel time data, but respondents who were older, retired, or living in social rented accommodation or who did not have access to a car were less likely to have returned usable data. On average, respondents recorded about an hour's travel per day (mean 61.5 minutes, median 50.0 minutes), of which a minority was spent using active modes of transport (walking or cycling: mean 20.0 minutes, median 10.0 minutes) (Table 3). 304 respondents (28%) recorded at least 30 minutes of active travel, of whom 294 (97%) recorded at least 30 minutes of walking.
Physical activity
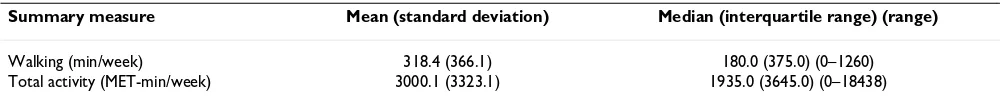
833 respondents returned complete physical activity data suitable for analysis. Women and respondents who were older, retired, or living in social rented accommodation or who did not have access to a car were less likely to have returned usable data. Respondents reported a mean of 318 minutes' walking per week and a mean estimated total physical activity energy expenditure of 3000 MET-minutes per week (Table 4). Only 316 respondents (38%) were categorised as having achieved a 'high' (i.e. suffi-cient) level of physical activity.
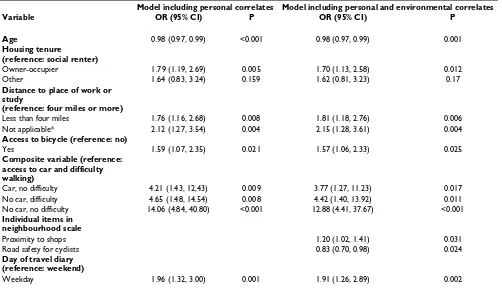
Correlates of active travel
Active travel was significantly associated with being younger, living in owner-occupied accommodation, not having to travel more than four miles to work, having access to a bicycle, not having access to a car, and the absence of any difficulty walking. The final best model of the 'personal' correlates of active travel provided
satisfac-tory goodness-of-fit (Hosmer and Lemeshow test: χ2 =
13.04, df = 8; P = 0.11) and explained nearly one-fifth of
the total variance in active travel (Nagelkerke's R2 =
18.7%) (Table 5). Adding 'environmental' variables to the model showed an additional significant positive associa-tion between active travel and perceived proximity to shops, and an additional significant negative association between active travel and perceived road safety for cyclists. The final best model of the personal and environmental correlates of active travel also provided satisfactory good-ness-of-fit (Hosmer and Lemeshow test: χ2 = 10.61, df = 8;
P = 0.23) and explained slightly more of the total variance in active travel than did the personal model alone (Nagelkerke's R2 = 20.1%) (Figure 3).
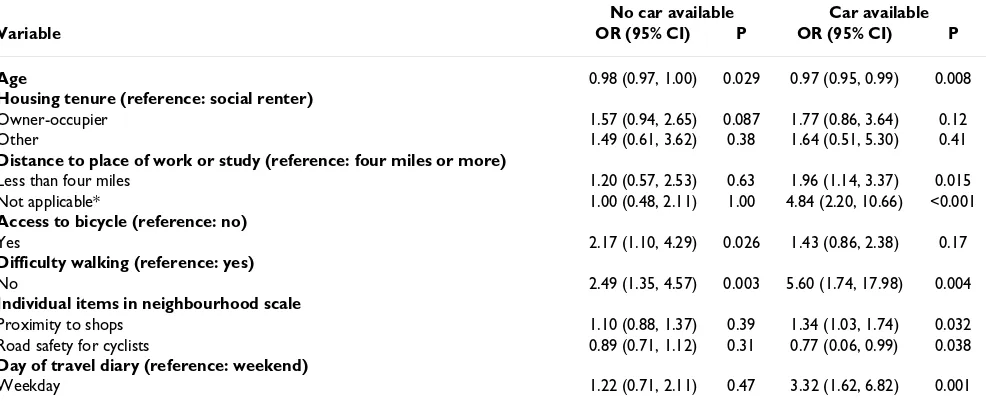
In order to aid interpretation, we also partitioned the dataset into two strata ('No car available' and 'Car
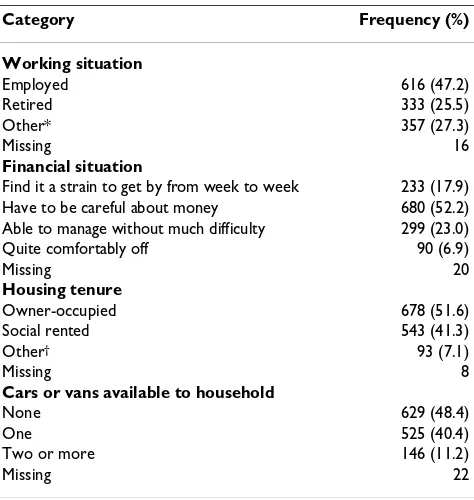
availa-Table 2: Socioeconomic characteristics of study participants
Category Frequency (%)
Working situation
Employed 616 (47.2)
Retired 333 (25.5)
Other* 357 (27.3)
Missing 16
Financial situation
Find it a strain to get by from week to week 233 (17.9)
Have to be careful about money 680 (52.2)
Able to manage without much difficulty 299 (23.0)
Quite comfortably off 90 (6.9)
Missing 20
Housing tenure
Owner-occupied 678 (51.6)
Social rented 543 (41.3)
Other† 93 (7.1)
Missing 8
Cars or vans available to household
None 629 (48.4)
One 525 (40.4)
Two or more 146 (11.2)
Missing 22
n = 1322. * On a government training scheme, full-time student, unemployed, disabled, invalid or permanently sick, or caring for home and family or dependants. † Rented in the private sector, part-owned
[image:7.612.57.294.443.693.2]ble') and refitted the final model separately to each stra-tum of the dataset (Table 6). This showed that the subset of respondents with no access to a car accounted for the significant overall relationship between active travel and access to a bicycle, whereas those with access to a car accounted for the significant overall relationships with distance to place of work or study and perceptions of the local environment. The relationship with difficulty walk-ing was also stronger in this group than in those without access to a car.
Correlates of physical activity
Physical activity was significantly associated with living in social-rented accommodation, not being overweight, and the absence of any difficulty walking. The final best model of the 'personal' correlates of physical activity provided satisfactory goodness-of-fit (Hosmer and Lemeshow test:
χ2 = 3.89, df = 7; P = 0.89) and explained about one-sixth
of the total variance in physical activity (Nagelkerke's R2 =
15.9%) (Table 7). Adding 'environmental' variables to the model showed an additional significant negative associa-tion between physical activity and percepassocia-tion of traffic volume (i.e. respondents who perceived there to be a higher volume of traffic were more likely to report physi-cal activity). The final best model of the personal and environmental correlates of physical activity also pro-vided satisfactory goodness-of-fit (Hosmer and
Leme-show test: χ2 = 3.86, df = 8; P = 0.87) and explained
slightly more of the total variance in physical activity than did the personal model alone (Nagelkerke's 16.6%) (Fig-ure 3).
Discussion
Principal findingsIn this deprived urban population, the likelihood of reporting active travel was associated with being younger, living in owner-occupied accommodation, not having to travel a long distance to work and not having access to a car, whereas overall physical activity was associated with living in social-rented accommodation and not being overweight. After adjusting for individual and household characteristics, neither perceptions of the local environ-ment nor the objective proximity of respondents' homes to motorway or major road infrastructure appeared to explain much of the variance in active travel or overall physical activity, although we did find a significant posi-tive association between acposi-tive travel and perceived prox-imity to shops.
[image:8.612.54.560.100.245.2]Representativeness and completeness of survey data Our difficulty in obtaining a representative sample of the resident population is not unique to our study. Although our final response rate was low, it was almost identical to that achieved in a recent population-based intervention study elsewhere in Glasgow [22]. Some of the challenges of recruiting research participants in areas of deprivation have been described elsewhere [23]; these are superim-posed on a downward trend in participation in even the best-resourced national population surveys [24] and an upward (and socially biased) trend in opt-outs from the main alternative sampling frame, the edited electoral reg-ister [25]. Although our achieved sample contained a higher proportion of respondents from owner-occupied
Table 3: Daily travel time by mode recorded in travel diaries
All respondents reporting valid travel time data Mode
Mean (sd) Median (IQR) (range) Proportion of total
Car 24.4 (40.8) 0.0 (40.0) (0–510) 39.7%
Walking 19.2 (27.8) 10.0 (30.0) (0–205) 31.2%
Bus 14.6 (30.8) 0.0 (20.0) (0–210) 23.7%
Rail 1.8 (10.0) 0.0 (0.0) (0–165) 2.9%
Cycling 0.7 (7.3) 0.0 (0.0) (0–130) 1.1%
Motorcycle 0.1 (2.0) 0.0 (0.0) (0–50) 0.2%
Other 0.6 (9.4) 0.0 (0.0) (0–240) 1.0%
Active modes* 20.0 (28.5) 10.0 (30.0) (0–205) 32.4%
All modes combined 61.5 (53.2) 50.0 (63.0) (0–510) 100.0%
n = 1099. sd: standard deviation. IQR: interquartile range. * Walking and cycling combined.
Table 4: Average time spent walking and total physical activity
Summary measure Mean (standard deviation) Median (interquartile range) (range)
Walking (min/week) 318.4 (366.1) 180.0 (375.0) (0–1260)
Total activity (MET-min/week) 3000.1 (3323.1) 1935.0 (3645.0) (0–18438)
[image:8.612.54.557.667.718.2]and car-owning households than predicted from 2001 census data for the same census output areas, these differ-ences may be partly accounted for by an upward back-ground trend in owner occupation and car access between
2001 and 2005. Our achieved sample is still clearly disad-vantaged overall, in terms of socioeconomic and health status, compared with the country as a whole. It also con-tains sufficient heterogeneity to enable us to examine, in time, how the effects of the intervention are distributed between socioeconomic groups. We therefore consider our achieved sample fit for purpose.
[image:9.612.56.558.101.391.2]We had to disregard a substantial proportion of cases in analysis because respondents had returned unusable travel time data or had returned physical activity data that were incomplete, internally inconsistent or included a 'Don't know' response and were therefore unacceptable according to the IPAQ scoring protocol. Most published studies using the same, short form of IPAQ have either not reported the distribution of the continuous summary measures or have not reported data for the UK separately from those for other countries where higher levels of physical activity are reported. Despite the high proportion of missing physical activity data in our dataset, however, the aggregate continuous data we obtained were broadly comparable to those reported in Rütten and colleagues' study of a random sample of UK adults [26]. We could have included more cases in physical activity analysis by, for example, imputing missing values, but the results
Table 5: Multivariate logistic regression models of correlates of active travel
Model including personal correlates Model including personal and environmental correlates
Variable OR (95% CI) P OR (95% CI) P
Age 0.98 (0.97, 0.99) <0.001 0.98 (0.97, 0.99) 0.001
Housing tenure
(reference: social renter)
Owner-occupier 1.79 (1.19, 2.69) 0.005 1.70 (1.13, 2.58) 0.012
Other 1.64 (0.83, 3.24) 0.159 1.62 (0.81, 3.23) 0.17
Distance to place of work or study
(reference: four miles or more)
Less than four miles 1.76 (1.16, 2.68) 0.008 1.81 (1.18, 2.76) 0.006
Not applicable* 2.12 (1.27, 3.54) 0.004 2.15 (1.28, 3.61) 0.004
Access to bicycle (reference: no)
Yes 1.59 (1.07, 2.35) 0.021 1.57 (1.06, 2.33) 0.025
Composite variable (reference: access to car and difficulty walking)
Car, no difficulty 4.21 (1.43, 12,43) 0.009 3.77 (1.27, 11.23) 0.017
No car, difficulty 4.65 (1.48, 14.54) 0.008 4.42 (1.40, 13.92) 0.011
No car, no difficulty 14.06 (4.84, 40.80) <0.001 12.88 (4.41, 37.67) <0.001
Individual items in neighbourhood scale
Proximity to shops 1.20 (1.02, 1.41) 0.031
Road safety for cyclists 0.83 (0.70, 0.98) 0.024
Day of travel diary (reference: weekend)
Weekday 1.96 (1.32, 3.00) 0.001 1.91 (1.26, 2.89) 0.002
n = 831. * Does not work or study or usually works at home or from home. OR: Exponent of estimated regression coefficient, i.e. estimated odds ratio. 95% CI: 95% confidence interval for estimated odds ratio.
Estimated proportions of variance in active travel and physi-cal activity explained by personal and environmental charac-teristics
Figure 3
[image:9.612.57.294.489.667.2]would not have been comparable with others' owing to the substantial deviations from the scoring protocol which would have been required. The frequency of unus-able responses was not reported in the international multi-centre study which originally established the valid-ity and reliabilvalid-ity of IPAQ [27]. It is possible that offering a 'Don't know' option in the self-completed IPAQ ques-tionnaire encourages respondents to select this rather than to enter what may be a reasonably precise estimate of the actual time spent in physical activity; the respondent has no way of knowing that a single 'Don't know' response will result in all of their physical activity data
being disregarded in analysis. This should be considered in any future revision of the IPAQ questionnaire and scor-ing protocol.
[image:10.612.60.553.111.315.2]Contribution of active travel to overall physical activity The explanatory variables that were significantly associ-ated with active travel but not with physical activity (dis-tance to place of work or study, access to a bicycle, access to a car, perceived proximity to shops, and perceived road safety for cyclists) all have an obvious intuitive relation-ship with the use of walking or cycling as modes of trans-port. That they were not significantly associated with
Table 6: Multivariate logistic regression model of personal and environmental correlates of active travel stratified by availability of a car
No car available Car available
Variable OR (95% CI) P OR (95% CI) P
Age 0.98 (0.97, 1.00) 0.029 0.97 (0.95, 0.99) 0.008
Housing tenure (reference: social renter)
Owner-occupier 1.57 (0.94, 2.65) 0.087 1.77 (0.86, 3.64) 0.12
Other 1.49 (0.61, 3.62) 0.38 1.64 (0.51, 5.30) 0.41
Distance to place of work or study (reference: four miles or more)
Less than four miles 1.20 (0.57, 2.53) 0.63 1.96 (1.14, 3.37) 0.015
Not applicable* 1.00 (0.48, 2.11) 1.00 4.84 (2.20, 10.66) <0.001
Access to bicycle (reference: no)
Yes 2.17 (1.10, 4.29) 0.026 1.43 (0.86, 2.38) 0.17
Difficulty walking (reference: yes)
No 2.49 (1.35, 4.57) 0.003 5.60 (1.74, 17.98) 0.004
Individual items in neighbourhood scale
Proximity to shops 1.10 (0.88, 1.37) 0.39 1.34 (1.03, 1.74) 0.032
Road safety for cyclists 0.89 (0.71, 1.12) 0.31 0.77 (0.06, 0.99) 0.038
Day of travel diary (reference: weekend)
Weekday 1.22 (0.71, 2.11) 0.47 3.32 (1.62, 6.82) 0.001
n = 831. * Does not work or study or usually works at home or from home. OR: Exponent of estimated regression coefficient, i.e. estimated odds ratio. 95% CI: 95% confidence interval for estimated odds ratio.
Table 7: Multivariate logistic regression models of correlates of physical activity
Model including personal correlates Model including personal and environmental correlates
Variable OR (95% CI) P OR (95% CI) P
Housing tenure
(reference: social renter)
Owner-occupier 0.67 (0.46, 0.96) 0.028 0.66 (0.46, 0.95) 0.026
Other 1.41 (0.72, 2.79) 0.32 1.45 (0.73, 2.87) 0.29
Composite variable (reference: BMI≥25 and difficulty walking)
BMI<25, no difficulty 5.49 (2.97, 10.16) <0.001 5.55 (3.00, 10.28) <0.001
BMI<25, difficulty 0.32 (0.10, 1.01) 0.053 0.31 (0.10, 0.98) 0.047
BMI≥25, no difficulty 3.93 (2.11, 7.32) <0.001 3.92 (2.10, 7.31) <0.001
Individual items in neighbourhood scale
Traffic volume 0.84 (0.70, 1.00) 0.050
Day of travel diary (reference: weekend)
Weekday 0.64 (0.44, 0.93) 0.019 0.62 (0.43, 0.91) 0.015
[image:10.612.56.556.528.719.2]overall physical activity suggests either that active travel contributes only a minority of respondents' overall physi-cal activity or that other factors not measured in this study are more important correlates of overall physical activity than those which determine active travel. A crude compar-ision of the quantity of active travel reported in the one-day travel diaries with the quantities of physical activity reported using IPAQ suggests that on average, active travel may indeed make only a small (~15%) contribution to overall physical activity in this study population. How-ever, the real contribution may be substantially greater than this if, as has been shown previously, respondents tend to over-report their physical activity using IPAQ [28]. There can be little doubt that active travel makes a
sub-stantial contribution to the total quantity of walking
reported in this study population. Irrespective of the true contribution of active travel to overall physical activity, however, it remains likely that other unmeasured per-sonal and social factors beyond the scope of this study may be more important correlates of overall physical activity.
Socio-spatial patterning of active travel and overall physical activity
Respondents living in owner-occupied households were more likely to report active travel than those living in social-rented accommodation, but less likely to report suf-ficient overall physical activity. Since neither working sit-uation nor perceived financial sitsit-uation emerged as significantly associated with active travel or overall physi-cal activity, housing tenure and car access are the remain-ing explanatory variables in this dataset which can be interpreted as markers of socioeconomic status. Although having access to a car clearly reflects the possession of a material asset, it has been argued that this is a less direct marker of socioeconomic status than some other markers because, in Scotland at least, access to a car is a more-or-less essential requirement for living in many rural areas, whereas it is possible to live in a dense urban settlement such as Glasgow without using a car. In the final models in this study, therefore, housing tenure may be regarded as the primary marker of socioeconomic status. The findings consequently suggest conflicting socioeconomic gradients in prevalence: more advantaged respondents were more likely to report active travel, but more disadvantaged respondents were more likely to report sufficient overall physical activity. The higher prevalence of sufficient over-all physical activity among the more disadvantaged despite their lower propensity for active travel is likely to reflect higher quantities of physical activity in other domains, particularly occupational and domestic activi-ties, since leisure-time physical activity tends to be higher among more advantaged groups [29].
Environmental characteristics: paradoxical, unmeasured, or irrelevant?
The two environmental variables that emerged as signifi-cantly associated with active travel, particularly among those without access to a car, were perceived proximity to shops and perceived road safety for cyclists. The positive association with perceived proximity to shops suggests that for active travel to be undertaken in this population, it may be more important that people live close to the amenities they need than that they live in an environment with more favourable subjective or discretionary consider-ations such as attractiveness or noise. This would be con-sistent with an understanding that walking as a mode of transport is primarily a way of undertaking journeys which have to be made anyway, as opposed to more dis-cretionary (recreational) forms of walking which may be more susceptible to the influence of less-structural charac-teristics.
Although the negative association with perceived road safety for cyclists appears counter-intuitive, similar 'para-doxical inverse relationships' have been reported else-where, for example by Titze and colleagues in a study of the correlates of cycling among students [30] and by Humpel and colleagues in a study of correlates of walking for pleasure [31]. Titze and colleagues suggest that respondents who cycle regularly are more likely to be aware of, and report, the danger posed by traffic than non-cyclists or infrequent non-cyclists. A similar phenomenon could explain the negative association between physical activity and perception of traffic volume.
Overall, the influence of the putative environmental char-acteristics examined in this study on active travel and physical activity appeared small compared with that of the personal characteristics found to be significant, and including environmental characteristics in the models did not substantially modify the influence of personal charac-teristics.
study reflects a reliance on respondents' perceptions which have not been objectively verified and may there-fore be a weak proxy for the 'true' objectively-measured characteristics of their surroundings. However, as recent reviews have pointed out, the current weight of evidence for objective environmental correlates of walking is no greater than that for subjective environmental correlates [5] and it is entirely plausible that people's perceptions of their environment may be at least as important as their objective conditions in influencing their behaviour [6].
On the other hand, we may have demonstrated a real absence of any major association. Although at first sight this appears at odds with the growing body of review-level evidence for environmental correlates of physical activity, Wendel-Vos and colleagues noted that of all the environ-mental factors examined in all the studies included in their review, analysis showed a 'null association' in 76% of cases [9], and our finding that personal factors account for a much larger proportion of the variance in active travel or physical activity than is accounted for by environ-mental factors is consistent with those of some other European studies [32,33]. In the particular context of this study, residents may simply have adapted to adverse con-ditions in their local environment in the ways identified by Hedges in a qualitative study of people living close to new roads built in the UK in the 1970s [34] – particularly by attitudinal adaptation, which Hedges characterises as developing an attitude that it is futile to resist. One can imagine that in the most deprived areas of Glasgow, peo-ple may have become resigned to the nature of their sur-roundings, seeing them as inevitable and not amenable to change either through environmental improvement or through their moving to another area.
Conclusion
After demographic and socioeconomic characteristics were taken into account, neither perceptions of the local environment nor objective proximity to major road infra-structure appeared to explain much of the variance in active travel or overall physical activity in this study. Our study population may be both objectively constrained by their socioeconomic circumstances (including compara-tively limited access to private cars) and adapted to living in conditions which others would consider to pose a bar-rier to active travel. Under these circumstances, environ-mental characteristics which have been found to influence discretionary active travel in studies in other, more afflu-ent populations may simply be irrelevant in a population which is more captive in its travel choices. Environmental correlates of active travel should not be assumed to be generalisable between populations; researchers should continue to test hypotheses about putative environmental correlates in different settings, and policymakers should recognise that the effects of interventions to change the
environment are likely to vary between populations and between socioeconomic groups within populations.
Competing interests
This paper is based on material contained in the first author's PhD thesis.
Authors' contributions
DO had the original idea for the study, designed the study and the survey materials, applied for ethical approval, cleaned and coded the survey data, carried out all the geo-graphical and statistical analyses and wrote the paper. MP was DO's PhD supervisor. RM, NM, MP and SP consti-tuted the steering group for the study, contributed to and advised on the design of the study and the interpretation of the emerging findings, and contributed to the critical revision of the paper. All authors read and approved the final manuscript.
Additional material
Acknowledgements
DO was funded by a Medical Research Council (MRC) special training fel-lowship in health of the public research (award reference no. G106/1203 67290). MP, RM and SP were funded by the Chief Scientist Office of the Scottish Executive Health Department (now of the Scottish Government Public Health and Wellbeing Directorate). The opinions expressed here are those of the authors and not necessarily those of the funders. The study was approved by the University of Glasgow Medical Faculty Ethics Commit-tee (project reference no. FM01304). The SF-8 health survey was used under licence from QualityMetric Incorporated (licence agreement no. R1-061005-22740). We thank the survey team at the MRC Social and Public Health Sciences Unit for carrying out the survey and the local residents who took part.
References
1. Trost S, Owen N, Bauman A, Sallis J, Brown W: Correlates of adults' participation in physical activity: review and update.
Med Sci Sports Exerc 2002, 34:1996-2001.
2. Dora C: A different route to health: implications of transport policies. BMJ 1999, 318:1686-1689.
3. Hillsdon M, Foster C, Thorogood M: Interventions for promoting physical activity. Cochrane Database Syst Rev 2007:CD003180. 4. Owen N, Leslie E, Salmon J, Fotheringham M: Environmental
determinants of physical activity and sedentary behavior.
Exerc Sports Sci Rev 2000, 28:153-158.
Additional file 1
Survey questionnaire Click here for file[http://www.biomedcentral.com/content/supplementary/1479-5868-5-43-S1.pdf]
Additional file 2
Further details of multivariate logistic regression modelling Click here for file
Publish with BioMed Central and every scientist can read your work free of charge "BioMed Central will be the most significant development for disseminating the results of biomedical researc h in our lifetime."
Sir Paul Nurse, Cancer Research UK
Your research papers will be:
available free of charge to the entire biomedical community
peer reviewed and published immediately upon acceptance
cited in PubMed and archived on PubMed Central
yours — you keep the copyright
Submit your manuscript here:
http://www.biomedcentral.com/info/publishing_adv.asp
BioMedcentral
5. Owen N, Humpel N, Leslie E, Bauman A, Sallis J: Understanding environmental influences on walking: review and research agenda. Am J Prev Med 2004, 27:67-76.
6. Saelens B, Sallis J, Frank L: Environmental correlates of walking and cycling: findings from the transportation, urban design and planning literatures. Ann Behav Med 2003, 25:80-91. 7. Handy S: Critical assessment of the literature on the relationships among
transportation, land use, and physical activity Washington, DC: Trans-portation Research Board and Institute of Medicine Committee on Physical Activity, Health, Transportation, and Land Use; 2004. 8. Badland H, Schofield G: Transport, urban design and physical
activity: an evidence-based update. Transport Res D 2005,
10:177-196.
9. Wendel-Vos W, Droomers M, Kremers S, Brug J, van Lenthe F:
Potential environmental determinants of physical activity in adults. In Environmental determinants and interventions for physical activity, nutrition and smoking: a review Edited by: Brug J, van Lenthe F. Rotterdam: Erasmus University Medical Centre; 2005.
10. Duncan M, Spence J, Mummery K: Perceived environment and physical activity: a meta-analysis of selected environmental characteristics. Int J Behav Nutr Phys Act 2006, 2:11.
11. Giles-Corti B, Donovan R: The relative influence of individual, social and physical environment determinants of physical activity. Soc Sci Med 2002, 54:1793-1812.
12. Lake A, Townshend T: Obesogenic environments: exploring the built and food environments. J Roy Soc Promot Healt 2006,
126:262-267.
13. Handy S: Methodologies for exploring the link between urban form and travel behavior. Transport Res D 1996, 1:151-165. 14. Bauman A: The physical environment and physical activity:
moving from ecological associations to intervention evi-dence. J Epidemiol Community Health 2005, 59:535-536.
15. Ogilvie D, Mitchell R, Mutrie N, Petticrew M, Platt S: Evaluating health effects of transport interventions: methodologic case study. American Journal of Preventive Medicine 2006, 31:118-126. 16. Glasgow and the Clyde Valley Structure Plan Joint Committee:
Glas-gow and the Clyde Valley joint structure plan 2000. GlasGlas-gow 2000. 17. Edwards P, Roberts I, Clarke M, DiGuiseppi C, Pratap S, Wentz R,
Kwan I: Increasing response rates to postal questionnaires: systematic review. BMJ 2002, 324:1183-1191.
18. Ogilvie D, Mitchell R, Mutrie N, Petticrew M, Platt S: Perceived characteristics of the environment associated with active travel: development and testing of a new scale. Int J Behav Nutr Phys Act 2008, 5:32.
19. Ware J, Kosinski M, Dewey J, Gandek B: How to score and interpret sin-gle-item health status measures: a manual for users of the SF-8 (TM) Health Survey Lincoln, RI: QualityMetric Incorporated; 2001. 20. Chief Medical Officer: At least five a week: evidence on the impact of
physical activity and its relationship to health London: Department of Health; 2004.
21. Hosmer D, Lemeshow S: Model-building strategies and meth-ods for logistic regression. In Applied logistic regression New York: Wiley; 1989:82-134.
22. Cummins S, Petticrew M, Higgins C, Findlay A, Sparks L: Large scale food retailing as an intervention for diet and health: quasi-experimental evaluation of a natural experiment. J Epidemiol Community Health 2005, 59:1035-1040.
23. Parry O, Bancroft A, Gnich W, Amos A: Issues of respondent recruitment in areas of deprivation. Critical Public Health 2001,
11:305-317.
24. Nicolaas G: The use of incentives to motivate "hard to get" households on the National Travel Survey. Survey Methods Newsletter 2004, 22:19-27.
25. Nicolaas G: Putting voters in the frame. NatCen News 2006,
13:12.
26. Rütten A, Ziemainz H, Schena F, Stahl T, Stiggelbout M, Auweele Y van den, Vuillemin A, Welshman J: Using different physical activ-ity measurements in eight European countries. Results of the European Physical Activity Surveillance System (EUPASS) time series survey. Public Health Nutr 2003,
6:371-376.
27. Craig C, Marshall A, Sjöström M, Bauman A, Booth M, Ainsworth B, Pratt M, Ekelund U, Yngve A, Sallis J, Oja P: International physical activity questionnaire: 12-country reliability and validity.
Med Sci Sports Exerc 2003, 35:1381-1389.
28. Rzewnicki R, Auweele Y van den, de Bourdeaudhuij I: Addressing overreporting on the International Physical Activity Ques-tionnaire (IPAQ) telephone survey with a population sam-ple. Public Health Nutr 2003, 6:299-305.
29. Stamatakis E: Physical activity. In Health survey for England 2003: risk factors for cardiovascular diseaseVolume 2. Edited by: Sproston K, Primatesta P. London: National Statistics; 2004.
30. Titze S, Stronegger W, Janschitz S, Oja P: Environmental, social, and personal correlates of cycling for transportation in a stu-dent population. J Phys Act Health 2007, 4:66-79.
31. Humpel N, Owen N, Iverson D, Leslie E, Bauman A: Perceived environment attributes, residential location, and walking for particular purposes. Am J Prev Med 2004, 26:119-125.
32. De Bourdeaudhuij I, Teixeira P, Cardon G, Deforche B: Environ-mental and psychosocial correlates of physical activity in Portuguese and Belgian adults. Public Health Nutr 2005,
8:886-95.
33. De Geus P, De Bourdeaudhuij I, Jannes C, Meeusen R: Psychosocial and environmental factors associated with cycling for trans-port among a working population. Health Educ Res 2007. 34. Hedges A: Adaptations to traffic noise London: Social and Community