Abstract— The variation in the Raman gain coefficient in single-crystal diamond for pump wavelengths between 355 and 1450 nm has been measured. Two techniques have been used: a pump-probe approach giving an absolute measurement and a stimulated Raman oscillation threshold technique giving a relative measurement. Both approaches indicate that the Raman gain coefficient is a linear function of pump wavenumber. With the pump polarised along a <111> direction in the crystal, the Raman gain coefficient measured by the pump-probe technique was found to vary from 7.6±0.8 for a pump wavelength of 1280 nm to 78±8 cm/GW for a pump wavelength of 355 nm.With the established dependence of the Raman gain coefficient on the pump wavelength, the Raman gain coefficient can be estimated at any pump wavelength within the spectral range from 355 up to 1450 nm.
Index Terms—Raman gain, Raman scattering, diamond
I. INTRODUCTION
IGNIFICANT progress has been made recently in the power scaling of continuous wave (CW) intracavity diamond Raman lasers, from a few hundreds of milliwatts [1] to 5.1 W [2] over the last two years. This has been extended to 10 W using an external cavity approach [3]. To a great extent, this has been enabled by recent advances in the manufacture of synthetic diamond [4, 5]. Substantial reductions have been achieved in the absorption coefficient (from 0.03 cm-1 [1] down to 0.004 cm-1 [2]) in material that simultaneously has low birefringence. This, combined with the high integral and peak Raman cross-sections in diamond [6] and its unrivalled thermo-optical properties [4, 5, 7], has triggered recent experimental work on the application of synthetic diamond as a Raman laser crystal, building on the first demonstration of stimulated Raman scattering (SRS) in this crystal [8]. Both pulsed [9-15] and CW [1-3, 16] external cavity and intracavity diamond Raman lasers have been demonstrated pumped by doped-dielectric lasers; tunable CW operation has also been achieved using a semiconductor disk laser as the pump source [17].
Manuscript received 3 October, 2012. This works was funded by the European Research Council (ERC; 278389) and the UK Engineering and Physical Science Research Council (EPSRC; EP/G00014X/1). The work was also assisted by the loan of the Continuum Panther OPO system from the EPSRC laser loan pool.
Vasili G. Savitski, Sean Reilly, and Alan J. Kemp are with the Institute of Photonics, University of Strathclyde, SUPA, 106 Rottenrow, Glasgow G4 0NW, UK (corresponding author phone: 44-141-548-5736; fax: 44-141-552-1575; e-mail: vasili.savitski@strath.ac.uk).
The Raman-related properties of diamond have been the subject of intensive study since 1930, when the first Raman spectrum of the diamond was presented [18-25]. The Raman gain coefficient in diamond is directly relevant to the study of stimulated Raman scattering (SRS) in solid-state media in general and to Raman laser engineering in particular. The variation of this quantity with wavelength will determine the spectral range within which diamond Raman lasers will operate efficiently. The values in the literature for the Raman gain coefficient in diamond at a specific pump wavelength often vary widely [9, 10, 12-14, 21, 26]. Further, most of these measurements are at two pump wavelengths: 1064 nm [12, 13, 26] and 532 nm [9, 10]. The wider spectral dependence has not been determined experimentally.
The Raman gain coefficient is typically deduced in one of two ways: from a comparison of the SRS threshold in diamond with that for a material with a known gain coefficient [26], or from modelling of the measured Raman laser performance [9, 10, 12, 13]. Due to differences in crystal orientation, sample quality and pump polarization, which are often not detailed in the papers, reported Raman gain coefficients vary from 50 cm/GW [10] to 75 cm/GW [9] at a pump wavelength of 532 nm and from 12.5 cm/GW [26] to 21 cm/GW [2] at 1064 nm. Other values quoted are 6.9 cm/GW [21] at 694 nm in natural diamond, calculated from the theory of SRS, and 100 cm/GW [14] at 266 nm, estimated after Raman laser performance modelling. To the best of our knowledge, the steady-state Raman gain in single crystal (SC) chemical vapour deposition (CVD) grown diamond has been measured directly using a pump-probe technique only in [2] at the pump wavelength of 1064 nm.
Very few measurements of the dependence of the Raman gain on pump wavelength in solid-state media have been published. Such measurements were performed on barium tungstate [27] and barium nitrate [28] within a relatively narrow band of pump wavelengths (532-1064 nm). SRS theory predicts that the Raman gain coefficient should vary as one over the Stokes (and hence the pump) frequency [29-31]. However, experimentally, the Raman gain coefficient was found to decline more rapidly than expected theoretically towards longer pump wavelengths [27, 28].
In this paper we present the results of the first systematic study of the dependence of the steady-state Raman gain coefficient in single-crystal CVD diamond on pump wavelength. The absolute values of Raman gain coefficient for pump wavelengths between 355 and 1280 nm were measured
Steady-State Raman Gain in Diamond as a
Function of Pump Wavelength
Vasili G. Savitski, Sean Reilly, Alan J. Kemp,
Member, IEEE
directly using a pump-probe technique. In addition, the relative Raman gain was deduced from measurements of the stimulated Raman oscillation threshold at pump wavelengths between 355 and 1450 nm. In both cases the Raman gain shows a linear dependence on pump wavenumber. The pump probe measurements indicate that the gain coefficient increases from 7.6±0.8 cm/GW at 1280 nm to 78±8 cm/GW at 355 nm.
The next section describes the experimental methods for Raman gain measurement: pump-probe and threshold techniques. Section 3 presents the results of loss measurements in the diamond sample. Section 4 then discusses the results, and is followed by some conclusions.
II. EXPERIMENTAL SET-UP:RAMAN GAIN MEASUREMENTS
The single-crystal CVD-grown diamond under investigation was supplied by Element Six Ltd. The same sample was used as in a previous study [2]. It was cut for light propagation along a <110> axis and had a length of 6.5 mm. The crystal had a low birefringence of Δn~1.3×10⁻⁶ [2]. The sample had no anti-reflection coatings.
The Raman gain coefficient in this sample was measured at different pump wavelengths using an established pump-probe technique [27, 32, 33]. The main advantage of this approach is that it directly measures the absolute value of the gain coefficient. Relative changes in Raman gain with pump wavelength were also determined by measuring the threshold for the onset of stimulated Raman oscillation in the sample. For both experiments the pump was either a Continuum Panther Optical Parametric Oscillator (OPO), used to produce
using a half wave plate (3) and a Glan prism (4). The transmitted beam was used to pump the diamond sample under investigation (5) after being focused using a lens of focal length f=300 mm (6).
The reflected beam was focused into a second diamond sample (7) using lens (8) (f=50 mm) to provide a probe pulse at the Raman wavelength. A Raman cavity was formed by a dichroic mirror (9) (highly reflective at the probe wavelength and highly transmitting at the pump wavelength) and the back surface of the diamond, which reflects approximately 17% (Fresnel reflection) of the Raman and pump. Further dichroic mirrors (10) were used to filter out the residual pump from the Raman probe beam produced. A glass plate (15) was used to pick off a small fraction of the probe beam. This was then focused into a photodetector (11). The remaining probe was brought collinear with the pump beam using another dichroic mirror (10) with the same properties as before and focussed into the diamond. The beams exiting the diamond were then collimated (lens (6)) and separated (dichroic mirror (10)). The amplified probe beam was focused into a second photodetector (12). The signals from detectors (11) and (12) were analysed by the oscilloscope (13). The signals from the detectors were averaged over 100 laser shots, and the resulting uncertainty in the amplified signal was ~1%.
In the pump-probe experiments, the gain is measured in the Raman amplifier regime [29]. In this case, the pump intensities are relatively modest and substantially lower (as it will be shown below) than the intensities required to achieve the threshold for stimulated Raman oscillation [29] in diamond. Operation in the linear amplification regime was ensured by careful control of the pump intensity. Slight tilting of the diamond under investigation with respect to the pump axis and a wedge of 0.9º between the end faces of the crystal [2] prevented stimulated Raman oscillation affecting the pump-probe measurements.
The experimental set-up for the stimulated Raman oscillation threshold measurements is depicted in Fig. 1 (b). The pump emission from the laser (1) was attenuated using a half wave plate (2) and a Glan prism (3). It was then focused into the sample under investigation (4) by a lens (5) with a focal length of 200 mm. The Raman emission generated in the sample was filtered out from the pump radiation using a dichroic mirror (7) and focused down with a lens (6) into the entrance slit of a monochromator (8). The Raman signal was
Fig. 1. (a) The pump-probe set-up used for measurements of the absolute value of the Raman gain coefficient: (1) OPO or Minilite II laser; (2) 50/50 beam splitter; (3) half-wavelength plate; (4) Glan-Taylor prism polariser; (5) sample under study; (6), (8) lenses; (7) sample generating the probe beam; (9), (10) dichroic mirrors; (11), (12) photodetectors; (13) digital oscilloscope; (14) beam-dump; (15) glass plate.
[image:2.595.66.268.88.274.2]measured using a photodetector (9), and analysed with an oscilloscope (10).
Detectors (11), (12) (Fig. 1 (a)), and (9) (Fig. 1 (b)) were DET 100 photodiodes (Thorlabs) at pump wavelength of 355-1064 nm and PDA-10CS (Thorlabs) at 1280-1450 nm.
[image:3.595.329.528.86.244.2]The pump (in both experiments) and the probe (in the pump-probe measurements) were polarised along a <111> direction in the diamond, the direction of highest Raman gain [2, 12].
The pump/probe spot sizes were measured using a CCD camera. The averaging was performed over 100 laser shots. The resulting uncertainty in spot sizes did not exceed 3%.
III. MEASUREMENTS OF LOSS IN DIAMOND
Optical absorption in CVD diamond results mainly from the presence of substitutional nitrogen [5] and the value of the absorption coefficient increases at shorter wavelengths [5]. This absorption should be taken into account when calculating the Raman gain coefficient (as shown below).
The absorption coefficient in the diamond crystal was measured using a simplified calorimetry technique (described in [2]) at wavelengths of 1064, 640, 532, 452 and 364 nm. The results are presented in Fig. 2 as a function of pump photon energy (solid squares); the solid line is the best fit to the data using an exponential growth function. The absorption coefficient was found to increase substantially from 0.03 cm-1 at 1064 nm to 0.7 cm-1 at 364 nm. The measured absorption coefficient of the investigated diamond at 1064 nm is ~10 times higher than the one in the crystal studied by us before [2] with the single substitutional nitrogen concentration of 20 ppb, but is the same as the absorption coefficient estimated for the sample, which was used for demonstration of the first CW diamond Raman laser [1]. According to results of measurements of dependence of the absorption coefficient in diamond on the nitrogen content [5], the concentration of single substitutional nitrogen in the studied sample can be estimated to be 100±20 ppb.
IV. RESULTS AND DISCUSSION A. Pump-probe technique
It has been demonstrated previously [34-37] that stimulated Raman amplification depends on the linewidth of the pump source ΔνL. This is illustrated in Fig. 3 which shows the typical dependences of the fractional gain (the definition of this term is presented below) in diamond on the pump energy at a wavelength of 670 nm when the OPO is operated in unseeded (ΔνL=5 cm-1) and seeded (ΔνL=2 cm-1) pump modes: larger gain per unit pump energy is seen for narrower linewidth seeded pump operation.
Therefore, the equation for calculation of the Raman gain coefficient g (1) [33] (and the equation for the relative Raman gain (5)) has been modified by including the term (1+ ΔνL/ ΔνR) [34, 37], which takes into account the linewidth of the pump emission and that of the Raman scattering (ΔνR). It should be noted that the data in Fig. 3 fits well with this correction factor. The absorption coefficients αL and αR of the sample at the pump and probe (Raman) wavelengths have also been factored into the equation to account for attenuation of the pump and probe intensity [30]:
(
)
⎥⎥ ⎦ ⎤ ⎢ ⎢ ⎣ ⎡ Δ Δ + + + ⎟ ⎠ ⎞ ⎜ ⎝ ⎛ = − − − R L S p S p eff eff R S S L E g L E E ν ν τ τ ω ω π α 1 ) ( 2 1 )] exp( [ 2 2 2 2 2 / 3 0 (1),)
1
(
R
2E
E
eff=
inc−
(2),[
L]
Leff L
L = 1−exp(−
α
) /α
(3).In (1-3) ωP (ωS) and τP (τS) stand for the pump (probe) beam radii and pulse durations (at 1/e2of the peak intensity). L is the sample length. Es and Es0 are the probe energies after and before the sample, respectively, Einc is the incident pump energy and R is the Fresnel reflection from the diamond surface (R was chosen to be 0.17 within the 355-1800 nm spectral range, since the refractive index of diamond varies from 2.49 at a wavelength of 355 nm to 2.384 at 1800 nm [38] and, therefore, Fresnel reflection from a diamond surface changes insignificantly from 0.18 to 0.167 within this spectral
[image:3.595.61.253.89.246.2]Fig. 3. Fractional Raman gain in diamond at pump wavelength of 670 nm with different pump linewidths.
range). The equation for the effective pump pulse energy Eeff presented in (2) results from the energy lost to the Fresnel reflection from the front surface of the diamond being partially balanced by the Fresnel reflection back into the sample from the rear surface in line with calculations made in [2]. The Raman linewidth in CVD grown diamond was reported to be 2.1 [39] and 2.5 cm-1 [40, 41]. The latter value better describes the relative changes in Raman amplification at different pump linewidths (see Fig. 3) and therefore was chosen for further Raman gain calculations. It should be noted that with a value of ΔνR=2.1 cm-1 the corresponding values of the Raman gain would be ~8% higher.
From (1) it follows that the Raman gain coefficient can be calculated from the dependence on incident pump energy on the ratio of the probe energy after (Es) and before (Es0) the sample [33]. The voltage produced by photodetectors (11) and (12) (U11, 12) (see Fig. 1 (a)) is proportional to the energy incident upon them, i.e. U11=K11Es0 and U12=K12Es where K11, 12 are the constants of proportionality. The left-hand side term in (1) then equals:
(
)
(
)
1 11 )] exp( [
11 12
11 12
0 − − = − = −
WP P WP
P R
S
S U
U U
U U U L
E
E α (4),
where (U12/U11)P(WP)=UP(WP) are the ratios of signals taken when the sample under investigation is (is not) pumped.
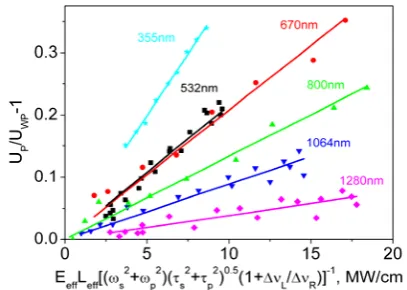
The spatial, temporal and spectral (linewidth) characteristics of the pump emission from the OPO and the Minilite laser as well as the absorption coefficient of the diamond vary with the wavelength; hence, in Fig. 4, the fractional Raman gain
(UP/UWP-1) is plotted as a function of the term in square
brackets in eq. (1). This quantity is proportional to the pump intensity. The measurements were performed with the OPO operating in seeded mode. Equation (1) is valid within the linear amplification regime. Therefore, only the linear part of the amplification of the probe signal is presented in Fig. 4, similar to [2].
The solid lines in Fig. 4 are the results of least squares linear fits to the experimental data with a condition of a fixed intercept at the origin. The typical error in the gradient is ±10%. It is mainly associated with the scatter of the data points and is substantially higher than typical uncertainties in pump/probe spot sizes and uncertainties of any data point. The
value of the Raman gain coefficient of 17±2 cm/GW at the pump wavelength of 1064 nm measured in the present paper is within the experimental uncertainty of the value of 21±2 cm/GW measured earlier at the same pump wavelength [2].
B. Stimulated Raman oscillation threshold technique
For a Raman oscillator, the gain (G=gIL (I is the pump laser intensity) [29]) at the stimulated Raman oscillation threshold should be equal to losses in the sample under study (similar to a conventional laser) [29, 42, 43]. The resonator of the Raman oscillator in the studied diamond crystal is formed by uncoated surfaces with Fresnel reflections of R=0.17. The total loss in the sample under study is the sum of two parts [43]. The first part, L1, independent on Raman wavelength, is due to Raman emission leakage through the uncoated surfaces of the diamond, multiplied by the factor k>1, which accounts for some misalignment of the resonator due to a wedge between the end faces of the crystal: L1= -2klnR. The second part, L2, dependent on Raman wavelength, is due to attenuation of the Raman emission inside the diamond crystal: L2=2αRL. Since within the Raman wavelength range of 370-1800 nm L1 is at least 4 times higher than L2 (even before the coefficient k is accounted for), we can assume that losses of the uncoated diamond sample are roughly the same at different wavelengths and in our case are mainly determined by the Fresnel losses of the diamond surfaces and the wedge between its end faces.
Thus, the relative Raman gain at different pump wavelengths can be compared by comparing the incident pump intensities which correspond to the threshold for stimulated Raman oscillation Ith,inc. Above the threshold intensity, the stimulated Raman signal builds up rapidly [29]. The threshold can be estimated from a fit to the linear portion of a plot of stimulated Raman intensity as a function of pump intensity, as is commonly done for conventional lasers [42].
The threshold method for calculating the relative Raman gain was employed to demonstrate the relative dependence of the Raman gain coefficient in diamond on the pump wavelength and to compare this with that obtained via the pump-probe technique.
[image:4.595.64.268.90.235.2]The relative Raman gain can be extracted from the values of the stimulated Raman oscillation threshold using the following equation [29], taking into account the linewidth of the pump emission and the Raman linewidth as well as the attenuation of the pump intensity within the sample [30]:
[image:4.595.307.538.107.188.2](
)
eff eff th
R L
L
I
g
,
1
+
Δ
ν
Δ
ν
∝
(5),)
1
(
2,
,
I
R
I
theff=
thinc−
(6).Stimulated Raman oscillation threshold measurements in diamond at different pump wavelengths are presented in Fig. 6. The Raman signal in Fig. 6 is plotted as a function of the product of the effective pump intensity Ieff=Iinc(1-R2) and effective length of the diamond crystal Leff (Iinc is the incident pump intensity). This accounts for the different absorption coefficients of the diamond crystal at different pump wavelengths. The transition from spontaneous Raman scattering to the stimulated oscillation results in the observed rapid increase in the Raman scattered signal above threshold. The solid lines in the figure are the linear fits to the stimulated Raman part of experimental dependence. Relative values of Raman gain in diamond at different wavelengths estimated using (5, 6) and normalized to the largest value are shown in Fig. 5 (open circles). Good agreement is observed between two experimental methods of measuring the Raman gain when the right-hand vertical axis in Fig. 5 is scaled from 0 up to 1.7 and the left-hand one is scaled from 0 up to 150 cm/GW.
Optical damage of the diamond surface was observed at pump intensities of ~6 GW/cm2 at a pump wavelength of 1450 nm. This prevented further measurements of the stimulated Raman oscillation threshold in diamond at longer wavelengths.
Previously reported values of the Raman gain in diamond at different wavelengths are also shown in Fig. 5 (triangles). Two groups of data points are shown: the first (open triangles) are for cases where the diamond orientation is not reported; the second (solid triangles) presents the values measured in diamond with known orientation, and where we have corrected the gain coefficient for pump polarisation along a
<111> direction in diamond. In general, these are in good agreement with the measured values presented in this paper. The difference in the value of the Raman gain at 670 nm presented in this paper with that reported in [21] may be related to the different quality of investigated diamonds. The absolute and relative values of the Raman gain in diamond both scale linearly with the pump wavenumber (see Fig. 5, dotted line).
V. CONCLUSIONS
Pump-probe and stimulated Raman oscillation threshold techniques were used to give absolute and relative measurements of the steady-state Raman gain coefficient in CVD-grown single-crystal diamond. Both methods indicate that the Raman gain coefficient is a linear function of pump wavenumber within the pump wavelength range between 355 and 1450 nm. The measurements were taken with the pump polarisation along a <111> direction in the diamond. The Raman gain coefficient, determined using the pump-probe technique, varied from ~7.6±0.8 cm/GW for a pump wavelength of 1280 nm to 78±8 cm/GW at 355 nm. This is in reasonable agreement with previously reported values of the Raman gain coefficient in diamond whilst experimentally verifying a 1/λ dependence on the pump wavelength for the first time. At the technologically important pump/Raman wavelengths of 532/573 nm, 1064/1240 nm and 1.28/1.54 μm the Raman gain coefficients were measured to be 42±4, 17±2 and 7.6±0.8 cm/GW respectively. These measurements, and the confirmation of how the Raman gain coefficient varies with wavelength, will assist with the design of future diamond Raman lasers.
ACKNOWLEDGMENT
The authors would like to thank Element Six Ltd for their continuing support of this work: Ian Friel for his advice on diamond materials science and for access to state of the art material; Benno Vrolijk for repolishing of samples.
[image:5.595.324.533.88.234.2]Vasili G. Savitski received the Engineering Diploma in optics from the Belarus National Technical University, Minsk, in 1999, and the Ph.D. degree from the Institute of Physics, Minsk, in 2005 for work on the nonlinear optics of quantum dots in glasses. He worked at the International Laser Center,
Fig. 6. Raman intensity in dependence on product of effective pump intensity and effective crystal length at different pump wavelengths. Fig. 5. Absolute (solid squares) and relative (open circles) values of the
[image:5.595.58.278.91.253.2]Strathclyde, Glasgow, U.K., where he works on the use of diamond in lasers.
REFERENCES
[1] W. Lubeigt, G. M. Bonner, J. E. Hastie, M. D. Dawson, D. Burns, and A. J. Kemp, "Continuous-wave diamond Raman laser," Optics Letters, vol. 35, pp. 2994-2996, 2010.
[2] V. G. Savitski, I. Friel, J. E. Hastie, M. D. Dawson, D. Burns, and A. J. Kemp, "Characterization of Single-Crystal Synthetic Diamond for Multi-Watt Continuous-Wave Raman Lasers," IEEE Journal of Quantum Electronics, vol. 48, pp. 328-337, 2012. [3] O. Kitzler, A. McKay, and R. P. Mildren, "Continuous-wave
wavelength conversion for high-power applications using an external cavity diamond Raman laser," Opt. Lett., vol. 37, pp. 2790-2792, 2012.
[4] I. Friel, S. L. Clewes, H. K. Dhillon, N. Perkins, D. J. Twitchen, and G. A. Scarsbrook, "Control of surface and bulk crystalline quality in single crystal diamond grown by chemical vapour deposition," Diamond and Related Materials, vol. 18, pp. 808-815, 2009.
[5] I. Friel, S. L. Geoghegan, D. J. Twitchen, and G. A. Scarsbrook, "Development of high quality single crystal diamond for novel laser applications," presented at Optics and Photonics for Counterterrorism and Crime Fighting VI and Optical Materials in Defence Systems Technology VII, Toulouse, France, 2010. [6] T. T. Basiev, A. A. Sobol, P. G. Zverev, V. V. Osiko, and R. C.
Powell, "Comparative Spontaneous Raman Spectroscopy of Crystals for Raman Lasers," Appl. Opt., vol. 38, pp. 594-598, 1999.
[7] R. S. Balmer, J. R. Brandon, S. L. Clewes, H. K. Dhillon, J. M. Dodson, I. Friel, P. N. Inglis, T. D. Madgwick, M. L. Markham, T. P. Mollart, N. Perkins, G. A. Scarsbrook, D. J. Twitchen, A. J. Whitehead, J. J. Wilman, and S. M. Woollard, "Chemical vapour deposition synthetic diamond: materials, technology and applications," Journal of Physics-Condensed Matter, vol. 21, pp. 364221, 2009.
[8] G. Eckhardt, D. P. Bortfeld, and M. Geller, "Stimulated Emission of Stokes and Anti-Stokes Raman Lines from Diamond, Calcite, and Alpha-Sulfur Single Crystals," Applied Physics Letters, vol. 3, pp. 137-138, 1963.
[9] R. P. Mildren, J. E. Butler, and J. R. Rabeau, "CVD-diamond external cavity Raman laser at 573 nm," Optics Express, vol. 16, pp. 18950-18955, 2008.
[10] D. J. Spence, E. Granados, and R. P. Mildren, "Mode-locked picosecond diamond Raman laser," Opt. Lett., vol. 35, pp. 556-558, 2010.
[11] W. Lubeigt, G. M. Bonner, J. E. Hastie, M. D. Dawson, D. Burns, and A. J. Kemp, "An intra-cavity Raman laser using synthetic single-crystal diamond," Opt. Express, vol. 18, pp. 16765-16770, 2010.
[12] A. Sabella, J. A. Piper, and R. P. Mildren, "1240 nm diamond Raman laser operating near the quantum limit," Optics Letters, vol. 35, pp. 3874-3876, 2010.
[13] J.-P. M. Feve, K. E. Shortoff, M. J. Bohn, and J. K. Brasseur, "High average power diamond Raman laser," Optics Express, vol. 19, pp. 913-922, 2011.
[19] C. V. Raman, "The crystal symmetry and structure of diamond,"
Proceedings of the Indian Academy Of Science, Section A, vol. 19, pp. 189-198, May 1944.
[20] S. A. Solin and A. K. Ramdas, "Raman Spectrum of Diamond,"
Physical Review B, vol. 1, pp. 1687-1698, 1970.
[21] A. K. McQuillan, W. R. L. Clements, and B. P. Stoicheff, "Stimulated Raman Emission in Diamond - Spectrum, Gain, and Angular Distribution of Intensity," Physical Review A, vol. 1, pp. 628-635, 1970.
[22] E. Anastassakis and E. Burstein, "Electric-Field-Induced Infrared Absorption and Raman Scattering in Diamond," Physical Review B, vol. 2, pp. 1952-1965, 1970.
[23] M. D. Levenson, C. Flytzanis, and N. Bloembergen, "Interference of Resonant and Nonresonant 3-Wave Mixing in Diamond,"
Physical Review B, vol. 6, pp. 3962-3965, 1972.
[24] J. M. Calleja, J. Kuhl, and M. Cardona, "Resonant Raman-Scattering in Diamond," Physical Review B, vol. 17, pp. 876-883, 1978.
[25] G. L. Eesley and M. D. Levenson, "Coherent, Non-Linear 2-Phonon Raman Spectra of Diamond," Optics Letters, vol. 3, pp. 178-180, 1978.
[26] A. A. Kaminskii, R. J. Hemley, J. Lai, C. S. Yan, H. K. Mao, V. G. Ralchenko, H. J. Eichler, and H. Rhee, "High-order stimulated Raman scattering in CVD single crystal diamond," Laser Physics Letters, vol. 4, pp. 350-353, 2007.
[27] V. A. Lisinetskii, S. V. Rozhok, D. N. Bus'ko, R. V. Chulkov, A. S. Grabtchikov, V. A. Orlovich, T. T. Basiev, and P. G. Zverev, "Measurements of Raman gain coefficient for barium tungstate crystal," Laser Physics Letters, vol. 2, pp. 396-400, 2005. [28] V. A. Lisinetskii, Mishkel, II, R. V. Chulkov, A. S. Grabtchikov,
P. A. Apanasevich, H. J. Eichler, and V. A. Orlovich, "Raman gain coefficient of barium nitrate measured for the spectral region of Ti : Sapphire laser," Journal of Nonlinear Optical Physics & Materials, vol. 14, pp. 107-114, 2005.
[29] A. Penzkofer, A. Laubereau, and W. Kaiser, "High-Intensity Raman Interactions," Progress in Quantum Electronics, vol. 6, pp. 56-140, 1979.
[30] G. P. Agrawal, Nonlinear Fiber Optics: Academic Press, 2001. [31] H. M. Pask, "The design and operation of solid-state Raman
lasers," Progress in Quantum Electronics, vol. 27, pp. 3-56, 2003. [32] J. J. Ottusch and D. A. Rockwell, "Measurement of Raman Gain
Coefficients of Hydrogen, Deuterium, and Methane," IEEE Journal of Quantum Electronics, vol. 24, pp. 2076-2080, 1988. [33] R. Stegeman, C. Rivero, G. Stegeman, P. Delfyett, K. Richardson,
L. Jankovic, and H. Kim, "Raman gain measurements in bulk glass samples," Journal of the Optical Society of America B-Optical Physics, vol. 22, pp. 1861-1867, 2005.
[34] A. Z. Grasiuk and I. G. Zubarev, "High-Power Tunable IR Raman Lasers," Applied Physics, vol. 17, pp. 211-232, 1978.
[35] W. K. Bischel and M. J. Dyer, "Wavelength Dependence of the Absolute Raman Gain Coefficient for the Q(1) Transition in H-2,"
Journal of the Optical Society of America B-Optical Physics, vol. 3, pp. 677-682, 1986.
[37] R. Claps, D. Dimitropoulos, V. Raghunathan, Y. Han, and B. Jalali, "Observation of stimulated Raman amplification in silicon waveguides," Opt. Express, vol. 11, pp. 1731-1739, 2003. [38] A. M. Zaitsev, Optical Properties of Diamond: A Data Handbook:
Springer, 2001.
[39] R. Linares and P. Doering, "Properties of large single crystal diamond," Diamond and Related Materials, vol. 8, pp. 909-915, 1999.
[40] A. A. Kaminskii, V. G. Ralchenko, and V. I. Konov, "Observation of stimulated Raman scattering in CVD-diamond," JETP Letters, vol. 80, pp. 267-270, 2004.
[41] A. A. Kaminskii, V. G. Ralchenko, and V. I. Konov, "CVD-diamond - a novel χ3-nonlinear active crystalline material for SRS
generation in very wide spectral range," Laser Physics Letters, vol. 3, pp. 171-177, 2006.