Rochester Institute of Technology
RIT Scholar Works
Theses Thesis/Dissertation Collections
7-28-2010
Optimization of the purification and processing of
carbon nanotubes for strong, conductive and
lightweight wires
Brian Moses
Follow this and additional works at:http://scholarworks.rit.edu/theses
This Thesis is brought to you for free and open access by the Thesis/Dissertation Collections at RIT Scholar Works. It has been accepted for inclusion in Theses by an authorized administrator of RIT Scholar Works. For more information, please [email protected].
Recommended Citation
Optimization of the Purification and Processing of Carbon
Nanotubes for Strong, Conductive and Lightweight Wires
By
Brian T. Moses
A THESIS
Submitted in partial fulfillment of the requirements for the degree of Masters of Science
in
Mechanical Engineering of the College of Engineering
at the
Rochester Institute of Technology
Optimization of the Purification and Processing of Carbon
Nanotubes for Strong, Conductive and Lightweight Wires
By
Brian T. Moses
We, the undersigned members of the Faculty of the Rochester Institute of Technology, certify that we have advised and/or supervised the candidate on the work described in
this dissertation. We further certify that we have reviewed the dissertation manuscript and approve it in partial fulfillment of the requirements of the degree of Masters of
Science in Mechanical Engineering.
Approved by:
Dr. Ryne P. Raffaelle Dr. Robert Stevens Dr. Steven Weinstein
iii
Abstract
Single walled carbon nanotubes are produced using standard synthesis and purification techniques. Bulk materials produced using filtration drying are
characterized mechanically and electrically for engineering properties. Modifications to the purification process are explored with consideration given for the effects on
electrical conductivity and mechanical strength. Raman spectroscopy, thermal
oxidation profiling, and high-temperature vacuum annealing are used to gain further insight on the connection between defects and nanotube oxidation during the
purification process. It is observed that the mechanical properties are strongly
temperature dependent, while electrical conductivity varies with humidity rather than temperature. The use of a thermal vacuum anneal can improve separation of oxidative processes between nanotubes and carbon in the time domain, allowing further
iv
Acknowledgements
I would like to thank the National Reconnisance Office for their financial
v
Contents
Abstract……….… iii
[image:6.612.71.517.94.554.2]Acknowledgements……… iv
Figure List………...……… vi
Chapter 1: Background……… 1
Chapter 2: Literature and Theory………..…… 3
Chapter 3: Characterization Techniques and Equipment……… 5
Chapter 4: Description of Research Problem………..… 11
Chapter 5: Production of Carbon Nanotubes……….… 14
Chapter 6: Characterization……… 15
Chapter 7: Processing Modification Section 1 -Thermal Oxidation………..……… 18
Section 2: Nanostructured Carbon……….……… 22
Section 3: Vacuum Anneal……… 27
Section 4: Analysis of thermal oxidation……… 30
Chapter 8: Environmental Effects Section 1: In Situ Humidity Effects……….…… 32
Section 2: Strain hardening, Flexure, Crush………..…… 35
Chapter 9: Discussion………..……… 39
Chapter 10: Conclusion……… 41
References………..……… 43
Appendix 1: Technology Demonstrations………..…… 46
vi
Figure List
Figure 1 Optical absobtion peak ratio reflects purity. From [12] ... 3
Figure 2 Conductivity of CNTs in Literature [4,8,37-57] ... 4
Figure 3 Conductivity Measurement ... 5
Figure 4 TA Q800 Dynamic Mechanical Analyzer ... 8
Figure 5 YAG Laser vaporization CNT synthesis ... 14
Figure 6 Tensile tests of Reflux material at varied temperature ... 15
Figure 7: (Left) Tensile tests of CNT Materials (Right) Specific Tensile Strenght of Materials ... 16
Figure 8 Conducitvity of synthesized CNT Material ... 17
Figure 9: Purification Efficiency. From [1] ... 18
Figure 10 Conductivity of purified nanotubes using different oxidation recipes ... 18
Figure 11: TGA Thermogram of SWCNT reflux material ... 19
Figure 12 Isothermal Mass loss ... 19
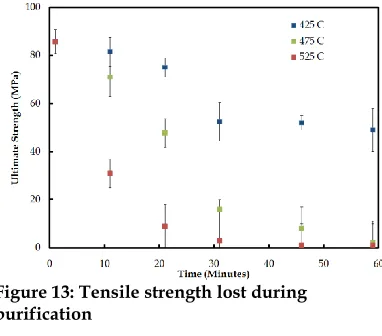
Figure 13: Tensile strength lost during purification ... 20
Figure 14 Conductivity loss during oxidative purification ... 21
Figure 15: Addition of Nanostructured Carbon reduces Conductivity and tensile Strength ... 24
Figure 16: (Left) SEM Image of nylon CNT composite (Right) Nylon DMA solution penetrates CNT papers; solvent removes loosely-bound carbon ... 25
Figure 17: Tensile test of reflux CNT ribbon, before and after nylon treatment ... 26
Figure 18: Thermogram of annealed SWCNT at various ramp rates ... 27
Figure 19: Vacuum Annealing Chamber ... 27
Figure 21 (Left) D/G ratio of post-annel oxidation recipes (Right) Spectra for 475° C samples . 28 Figure 20 SEM of Annealed CNT Material ... 28
Figure 22: Tensile strength of CNT papers after isothermal oxidation ... 29
Figure 23 Comparison of isothermal TGA; Annealed vs Refulux SWCNT Ribbons. ... 30
Figure 24 Logarithmic Derivatives, Annealed Material ... 31
Figure 25: (Left) Comparison of 450° C Isotherm, Reflux vs Annealed. (Right) Curve-Fitting to TGA derivatives ... 31
Figure 26: ESPEC Environmental Chamber ... 32
Figure 27: Anealing is shown to change the temperature dependence of CNT conductivity ... 32
Figure 28: Humidity and Thermal Cycling of CNT Wires ... 33
Figure 29: Decreasing resistance with pressure ... 35
Figure 30 CNT Ribbon, before and after 1 GPA axial pressure ... 36
Figure 31: (Left) Electrical performance under bending (Right) Stiffness cyclic bending. (Below) Experimental Setup ... 37
Figure 32 Strain Hardening of SWCNT Ribbons ... 38
Figure 33: SEM Image of pre-stressed CNT Paper ... 38
Figure 34: AFM Analysis of Pirahna Oxidation; Courtesy of Dr. Brian Landi ... 39
Figure 35: Conductivity and Pirahna exposure ... 39
vii Figure 37 (Left) Contact Resistance of CNTs on Metal (Right) Contact resistance measurement
setup ... 46
Figure 38 (Left) Coaxial cable with CNT center. (Right) Commercial SMA, CNT Center SMA , and CNT Shielded SMA cables. ... 46
Figure 39 (Above) CNT Ethernet Cable (Below) CNT ribbon bonded to photovoltaic ... 47
Figure 40 DC Conductivity Measurement Station ... 47
Figure 41 Van der Pauw Sample ... 47
1
Chapter 1 : Introduction & Background
Electrical wiring is vital to the function of all modern equipment, from telephones and calculators to state-of-the-art military satellites. Replacing copper with a suitable replacement that is lighter and less expensive has great potential. However, the role of metal conductors is not an easy one to fill with carbon because of the vast difference in charge carrier concentrations.
When carbon vapor is grown into a carbon nanotube, properties unique to this nanostructure arise; particularly remarkable is that the mobility of electrons within a nanotube becomes nearly infinite. While the properties of individual carbon nanotubes have been well studied experimentally and theoretically[2-4], the properties that arise when many nanotubes form a bulk solid are not as well understood, and further analysis into the effects of the microstructure would provide great insight into the use of these materials for electrical applications. The complexity of this analysis is stunning; not only are there billions of separate conductors with varying length and radii, but there are a number of possible nanostructures depending on the chirality tube growth. The chiral distribution gives rise to different functional band structure, different to the point that while some nanotubes are considered metallic, others can be classified as semiconductors, all of which interact to form a bulk material[5]. Understanding how carbon nanotubes (CNT) interact is an important step to incorporating the properties of individual nanotubes into a bulk material for replacement of copper and aluminum conductors.
2
replacement for power transmission, where resistive losses are high. However, for data, shielding, and low-current applications replacement of metal conductors is already attractive. Better understanding nanotube synthesis and purification is vital to improving the engineering properties of these bulk materials.
3
Chapter 2: Literature and Theory
Purity assessment and thermal oxidation
Before any serious study in nano-particles can be performed, it is of utmost importance to characterize the physical makeup of material being studied. The basic process to go from graphite to carbon nanotubes generally involves the condensation of carbon vapor in the correct conditions, either using laser ablation, chemical vapor deposition, or high pressure CO feedstock
[9-11]. Purity assessment is done using both thermogravimetric analysis as well as the UV/Vis absorption spectra[12]. Through a constructed sample set using nanotube and non-nanotube carbon, it was observed that the ratio of absorption peaks change as well (Figure 1). This absorption spectra technique allows differentiation between the nanostructured carbon and the SWCNT’s, while high temperature TGA (up to 1000C) allows one to verify the levels of catalyst and graphite – these materials make up the residual[1]. Analysis using this methodology allows straightforward purity level measurements. This process is valuable to the work presented here, where the purification process is optimized for physical properties in contrast to high purity. Tube synthesis
Much research found in literature focus on chemical vapor deposition produced carbon nanotubes. This is a high volume production method[13], however, the quality of nanotubes grown in such fashion leaves much to be desired. Much of this work focuses on material produced using graphite/catalyst laser ablation synthesis[14], specifically using the Nanopower Research Lab’s (NPRL) Nd-Yag laser, three-zone furnace and standard process parameters described in Part 2. In addition to the material synthesized, some characterization is also done on sheets of SWCNT material commercially produced.
4
Theory behind CNT conductivity
A great deal of work has been performed by others attempting to understand how a bulk of SWCNTs conducts electricity through the matrix[15]. Current theory suggests that a pristine nanotube acts as a ballistic conductor, with the electrons tunneling from one tube to another as necessary to complete the circuit[2, 16]. This tunneling, with a significantly longer time constant, provides the bulk of any resistance measured. Additionally, defect sites located on the sidewall slow the transfer of electrons through a nanotube, resulting in a variable through-tube resistance; however defects also provide additional exit points for an electron. The length and micro scale alignment of the nanotubes determines the number of hops necessary, while the chirality, and separation distance of any two nanotubes can modify the hopping resistance[5]. Finally, the ambient environment can interact with the tube-tube interactions, allowing chemical dopants to successfully modify the conductivity[17].
[image:12.612.91.541.225.445.2]A thorough literature search for bulk ribbons consisting of single-walled carbon nanotubes highlights the variability in conductance- values range over 2 orders of magnitude. The results of this search are shown in Figure 2. Much of the successful conductivity research focuses on chemical doping, and the NPRL in particular has had great success with gold bromide, resulting in nanotube wires with conductivity of 2x10⁶ S/m.
5
Chapter 3: Characterization Techniques
Raman Spectroscopy
Raman spectra are primarily used in this work for the ability to measure the D and G band signal resonance strength. Application of the technique to CNTs was pioneered by M. Dresselhaus, and has been shown to be extraordinarily effective at detecting diameter changes and defects in SWCNT materials[18, 19]. This technique gives the crystalline structure an energy input using a laser – in this case one tuned to 632 nm. The detected spectrum shows not only the reflected laser, but signals at other wavelengths. These peaks result when the natural vibration frequencies of the crystal efficiently absorb energy from the laser, leaving the reflected signal with less energy than the incoming one. Non pristine “defective” nanotubes absorb energy in a band around 0.164 eV. A JY-Horiba Raman with automated baseline correction is used for all spectra shown. D/G ratio is calculated through normalizing the integrated intensity of the G band and then measuring the integral of the D band signal.
Raman is an optical technique, and slight variations in the focus can allow the spectrometer to “penetrate” to varying depths. In all cases, the measurements were taken with the focus set for maximum intensity on the G-band signal using a ½ second exposure, followed by a full spectrum taken with a 15 second exposure. As the spot size of the laser is small compared to the sample size, two spectra are taken at random positions per sample. Only if both overlay well is the sample used in the data set.
Conductivity
[image:13.612.388.536.555.689.2]Precise measurement of the electrical conductivity for a SWCNT ribbon sample is difficult – the measureable voltage drop is of the same order as metal wire, however standard samples are no larger than circular 12.5 mm punch. At these sizes, voltage
6
drop is on the order of microvolts, and it is desirable that the error in measurement be less than 5%. National Instruments digital multimeter and source/measure hardware is available for use, and sufficiently sensitive. Four point measurements are used to eliminate contact resistance from voltage measurements[20] – by using voltage-sense probes held at constant, zero current, the voltage can be measured probed without any worry of a voltage drop between the probe and the sample. The Van der Pauw method [21]shall be used for the determination of sheet resistances, combined with a thickness measurement to back out bulk conductivity. A dedicated punch shall be used to ensure that samples are of similar geometry, even though the method is supposed to be independent of geometric factors. This method of measurement involves reconfiguration of probe leads for each test as well as finding an iterative solution to the transcendental equation , making measurement of numerous samples a tedious and time consuming task[21, 22]. Additionally, the large degree of manual involvement in these measurements implies a reduction in precision and repeatability. A full electrical conductivity characterization solution is developed, including LabVIEW software integrated with a switching matrix, high resolution volt meter, and digital source unit, to perform these tasks in a consistent and reliable manner. Probes (shown in Figure 3) are placed around the periphery of a sample, current is passed through two sets of adjacent probes, and the voltage drop measured between the other two probes. The configuration of probes is shifted clockwise three times, giving four rounds of measurement and two different polarities. These IV sweeps are used to calculate four sheet resistances, the average of which is taken to be the sheet resistance of the sample. If differential between any two sets of IV sweeps is greater than 5 times the smallest sheet resistance, a flag is set informing the user to check their contact.
Error Analysis
7
measured in a stable manner at 35.8 * 106 S/m, within 5% of the CRC handbook
value of 37.6*106 S/m. When measuring nanotube papers, the most egregious
8 Tensile Strength
This work will include a pilot study in order to determine effective testing parameters that shall be used as a standard for all further mechanical testing. The bulk of this work shall be performed using NPRL’s Q-800 (Figure 4), a tensile test device purchased from TA Instruments with a maximum travel of 24 mm, maximum applied force of 18 N, and a resolution of .001 N in force and 1 micron in length measurement.
While reflux-type nanotube ribbons have tensile strength on the order of 100 MPa, low density/high purity samples are known to have tensile strengths an order of magnitude less than this, where the high resolution is of great importance.
Figure 4 TA Q800 Dynamic Mechanical Analyzer
Additionally, this level of sensitivity allows the use of the device in alternate configurations, such as nanotube ribbons in bending. Should additional testing of samples requiring greater than 18 N of force be necessary, a larger Instron tensile tester is available from RIT’s Mechanical Engineering department. This device has a 110 N load cell, however the data carries significant noise and there is a great deal less control of testing parameters.
9 Error Analysis
As the Q800 generates a stress strain curve with a length resolution of 0.1 µm with a minimum sample length of 4.5 mm, the error in strain is negligible for purposes of these experiments. The stress measurement, however, is derived from a number of measurements, namely the thickness, width, and force. Error in thickness using the micrometer is limited to the tool’s published accuracy of 3 µm, as well as thickness variations along the filtered paper. To minimize this error, each 8mm x 3mm tensile test strip has the thickness measured at 3 points along its length, and the smallest of these is used, as this is where stress will be highest during the test. A standard paper thickness is ~ 50 µm, giving an estimated error in thickness of 6%. Similar limits of error can be applied to the width, however, this is always at least 3 mm, and as such the error in width is limited to less than 0.5%. The force measurement, accurate to .05 N, results in an error in stress of ~ .4 Mpa. While the magnitude of this force-induced error is large compared to small measurements that are possible, measurements that fall under the 2 Mpa threshold shall be assumed as “zero” for the purpose of this study. Measurements of interest fall in the 20+ Mpa range, and the error here is limited to the 6% from thickness.
Thickness measurement
10
center of a paper requires measuring a cut edge, and the method of cutting can influence the measurement.
11
Chapter 4: Description of Research Problem
12
point, and characterization of this interface is also of importance for application of the technology[24].
Critical Parameters
It is important to identify critical parameters which control the properties of SWCNT materials. While literature has identified a number of properties which should affect the SWCNT conductivity and strength[6, 25], in this work the critical parameters shall be identified as density, impurity content, defect density and nanotube length. Thermal oxidation affects all of these parameters, and shall be studied in depth. Other processes that single out these parameters include filtration pressure (density, impurity content), sonication (length), vacuum annealing (defects) and addition of nanostructured carbon (impurity content). Additionally, experiments shall be performed to determine any temporary or permanent environmental effects of temperature and humidity on the conductivity of SWCNT papers
Proposed Solution
13
14
Chapter 5: Production of Carbon Nanotubes
All SWCNT material was produced using a laser vaporization technique. A target of graphite powder with 3% mass fraction of 2 µm nickel catalyst particles is prepared via 48 hours of mechanical mixing and subsequently pressed into a 1.125” puck placed in an 1150° C tube furnace under a 200 sccm flow of Argon at atmospheric pressure. A Nd:YAG laser at 1064 nm is rastered over the target and fired with a 10 Hz pulse rate; the resulting vapor condenses as SWCNTs on the tube walls. An overview of the laser optics train is shown (Figure 5). This material, as produced, contains large quantities of carbon impurities in addition to the nanotubes and metal catalyst particles. A standard procedure used to purify the soot is an acid reflux, where the soot is boiled in a 4:1:25 solution of 16M HNO3, 12M HCL, and deionized H2O. This reflux is
performed for 15 hours, after which the solution is removed using a 2 µm teflon filter, forming a paper of carbonaceous material. Filtration is followed by 6 alternating rinses of DI H2O and Acetone, which further dissolves free carbon and
reacts with leftover acids. The final product has approximately 2% metal oxide residue from the catalyst and 30% non-nanotube carbonaceous impurities. 60 psi air is used to press the paper onto the filter and evaporate any remaining acetone or water. The resulting papers from this process are considered the baseline material for the work presented – these initial steps of material production are not altered.
15
Chapter 6: Characterization of CNT Papers Characterization of Mechanical Properties
The tensile strength of standard recipe SWCNT ribbons will be measured as a function of temperature. Baseline tensile strength characterization data shall be collected for synthesized nanotube material. NPRL – produced SWNT ribbons were subject to mechanical characterization, before and after acid reflux treatment. The non-reflux ribbons were purified to > 90% via a thermal oxidation treatment, while the reflux papers were produced using nanometal catalyst that provides >95% purity without the need for thermal oxidation. Both are formed to ribbons using vacuum filtration, and the final thickness of the paper is determined. In-house mechanical testing is performed using a TA Instruments Q800 Dynamic Mechanical Analyzer (DMA).
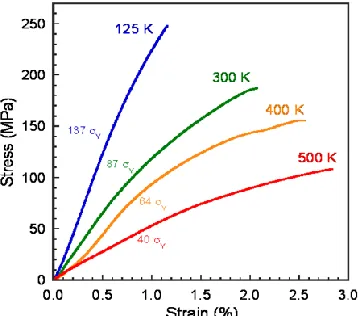
The tensile strength of reflux SWCNT ribbons is seen to have some dependence on both strain rate and temperature. At room temperature, the breaking strength was 180 MPa at 1.7% and at high temperatures the strength was 108 MPa at nearly 3% elongation. Data is shown in Figure 6. Tests were performed at a 15 Mpa / minute strain rate for consistency, though the dynamics of the
nanoscale effects of strain rate on the strength of a mat of tubes is interesting. Other CNT material, purchased commercially, was also measured using the same procedure (Figure 7).
[image:23.612.357.536.346.504.2]SWCNT papers show interesting properties when exposed to cyclic thermal loads under constant stress. The paper is mounted in the DMA fixture as per the tensile test procedures, however, the stress is ramped to a constant level of 7 Mpa and the position of the clamp monitored while the temperature is cycled. Cooling is
16
accomplished by expanding LN2 in the test chamber, and heating via electric heating grids.
Of particular interest is the tests performed following thermal cycling – notably that the ribbons gain room-temperature strength following the treatment. The ribbons tested were cycled 5 times from 175 K to 575 K. All cases of thermally-cycled material show increases in strength, ranging from 10-30 percent over un-cycled material.
In general, SWCNT materials are observed to be somewhat variable in tensile strength – it appears that the manual filtration step lacks consistency needed for accurate characterization. An average reflux paper has a strength of 60-80 Mpa, however numerous exceptional specimins prepared in the same manner exhibit strength twice this range. Additionally, the NPRL produced material lacks the ductility of Nanocomp material, causing misaligned stresses to be concentrated and causing early failure. In comparison to metals the strength to weight ratio of nanotube papers is excellent and should not pose a limitation in the usage of SWCNTs as aerospace conductors.
17
Electrical Conductivity Data
Using methods described above, various nanotube materials are characterized for their electrical conductivity. Standard-preparation ribbons made from reflux material show a conductivity of 2 x 10⁵ S/m, while after purification this drops by a
factor of four, to 5 x 10⁴ S/m. High-temperature vacuum anneals are observed not to
provide any significant change in conductivity, but further processing with organic solvents such as hexane and xylene further reduce the conductivity by 2-3 fold. Commercial material was acquired from Nanocomp, and the conductivity of this material was measured at 2.8 x 10⁴. Additional material from NanoIntegris was
acquired and formed into papers, with a recorded conductivity of 2.3 x 10⁴ S/m for
the metallic 99.9% type-pure nanotubes, and 1.8 x 10⁴ S/m for
the semiconducting (Figure 8). In contrast, ongoing work at the Nanopower Research Labs for conductivity enhancement through chemical additives has recorded 2 x 10⁶ S/m using a
gold bromide dopant. The nitric acid used in an acid reflux provides a doping effect; the application of organic solvents brings about a reduction in conductivity as the organic solvents react strongly with the acid, preventing it from performing as a dopant.
18
Chapter 7: Processing Modification
During nanotube synthesis, the production of nanotubes is accompanied by the growth of NC as well as amorphous carbon
coatings around the nanotubes[27]. Thermal oxidation removes both kinds of carbon, leaving primarily nanotubes. This does not preclude the nanotubes from oxidizing, and evidence suggests that a standard oxidation removes at least 30% of the CNTs. However the addition of NC does not restore the electrical conductivity and mechanical
strength that is lost during oxidation. This suggests that the carbon coatings found on nanotubes after laser synthesis contribute positively to both the mechanical and electrical properties. By varying processing parameters that affect the coatings, perhaps this can be proven.
Section 1 -Thermal Oxidation
Proposed Work
Baseline testing from Phase 1 shows that fully purified SWCNT material has inferior engineering properties to pre-oxidation reflux material; however the thermal oxidation is a necessary step to guarantee material consistency, remove any constituent amorphous and nanostructured carbons, and drive out excessive oxidizers that remain in
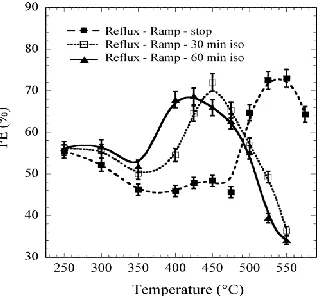
[image:26.612.377.537.129.277.2]the paper. It is proposed that a partial purification is necessary to optimize the properties of a SWCNT ribbon for conductive wire applications. It is possible to produce purified nanotubes using a variety of thermal oxidation recipes(Figure 9) [1]. The oxidation attributes of forms of carbon that occur in SWCNT vary and a Figure 9: Purification Efficiency. From [1]
[image:26.612.355.536.421.558.2]19
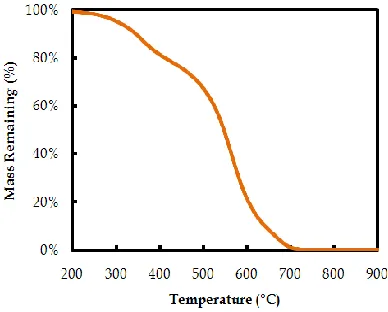
TGA curve for NPRL reflux paper can be decomposed into constituents, including nanotubes, graphite, and NC (Figure 11). It is expected that the oxidation rates for these constituents do not vary equally with temperature. Figure 10 shows that reflux material subject to the three different purification efficiency peaks have quite different conductivity. Of particular importance are the numerous shortening mechanisms dependent on oxidation, which have a strong dependence on temperature[28, 29]. While length of individual tubes of a bulk sample cannot be accurately measured, the bulk properties can be, potentially differentiating oxidation schemes that preserve CNT length in comparison to schemes that shorten the nanotubes. If bulk properties respond as described in theory, optimization of the thermal oxidation step for minimal tube cutting will be important in the production of strong, conductive CNT material. It is proposed that samples of NPRL reflux material shall be burned in air at different temperatures, with samples removed from the furnace at different oxidation times. The tensile strength
[image:27.612.95.289.82.238.2]and electrical conductivity of these samples shall be measured, and further studies will be performed to generate data at points deemed of interest. Additionally, ramp-stop and ramp-isotherm data at a number of temperatures shall be taken using the TA Instruments Q5000 TGA for reflux and nanostructured carbon samples. Figure 11: TGA Thermogram of SWCNT reflux material
20 Details
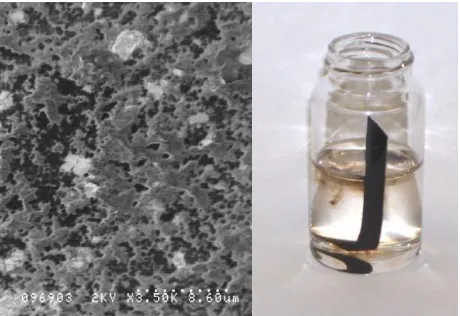
The purpose of this study is to estimate the magnitude of structural damage caused by standard SWCNT purification. Carbon nanotubes were produced using established laser-ablation techniques according to reported procedure with a pulsed Nd-YAG laser in a nitrogen atmosphere, followed by a 15 hour Nitric /HCl acid reflux to remove metal catalyst particles [8,9]. The resulting dispersion was filtered through and dried onto a 2 μm Teflon filter paper, resulting in a paper of ~ 30 μm thickness consisting of both nanostructured (NC) carbon and SWCNTs. Thermal oxidation is the standard method for removing the amorphous carbon from this material [7, 10], figure 5 shows the mass loss as a function of time. SWCNT paper was divided into 5 mm squares for this experiment. Each square was subject to isothermal TGA analysis, during which the mass-loss as a function of time is recorded. Each temperature is repeated twice. Figure 12 displays the mass loss as a function of time at various isothermal oxidation temperatures. The most notable feature of thee curves is that they generally contain two slopes, an initial fast-burn followed by a slower oxidation, At all
temperatures, the material ends up with 3-4% residual mass, though the figure is truncated at 60 minutes for clarity. The tensile strength and electrical conductivity of the material is measured at select points along this curve, representing a specific thermal oxidation treatment.
[image:28.612.346.537.416.584.2]It has been observed that the thermal oxidation of amorphous carbon impurities at temperatures below the combustion point of carbon nanotubes has an oxidative effect on the nanotubes which is not accompanied by significant mass loss when observed using thermo gravimetric analysis. However, CNT papers held at these elevated temperatures in air display significant reductions in mechanical and
21
electrical properties, as shown in Figure 13 and Figure 14. It is possible that the
nanotubes are undergoing shortening of some sort; however there is no technology able to quantify length with good statistical error available. AFM measurements are possible, though difficult, requiring relatively pure nanotubes. Observation of nanotube length in raw soot or acid refluxed CNT materials is unreliable; meanwhile statistics would require many more samples than possible.
SWCNT reflux papers were submitted to thermal oxidation in air for extended periods of time. The materials show a loss of mechanical strength, occuring most rapidly in the first hour of oxidation, while changes in strength after three hours of oxidation are nearly zero. It was observed that ribbons oxidized at both 450°C and 525°C reached a final strength of < 3% of original, while those oxidized at 375°C maintained 25% of original tensile strength after 3 hours. From these results, oxidation at temperatures ranging from 390 to 475°C for a duration less than one hour were identified to be of particular interest, as this is where the rate of change for paper tensile strength was greatest. During the first hour of oxidation at these temperatures, samples held at 425°C and below were observed to lose approximately 25% of orignal strength, while the sample burned at 475°C experienced a strength reduction of 95%. Of particular interest is that at 425°C, there is a significant mass loss after one hour when compared to the 390°C oxidation, yet strength remains similar. The conductivity remains longer than the tensile strength, though the remaining material is hardly cohesive and requires extreme care to measure.
22
Amorphous and nanostructured carbons are theorized to oxidize more quickly than pristine carbon nanotubes; however the presence of defects makes this somewhat ambiguous. The results suggest that either some fraction of non-nanotube carbon improves the physical strength of a SWCNT ribbon, or the oxidation is destroying nanotubes as well as impurities. As shown in literature, a coating of NC forms on the nanotubes during synthesis in addition to free carbon in the ribbon. The optimal thermal oxidation would remove discrete carbon, while leaving both nanotubes and NC coatings intact, preserving strength while removing unnecessary weight from the material. Of particular interest is that after 45 minutes at 425°C, the strength to weight ratio increased by approximately 10% of baseline.
Section 2: Nanostructured Carbon
Proposed Work
23
removed from a SWCNT paper, a marked reduction in mechanical strength is observed.
Mechanical testing of purity-controlled CNT reflux ribbons showed that nanometal ribbons with their amorphous carbon content reduced through thermal oxidation exhibit more strength when that carbon is not artificially replaced during processing. However, the greatest mechanical strength is observed when the as produced nanotube material is not subject to any oxidation following the acid-reflux.
This experiment shall involve NPRL reflux paper thermally oxidized to a purity of at least 95% and a sufficient quantity of nanostructured carbon. A constructed sample set will be produced where the NC is added to purified material. Sample purity verification via UV-Vis will be performed in addition to tensile strength and electrical conductivity. TEM and SEM microscopy could be used to show that the carbon is not conformal to SWCNT bundles but rather in large clumps.
Details/Results
24
Another result of the thermal oxidation is that nanostructured carbon is removed from the bulk CNT matrix. As the thermal oxidation purification is accompanied by a loss of mechanical strength and electrical conductivity, the possibility that the carbons within the matrix provide a strong bond was investigated. Nanostructured carbon was produced in the NPRL laser ablation reactors, making sure to prevent
nanotube growth by omission of the catalyst. This additional carbon was added to the acid-reflux CNT slurry, dispersed in acetone and allowed to stir for 3 days before vacuum filtration. The resulting papers were seen to have reduced mechanical and electrical properties, while still forming a cohesive CNT paper (Figure 15). This provides contrast with an “as produced” paper, which generally do not form a cohesive mass with measurable tensile strength.
[image:32.612.93.539.195.362.2]Even after dilution of the nanotubes 3:1 by weight, the papers retained approximately 50% of their tensile strength and electrical conductivity. The reduction appears to be linear with the addition of more carbon; however, there is a breaking point around 35% purity where the formation of a cohesive paper is rare due to the amount of carbon soot.
25 Nylon-SWCNT Paper Composite Materials
Polymers have been shown to coat and bond nanotubes to one another[30]. Addition of a polyamide was accomplished through the use of polymers soluble in solvent that also penetrate SWCNT mats with the goal of increasing mechanical strength[31, 32]. Specifically, the solution used for this process contained Scientific Polymer Products Nylon 6-3 [poly
(trimethyl hexamethylene terephthalamide)] dissolved in dimethylacetamide (DMA) at a concentration of 25 mg / ml; an ultrasonic bath maintained at 60°C was used to aid in dissolution. The nanotube material for this experiment was an acid-reflux SWCNT paper. The paper was fully submersed in the nylon-DMA solution for 5 seconds and dried at 120°C in air. Figure 16 shows that the adherant nylon coats the nanotubes as well as bridging small voids between nanotubes.
SWCNT ribbons briefly exposed to the nylon-DMA solution showed a significant (48%) increase in tensile strength, as well as fourfold increase in the elongation before break, while the elastic modulus fell to approximately half, from 3.6 to 1.5 Gpa (Figure 17). The composite material also showed a qualitative improvement in toughness, being significantly more resistant to puncture and tear than the original SWCNT ribbon. The mass increase after 4 hours of drying at 120°C was 14%, and the thickness of the ribbon increased from 71 to 84 microns.
[image:33.612.312.542.125.283.2]26
The change in thickness is primarily due to swelling of the ribbon from intercalated nylon. After accounting for the changes in tensile strength, mass, and thickness, the strength-to-weight ratio of the composite increased by 51%. Just as removing carbon
[image:34.612.93.350.84.263.2]impurities from void spaces between nanotubes causes a reduction in tensile strength, permeating these voids with nylon appears to provide additional nanotube-nanotube or bundle-bundle bonding at the nanoscale, which improves the macroscopic mechanical properties of the ribbon as a whole. Of considerable interest is that the tensile strength of bulk Nylon 6-3 in is 90 MPa, while the original acid-reflux SWCNT ribbon had a tensile strength of 78 MPa; the resulting composite has a tensile strength greater than either constituent material.
27
Section 3: Vacuum Anneal
Proposed Work
As ribbons straight out of the reflux process are quite acid-heavy, they are reactive and not suitable for application without some sort of stabilization processing. One solution is the thermal oxidation, where high temperatures drive a majority of the acid from the SWCNT paper. However, should oxidation of the paper prove detrimental to improving the bulk properties, high temperature exposure in vacuum or inert gas may provide a method to drive out the acids without damaging the SWCNTs or causing graphitic transitions[33, 34]. Additionally, the annealing process has been shown to heal certain types of defects in a nanotube[35]. It is proposed that a sufficient anneal for these purposes will be 1 hour at a temperature determined through experiment. SWCNT papers subject to the annealing study shall have the mechanical and electrical properties measured post anneal before being subject to numerous
thermal oxidation processes. It is expected that the vacuum anneal will provide the nanotubes a greater degree of resiliency to the thermal oxidation, and a harsher oxidation can be performed without significant degradation to the SWCNT properties. The challenge will be to settle
[image:35.612.95.309.239.369.2]on an appropriate annealing time and temperature that prevents graphitic transitions from occurring, as there are currently no straightforward techniques for the removal of graphite from nanotubes.
Figure 19: Vacuum Annealing Chamber
[image:35.612.342.539.472.596.2]28 Details/Results
Post-anneal SEM imaging (Figure 20) shows that the anneal seems consolidate amorphous carbon into a form that appears similar to graphite, which was one major concern when beginning this work. However, as the thermogram of annealed SWCNT material shows complete combustion at temperatures as low as 525 C (Figure 18), the possibility of any graphitic transitions is negligible. An interesting trait that differ from otherwise equivalent CNT material is the lack of two separate
derivative peaks; there is only one broad peak, the position of which is highly ramp-rate dependent. In general the ramp-rate of oxidation is significantly less than non
annealed material.
Given the importance of defects on the rate of thermal oxidation as seen when comparing TGA data to the D/G ratio (Figure 21), there is potential for vacuum annealing to stabilize the CNT paper and remove these defects without harming the paper.
Figure 21 (Left) D/G ratio of post-anneal oxidation recipes (Right) Spectra for 475° C samples
The anneal was performed in 50° C increments from 700 to 900 °C. While the first 3 samples each show a reduced D band from the lower temperature, spectra for the
[image:36.612.402.536.101.272.2]29
800-900 °C anneals overlay without distinction. As the elevated temperatures may have other unexpected side effects, the lower bound which still promotes maximum D/G ratio reduction
Raman characterization shows that, like other CNT material, the D/G ratio decreases with oxidation time, with oxidation rate correlated to but trailing the D band intensity.
Annealed material holds mechanical strength and conductivity better than reflux through the thermal oxidation process (Figure 22), though there is some embrittlement imparted during the annealing process itself that causes poor initial performance. This embrittlement would make a vacuum-annealed reflux paper unsuitable for direct usage; however the process is of great interest going further as an intermediate step in the purification process. The excellent oxidation resistance of annealed nanotubes implies that the tubes are not being oxidized to the same degree as tubes in a standard reflux paper. Electrically, a HT annealed paper is unchanged from a vacuum-dried reflux paper.
30
Section 4: Analysis of thermal oxidation
One primary goal of this work is to develop an alternate thermal oxidation scheme based around the inclusion of the vacuum anneal. A useful metric for this endeavor is the logarithmic derivative, a relatively simple transform which allows one to convert the derivative of a “Percent remaining” TGA curve and solve for the true oxidation rate in % per minute, adjusting for the amount of mass remaining. To do this, one would plot rather than simply . Elementary calculus
shows that , thus accomplishing the goal by taking the natural
logarithim of the percent remaining before taking the derivative. A downside of this method is clearly that when and are both small (near the end of the burn), there will be significant noise. As there are two primary constituent materials, it is expected that the logarithmic derivative plots will be decompose into two peaks – one representative of the nanostructured carbon and one representative of the nanotubes. If the anneal adds oxidation resistance to the nanotubes but not the NC, peak separation will increase after the annealing treatment.
Details
[image:38.612.96.548.95.337.2]Isothermal TGA data comparing annealed and non-annealed SWCNT papers as they are oxidized at temperatures between 425º and 525º C is displayed in Figure 23. Clearly, the time it takes for the paper to completely oxidize has increased significantly. The peaks observed in annealed material (Figure 24) are a result of applying the logarithmic derivative to isothermal TGA. All contain similar Figure 23 Comparison of isothermal TGA; Annealed vs Refulux
31
characteristics; right-skewed peaking functions with the peak heights increasing with temperature. It can also be observed that the degree of right-skew is temperature dependent, with less skew at higher temperatures and more at lower temperatures. The right skew is representative of two separate peaks, a smaller initial oxidation of the non-nanotube carbon followed by the oxidation of CNTs. By using techniques similar to those in (Gupta), the decomposition into sub-peaks is straightforward. An example of this decomposition can be seen in Figure 25, where the combustion peak of the carbon is clearly separated from the nanotubes by approximately 45 minutes in the annealed material, but less than 15 minutes for the non-annealed material. Both isotherms were performed at 450° C. The NC peak shifts to the right and broadens slightly and nanotube peak shifts significantly more, while peak heights do not considerably change.
[image:39.612.97.535.536.679.2]This behavior is representative of a sequential first-order reaction, where an intermediate transition is a prerequisite to mass loss. In this case, it appears that the intermediate product represents the decomposition of a sidewall defect into two nanotube ends[36]. As the total number of ends increase, the rate of mass loss follows; when there are no more defect sites remaining the rate slows down.
Figure 24 Logarithmic Derivatives, Annealed Material
32
Chapter 8: Environmental Effects Section 1: In Situ Humidity Effects
It has been observed that the electrical conductivity of SWCNTs nanotubes have little response to temperature in vacuum. However, in the terrestrial environment, humidity is expected to play a significant role in the conductivity of a SWCNT wire, and when performing temperature-dependent properties in air the humidity level must be monitored.
Using an ESPEC terrestrial environmental chamber (Figure 26), NPRL and Nanocomp wires shall be subject to cyclical changing conditions including constant RH/changing temp, constant dew point, changing temp, constant temp/changing humidity, and changing temp/no humidity. Electrical conductivity shall be monitored using a 4 point method for the duration of these tests. To perform these measurements and control the environmental chamber, custom LABView software will be necessary. The use of a switching matrix will enable the testing of multiple samples at the same time. Both Constant –temperature / varied dew point, and constant dew
point / varied temp shall be examined.
Humidity
[image:40.612.321.534.520.665.2]It is well documented that SWCNT papers are quite hygroscopic, and the presence of moisture in their immediate environment will affect the conductivity. Much of this reactivity is due to defect sites, fundamentally
Figure 27: Anealing is shown to change the temperature dependence of CNT conductivity Figure 26: ESPEC Environmental
33
[image:41.612.104.534.195.398.2]studied in much CNT sensor work. It is expected that humidity reactions are related to D band intensity, as well as the presence of hygroscopic compounds in the bulk (leftover acid from the reflux, for example). A variety of nanotube materials were subject to thermal and humidity variations while the conductivity is monitored using a four-point measurement.
Figure 28: Humidity and Thermal Cycling of CNT Wires
Conditions ranged from <5% RH to 100% RH shall be studied, at temperatures from 5° C to 150° C, while stainless wire was used as a control, primarily for resistance to oxidation. Humidity was monitored using a Wet/dry bulb temperature using the NOAA “complex” form of the dew-point calculation. This option was chosen because of the wide variations in temperature and humidity, placing some of the more extreme points outside the range of the simple method. Clearly, as Figure 27 shows, there is a strong correlation of conductivity with humidity in the short term. Additionally, long term drift was observed for some materials with repeated cycling.
Temperature
34
high temperature measurements were performed with slight modifications to the vacuum annealing chamber for in-situ 4-point measurement.
35
Section 2: Strain hardening, Flexure, Crush
Remarkably, SWCNT materials are shown to work harden yet at the same time have remarkable fatigue resistance. The work hardening properties of NPRL reflux material shall be studied, by first measuring the breaking strength, and subsequently pre-stressing the material to before re-testing the strength and elastic modulus. The plastic/elastic properties of SWCNTs are extremely important for processing, as material capable of withstanding moderate plastic deformation can be handled with traditional metalworking processes such as rolling and drawing. Additionally, SWCNT wires will be subject to high-cycle bend testing, using S.O.A spacecraft harness wiring as a comparison while the previously developed electrical testing scheme for multiple simultaneous four-point measurements will be applied.
Effect of Axial Pressure on Papers
NPRL-produced SWCNT
material shows excellent resiliency to high pressure both mechanically and electrically. Standard acid-reflux purified material was used for the experiment, where conductive ribbons are placed between stainless steel dies with 1.125 inch diameter. A transparent
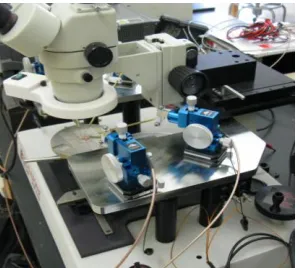
coating of Teflon is used to electrically insulate the nanotube ribbon from the die while hydraulics force the dies together with force varying from 0-100 kN, while electrical conductivity measurements are taken via the 4-point method to eliminate contact resistance from the calculation.
[image:43.612.316.530.341.499.2]Constant current is passed through the CNT ribbon using a Kiethley 2635 SMU. The voltage drop is measured before pressure is applied to the ribbon and modeled as two series resistors consisting of the ribbon not under compression and the ribbon under compression. The change in voltage drop is attributed only the
36
compressed section of ribbon. Figure 29 shows that as pressure is applied, a significant increase in the conductivity of the paper is measured. This effect has been measured previously by Gaal et Forro under hydrostatic pressure[x], with that data displayed for comparison. The SWCNT material did not appear deformed following the tests – Figure 30 shows CNT ribbons before and after the application of pressure.
The modulus of elasticity for this material is 1-2 x 10^7 Pascal, and Poison’s ratio is estimated at 0.1, allowing the calculation of the cross-sectional area as a function of pressure. Thus, the intrinsic property conductivity can be calculated as a function of the reduction in volume for a given mass of CNT paper, however, These results indicate that while densification plays a role in increasing the conductivity
of these materials, alignment of individual and bundles of nanotubes during the densification process not only provides a better conductive pathway, but allows the material to retain in a densified state.
37 Bending
In exploration of the SWCNT wire’s ability to withstand repeated flexure, two experiments were set up. The first involved repeatedly bending the wire using the TA instruments DMA. The force sensors were used to measure the resistance to bending; if this resistance drops suddenly, the wire has suffered some sort of structural failure. This test was performed on space-grade harness wire from TRW and Raychem as well
Figure 31: (Left) Electrical performance under bending (Right) Stiffness cyclic bending. (Below) Experimental Setup
as NPRL ribbons and drawn/densified wires produced from commercially available material. A similar test was also performed with the same setup, monitoring electrical conductivity instead of stiffness. These test (Figure 31) show that while NPRL CNT ribbons are susceptible to tearing,
commercial materials appear to be unaffected. This is likely due to the greater elastic range of commercial material.
Strain Hardening
[image:45.612.93.533.233.384.2]38
possess a higher yield and breaking stress as well as enhanced elongation at break. Additionally, a shift in elastic modulus is observed when a ribbon is pre-stressed. Figure 32 shows some example data of these effects. Electron microscopy (Figure 33) was used to search for evidence of alignment; however the only new features of
[image:46.612.94.537.166.351.2]significance are micron-scale creases, aligned with the direction of pull. Electrical conductivity was unaffected by whatever alignment is induced through the pre-stress process. It is remarkable that CNT papers undergo plastic deformation and work hardening similar to metals, while at the same time show nearly unlimited fatigue life.
[image:46.612.94.225.483.641.2]Figure 32 Strain Hardening of SWCNT Ribbons
39
Chapter 9: Discussion
In the previous section, the critical parameters for SWCNT bulk conductivity were identified as density, impurity content, defect density and nanotube length. The work focuses primarily on improving the production of strong, conductive nanotube materials through study of the thermal oxidation step, with minor forays into composites, addition of extra impurities, and physical reliability measurements.
Defects Caused via acid treatment
It is widely displayed in literature than the use of strong chemical oxidants cut nanotubes, leaving them shorter and broken up. A commonly chosen oxidant is Piranha solution, a
mixture of nitric acid and hydrogen peroxide.
[image:47.612.166.521.225.338.2]It appears that the induction of defects and chemical cutting through the use of acid solutions improves the conductivity of CNT materials when applied for a short time, but when treatment is too severe the conductivity drops again (Figure 35). It is difficult to compare acid-cut tubes to non-cut because of the strong doping effects present; however when exposed papers are compared to a specimen subject to one minute of exposure, the strong acids from the Piranha solution continue to increase conductivity, even though this acid causes significant shortening as demonstrated Figure 35: Conductivity and Pirahna exposure
[image:47.612.93.546.528.683.2]40
both in literature and in the image sequence of Figure 34. Mechanically, acid-cut papers have virtually non-existent tensile strength or cohesion.
Removal of Defects during Oxidation
With the removal of the nanostructured carbons from the SWCNT bulk material, there is a marked reduction in the density, tensile strength and electrical conductivity of the paper. As seen in figures A and B, this reduction occurs in both pressure and vacuum filtration, though the reduction is less pronounced under pressure filtration. As seen in literature, it is known that thermal oxidation of nanotube materials not only oxidizes the amorphous carbons within the material, but also some of the nanotubes themselves. Investigation using Raman spectroscopy of samples subject to thermal oxidation shows a sharp reduction in the D band. It is evident that the rate of mass loss is related to the D/G ratio. D band resonance is generally caused by an imperfection in the axial symmetry of a nanotube, and when a defect is oxidized and a nanotube is cut, the D band response from that defect drops away. Thus, the defects in place following the standardized laser-ablation synthesis and acid-reflux purification are a catalyst for the oxidation of SWCNT carbon during the thermal oxidation.
While theory would suggest that oxidation at elevated temperatures is capable of both breaking up the tube at a defect site and causing new defects, under no observed circumstances did the D band Raman signal increase
[image:48.612.92.539.479.660.2]after thermal oxidation (Figure 36), providing evidence that if the oxidation does cause new defects, the rate is significantly less than the rate of decomposition at defect sites.
41
Chapter 10: Conclusion
The preceding work consisted of two distinct phases: in the first, methods of measurement were developed and evaluated, mechanical and electrical for various commercially available and synthesized nanotubes materials were characterized, and durability concerns such as work hardening, repeat bending, thermal effects, and humidity sensitivity were briefly evaluated. The second phase focused on possible improvements to the material for aerospace wiring harness applications, primarily consisting of an experimental study of purification process modifications. The initial measurements displayed the promise of carbon nanotube materials while building familiarity with the materials and processes involved. It was observed that present day carbon nanotube materials display favorable tensile strength-to-weight ratios when compared with metals. The elastic modulus increases with temperature, while the tensile strength is inversely related. Electrical conductivity of current materials, at 2 x 10⁶ S/m, are approximately an order of magnitude too
low to be of use in a current-carrying conductor, however data and low current applications could see significant weight savings. The electrical conductivity is weakly temperature dependent and quite sensitive to humidity, with the humidity dependence being linked to defect sites on the nanotubes. Also of note is that small changes in the purification process produce large changes in the properties of the nanotubes.
42
effects it has on the thermal oxidation; the insertion of an 800° C, 1 hour anneal prior to the thermal oxidation cuts mass loss rates 3-4 times, clearly imparting a significant degree of oxidation resistance to the nanotubes. Raman spectroscopy was used to measure the D band resonant signal for nanotube materials throughout various stages of oxidation, and it was observed that the strength of this band loosely correlates with the derivative of mass loss, and a vacuum anneal significantly reduces the D band without mass loss. This provides insight that thermal oxidation of defects is the most significant factor in the oxidation of nanotubes – note that the goal of thermal oxidation is to remove non nanotube material, while taking advantage of the nanotubes thermal stability and low surface area to selectively combust carbon byproducts. Attempts to model the combustion of nanotubes as a sequential first-order reaction shows promise, where the intermediate reactant is assumed to be the conversion of defect sites into a new form prior to the actual mass loss.
43
References
1. Landi, B.J., et al., Thermal Oxidation Profiling of Single-Walled Carbon Nanotubes. Chemistry of Materials, 2005. 17(26): p. 6819-6834.
2. Skákalová, V., Electronic transport in carbon nanotubes: From individual nanotubes to thin and thick networks. Physical Review B, 2006. 74(085403).
3. Shiraishi, M., Conduction mechanisms in single-walled carbon nanotubes. Synthetic Metals, 2002. 128(235).
4. Hecht, Conductivity scaling with bundle length and diameter in single walled carbon nanotube networks. Applied Physics Letters, 2006. 89.
5. Kodama, Field-effect modulation of contact resistance between carbon nanotubes. Applied Physics Letters, 2007. 91.
6. Behnam, Effects of nanotube alignment and measurement direction on percolation resistivity in single-walled carbon nanotube films. Journal of Applied Physics, 2007. 102.
7. Liu, Dynamic elastic modulus of single-walled carbon nanotubes in different thermal environments.
Physics Letters A, 2007. 365.
8. Shim, Liu, Highly Dense and Perfectly Aligned Single-Walled Carbon Nanotubes Fabricated by Diamond Wire Drawing Dies. Nano Letters, 2008. 8.
9. Landi, B. and R. Raffaelle, Effects of Carrier Gas Dynamics on Single Wall Carbon Nanotube Chiral Distributions during Laser Vaporization Synthesis. J.Nanosci. Nanotechnol., 2007. 7(883-890). 10. Lei, Selective Growth of Well-Aligned Semiconducting Single-Walled Carbon Nanotubes. Nano
Letters, 2009.
11. Popov., V., Carbon nanotubes: properties and application. Mater. Sci. Eng. R. , 2004. 43: p. 61-102. 12. Landi, B., et al., Purity Assessment of Single-Wall Carbon Nanotubes, Using Optical Absorption
Spectroscopy. J. Phys. Chem. B., 2004. 108: p. 17089-17095.
13. Teo, K.B.K., et al., Uniform patterned growth of carbon nanotubes without surface carbon. Applied Physics Letters, 2003. 79: p. 1534.
14. Schauerman, C., et al., Impact of nanometal catalysts on the laser vaporization synthesis of single wall carbon nanotubes. Carbon, 2009. 47: p. 2431-2435.
15. Honjie, D., Conductivity of Individual Carbon Nanotubes. Science, 1996. 272: p. 532-526.
16. Behnam, Computational study of geometry-dependent resistivity scaling in single-walled carbon nanotube films. Physical Review B, 2007. 75.
17. Lee, R.S., et al., Conductivity enhancement in single-walled carbon nanotube bundles doped with K and Br. Nature, 1997. 388: p. 255-257.
18. Dresselhaus, M.S., G. Dresselhaus, and M. Hofmann, The big picture of Raman scattering in carbon nanotubes. Vibrational Spectroscopy, 2007. 45(2): p. 71-81.
19. Jorio, A., et al., Characterizing carbon nanotube samples with resonance Raman scattering. New J. Phys., 2003. 5: p. 139.
20. Kiethley, Low Level Measurements Handbook. 6th ed. 2004, Cleveland, Ohio.
21. VanDerPauw, L.J., A Method of measuring specific resisitivy and hall effect coefficients of discs of arbitrary shape. Phillips Research Reports, 1958. 13: p. 1-9.
22. VanDerPauw, L.J., A method of measuring the resistivity and Hall coefficient on lamellae of arbitrary shape. Philips Technical Review, 1958. 20: p. 220-224.
23. Lu, X., et al., Scanning electron microscopy study of carbon nanotubes heated at high temperatures in air. Journal of Applied Physics, 1999. 86: p. 186.
24. Liu, Z., et al., Benchmarking of Metal-to-Carbon Nanotube Side Contact Resistance. IEEE Xplore, 2008. 987-1-4244-1911-1.
25. Kaiser, Modelling conduction in carbon nanotube networks with different thickness, chemical treatment and irradiation. Physica E, 2008. 40.
44
27. Cassell, A.M., et al., Large Scale CVD Synthesis of Single-Walled Carbon Nanotubes. The Journal of Physical Chemistry B, 1999. 103(31): p. 6484-6492.
28. Forrest, G.A. and A.J. Alexander, A Model for the Dependence of Carbon Nanotube Length on Acid Oxidation Time. The Journal of Physical Chemistry C, 2007. 111(29): p. 10792-10798.
29. Boul, P.J., et al., Reversible sidewall functionalization of buckytubes. Chemical Physics Letters, 1999. 310(3-4): p. 367-372.
30. Zhang, W., et al., Polymers and Carbon Nanotubes. Macromolecules, 2004. 37: p. 256-259. 31. Gao, J., et al., Nylon Nanotube CompositesT. J. Am. Chem. Soc., 2006. 128: p. 7492-7496.
32. B. Shim, J.Z., K. Critchley and N. Kotov., Carbon Nanotube Composites Am. Chem. Soc. Nano, 2009. 3: p. 1711-1722.
33. Kowalska, E., et al., Influence of high vacuum annealing treatment on some properties of carbon nanotubes. Journal of Thermal Analysis and Calorimetry, 2006. 86: p. 115-119.
34. Kosaka, M., et al., Annealing effect on carbon nanotubes. An ESR study. Chemical Physics Letters, 1995. 233(1-2): p. 47-51.
35. Tsai, J.T.H. and A.A. Tseng, Defect reduction of multi-walled carbon nanotubes by rapid vacuum arc annealing. Journal of Experimental Nanoscience, 2009. 4(1): p. 87 - 93.
36. Bom, D., et al., Thermogravimetric Analysis of the Oxidation of Multiwalled Carbon Nanotubes Evidence for the Role of Defect Sites in Carbon Nanotube Chemistry. Nano Letters, 2002. 2(6): p. 615-619.
37. Bae, Supercapacitors Using Single-Walled Carbon Nanotube Electrodes. Adv. Mater., 2001. 13: p. 497.
38. Beckyarova, Electronic Properties of Single-Walled Carbon Nanotube Networks. J. Am. Chem. Soc., 2005. 127: p. 5990.
39. Gaa´l, R., Pressure dependence of the resistivity of single-wall carbon nanotube ropes. Physical Review B, 2000. 61(11).
40. Geng, Effect of Acid Treatment on Carbon Nanotube-Based Flexible Transparent Conducting Films. J. Am. Chem. Soc., 2007. 129: p. 7758.
41. Gong, The effect of high-temperature annealing on the structure and electrical properties of well-aligned carbon nanotubes. Materials Research Bulletin, 2007. 42: p. 474.
42. Ishii, Resistivity reduction of boron-doped multiwalled carbon nanotubes synthesized from a methanol solution containing boric acid. Applied Physics Letters, 2008. 92: p. 202116.
43. Kaiser, V.S., Electronic transport in carbon nanotubes: From individual nanotubes to thin and thick networks. Physical Review B, 2006. 74(085403).
44. Kang, Micelle-Encapsulated Carbon Nanotubes: A Route to Nanotube Composites. J. Am. Chem. Soc., 2003. 125: p. 5650.
45. Kim, G., et al, Magnetoresistance of an entangled single-wall carbon-nanotube network. Phys. Rev. B, 1998. 58: p. 16064.
46. Petit, Temperature dependent resistivity of single wall carbon nanotubes. Europhys. Letters, 1998. 41: p. 683.
47. Skákalová, V., Effect of Chemical Treatment on Electrical Conductivity, Infrared Absorption, and Raman Spectra of Single-Walled Carbon Nanotubes. Journal of Physical Chemistry B, 2005. 109(15): p. 7174.
48. Skákalová, V., Effect of SOCl2 Treatment on Electrical and Mechanical Properties of Single-Wall Carbon Nanotube Networks. J. Am. Chem. Soc., 2005. 127: p. 5125.
45
50. Skákalová, V., Raman spectroscopy of single-wall carbon nanotubes and graphite. Journal of Applied Physics, 2005. 98: p. 24311.
51. Skákalová, V., Ion irradiation effects on conduction in single-wall carbon nanotube networks.
Applied Physics A, 2008. 90: p. 597.
52. Sreekumar, Single-Wall Carbon Nanotube Films. Chem. Mater., 2003. 15: p. 175.
53. Wei, Electrical transport in pure and boron-doped carbon nanotubes. Applied Physics Letters, 1999. 74.
54. Wei, Fabrication of aluminum–carbon nanotube composites and their electrical properties. Carbon, 1999. 37: p. 855.
55. Whitten, The role of free radical condensates in the production of carbon nanotubes during the hydrocarbon CVD process. Carbon, 2006. 44: p. 1653.
56. Xu, Magnetic barriers in graphene nanoribbons: Theoretical study of transport properties. Physical Review B, 2008. 77.
![Figure 2 Conductivity of CNTs in Literature [4,8,37-57]](https://thumb-us.123doks.com/thumbv2/123dok_us/54598.5013/12.612.91.541.225.445/figure-conductivity-cnts-literature.webp)