Ranking ligand affinity for the DNA minor groove by
experiment and simulation
Kitiyaporn Wittayanarakul,1 Nahoum G. Anthony,1 Witcha Treesuwan,2 Supa Hannongbua,2 Hasan Alniss,1 Abedawn I. Khalaf,3 Colin J. Suckling,3 John A Parkinson,3 and Simon P. Mackay*1
1
Strathclyde Institute of Pharmacy and Biomedical Sciences, University of Strathclyde, 27 Taylor Street, Glasgow G4 0NR, UK
2
Chemistry Department and Center of Nanotechnology, Kasetsart University, Bangkok 10900, Thailand.
3
WestCHEM Department of Pure and Applied Chemistry, University of Strathclyde, 295 Cathedral Street, Glasgow G1 1XL, UK
Abstract: The structural and thermodynamic basis for the strength and selectivity of the interactions of minor-groove binders (MGBs) with DNA is not fully understood. In 2003 we reported the first example of a thiazole containing MGB that bound in a phase shifted pattern that spanned 6 base-pairs rather than the usual 4 (for tricyclic distamycin-like compounds). Since then, using DNA footprinting, nuclear magnetic resonance spectroscopy, isothermal titration calorimetry and molecular dynamics, we have established that the flanking bases around the central 4 being read by the ligand have subtle effects on recognition. We have investigated the effect of these flanking sequences on binding and the reasons for the differences and established a computational method to rank ligand affinity against varying DNA sequences.
By understanding the rules that govern the tight, side-by-side binding of ligands with the DNA minor groove it has become possible to develop tailored approaches to drug design. These developments have precipitated the design of sequence reading molecules with DNA specificities and affinities comparable to DNA-binding proteins and have allowed convincing demonstrations of an ability to interrupt gene expression in vitro.1-2 The development of minor groove binders (MGBs) proceeded from the observation that netropsin and distamycin bound selectively in the DNA minor groove by a combination of hydrogen bonding with the bases on the groove floor allowed by their natural curvature.3-6 A significant breakthrough in the field came with the observation that a number of MGBs could bind in the minor groove as a side-by-side 2:1 complex.7 Whilst hydrogen bonding to the groove floor endowed specificity for particular sequences, lipophilic interactions with the groove walls were also highly relevant.8-9 The balance between enthalpic and entropic contributions to MGB binding is the subject of extensive research, and appears to vary with both MGB structure and the binding sequence of the DNA.10
Over the past ten years, we have prepared a library of over 200 MGBs made up from heterocyclic and head/tail groups that seek to recognize both the hydrogen bonding capacity of the groove floor to achieve specificity, and to exploit the lipophilic nature of the groove walls to enhance affinity.11-14 Significantly, we have found that the heterocyclic N-alkyl or
C-alkyl groups can play a crucial role in extending the reading frame of the ligand from four to six base pairs. The first, well-characterized example of this effect was our detailed studies by NMR,12 isothermal calorimetry and molecular modelling15 of the high affinity binding between the DNA duplex d(CGACTAGTCG)2 and thiazotropsin A 1. Our footprinting data16
is any base except C and Z is any base except G. These alterations to the flanking bases of the DNA reading frame for 1 have subtle consequences for binding,16 and have not been explained in structural or energetic terms.
In order to determine the reasons for this behaviour by 1, and hence to provide a basis for the design of further selective small MGBs, we have examined its interaction with oligodeoxynucleotides (ODNs) containing different flanking bases around the central 5′-CTAG-3′ motif using a combination of NMR spectroscopy, isothermal titration calorimetry (ITC) and molecular simulation. We describe for the first time a rapid and efficient simulation protocol that can rank the binding affinities for ligands binding 2:1 in a side-by-side fashion.
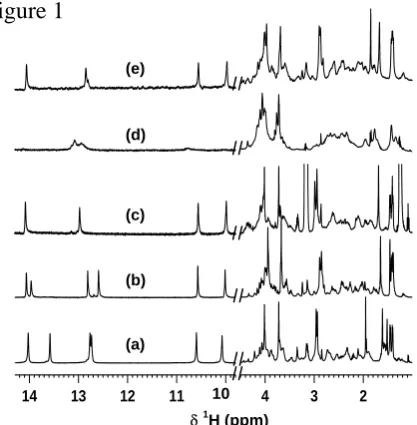
Analysis of the 1H NMR data for the complex between 1 and 5´-CGACTAGTCG-3´ (Figure 1a) had already established that minor groove binding occurs with a staggered 2:1, head-to-tail, side-by-side binding motif17 at the indicated (underlined) reading frame.12 The same characteristic NMR resonance pattern also occurs for the binding of 1 to both 5´-d(CGTCTAGACG)-3´ and 5´-d(CGGCTAGCCG)-3´ (Figures 1b and c respectively), all of which produce outstanding quality 2D NOESY NMR data sets. In stark contrast, the binding of 1 to 5´-d(CGCCTAGGCG)-3´ can at best be described as ‘poor’, being characterized by broad NMR resonances (Figure 1d) and ill defined cross-peaks in 2D NOESY NMR spectra. Our data suggest that whilst DNA binding occurs between 1 and 5´-CCTAGG-3´, the complex formed is ‘loose’.
Our evaluation by ITC (for full experimental details, see Supporting information) of the binding between 1 and the four different sequences in question confirmed the subtle influences of the CTAG flanking sequences in thermodynamic terms (Figure 2 and Figure S2; Table S1); the three sequences that produced high quality 2D NOESY NMR data sets had significantly more favorable binding free energies with 1 than 5’-d(CGCCTAGGCG)-3´, which reflected lower affinity binding by this last sequence observed by NMR. Indeed, the enthalpogram for this sequence when titrated with 1 lacked the characteristic steep inflection curves that characterize minor-groove binding ligands with ODNs (Figure 2).18
Based on the high quality NMR spectra for the efficient binding sequences with 1, we were able to produce co-ordinates for the complexes12 (manuscript in preparation). In the absence of an equivalent data set for 1 binding with 5’-d(CGCCTAGGCG)-3´, we examined these complexes to identify the reason for poor binding. We recognised the exocyclic amino group of G8 in the DNA minor groove as creating steric crowding in the vicinity of the dimethylaminopropyl (Dp) tail of 1. We therefore proposed like others before us19 that removing the G8 exocyclic NH2 (i.e. replacement of G8 in 5´-d(CGCCTAGGCG)-3´ by
inosine, I8) would restore the quality of complex formation in a 2:1 mixture with 1. As the data suggest, the binding between 1 and 5´-d(CGCCTAGICG)-3´ falls into the same class as all previous tight binding complexes (Figure 1e). Characteristic patterns in the NMR data (in particular the 31P chemical shift of the phosphorus 3´ to T5 at highest ppm, Figure S1) indicate that the complex formed between 1 and 5´-d(CGCCTAGICG)-3´ resembles that for 5´-d(CGACTAGTCG)-3´. Analysis by ITC confirmed that replacement of G8 by I8 in the sequence was thermodynamically favorable for binding 1 (Figure 2, Table S1), and in fact, produced the most stable complex of the five sequences.
To examine these complexes in more detail, we subjected the solved structures to MD analysis. We have recently reported the first attempt using combined MD/MM-PBSA calculations to obtain absolute binding free energy data for 2:1 side-by-side binding of a ligand with DNA.15 To generate experimentally-relevant binding simulations for 1 binding with the DNA duplex 5’-d(CGACTAGTCG)2-3’, we demonstrated that the optimum method
using explicit water with the polarizable AMBER force field ff02.15 The disadvantage of this approach is that its high computational demand (three trajectories need to be generated using a polarizable force field and post-processed to generate the required thermodynamic parameters) does not readily lend itself to the analysis and comparison of multiple complexes. We therefore explored the use of less expensive implicit MD, which would be applicable to drug discovery programmes that contain large libraries of ligands, like our own. We used the co-ordinates generated by our NMR studies to explore whether implicit MD simulations could reproduce the ranking order of binding for 1 in the tight-binding complexes with 5’-d(GCGACTAGTCGC)2-3’, 5’-d(GCGTCTAGACGC)2-3’, 5’-d(GCGGCTAGCCGC)2-3’,
and 5’-d(GCGCCTAGICGC)2-3’.. To examine the efficiency of different GB models in
AMBER, we compared a standard pair wise descreening GB (HCT, igb=1)20 and a modified version by Onufriev and coworkers (OBC(II), igb=5).21 A non-polarisable force-field (FF03)22 in AMBER was used for all MD simulations. The two GB solvation models (igb=1
or 5) were applied employing Langevin dynamics with a collision frequency equal to 1 throughout the 10 ns simulations. The temperature was maintained at 300 K. The binding free energies were the average of 100 snapshots taken from the last 5 ns of the implicit MD simulations. Only 10 snapshots from the last ns were kept for Normal Mode Analysis (NMA) to evaluate the entropy. The full simulation protocols can be found in the Supporting Information.
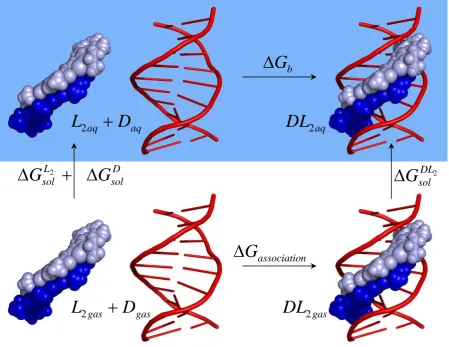
Our NMR and ITC studies indicated the presence of only the 2:1 complex structure during titration with the ligand; indeed, all our experimental studies have thus far found no evidence for the formation of an initial 1:1 complex prior to 2:1 binding, and that thiazotropsin type ligands behave like head-to-tail dimers in solution, and monomers are not present at the ligand concentrations under investigation.23 In line with our previous study, we have therefore used the thermodynamic cycle represented in Figure 3 and expressed the parameters that can be calculated using the MM-PBSA methodology to obtain binding free energies of ligands with various ODNs by solving equations 1-3.
(Equation 1)
(Equation 2)
(Equation 3)
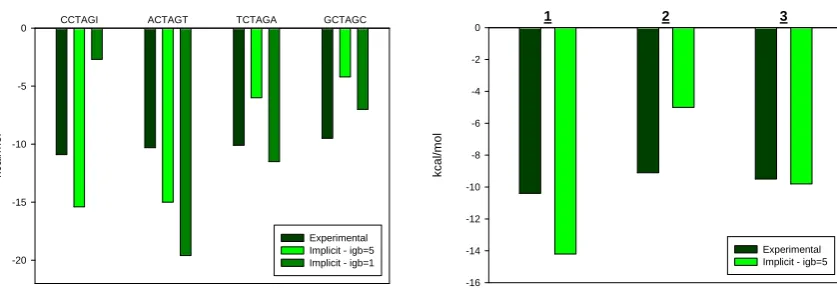
Comparison of the experimental and simulated relative free energies (ΔGRel)24 of the
ligand dimer binding with DNA are shown in Figure 4 (actual experimental and theoretical values are summarized in table S3). Our results indicate that ΔGRel from the implicit MD
simulations (igb=5) of the single trajectory reproduced the ranking order of affinity (CCTAGI >ACTAGT>TCTAGA>GCTAGC), and represents the first report of a simulation method that can rank 2:1 ligand binding free energies in line with experiment. Furthermore, it is also computationally efficient, running 14 times faster than explicit MD on our architecture (the UK National Grid Service).
values of -5.0 and -9.8 kcal/mol for analogues 2 and 3 respectively bound to the ACTAGT-containing ODN, and their ranking reflects the values obtained by ITC (Figure 4, Table 1).
Examination of the absolute enthalpic (ΔHabs), entropic (TΔSabs), and free energy (ΔGabs)
terms of 5’-d(GCGACTAGTGCG)2-3’ binding to 1, 2, and 3 obtained from both simulation
and experiment can help provide insight into the drug design process. According to Table 2, despite the isopentyl group being enthalpically favorable through enhanced lipophilic contacts in accordance with our design paradigm, the greater flexibility of this chain generates a greater entropic penalty on binding than is compensated by enhanced lipophilic interactions, and thus reduces the binding affinity of 2 for the ODN. Similarly, comparison of
1 with 3 shows that replacing the dimethylamino propyl tail with a morpholino ethyl group is more favorable enthalpically through hydrogen bonding between the morpholine oxygen and the ODN, but again, the entropic penalty negates this enthalpic gain.
In conclusion, whilst our aim is to enhance DNA recognition through enhanced lipophilic interactions, the subtlety of DNA recognition continues to be strongly influenced by favorable matching of three-dimensional shape, hydrogen bond partnering and conformational considerations. We believe that the information provided by this type of detailed study will be important in informing the design and implementation of modelling parameters capable of identifying potentially ‘good’ and ‘bad’ binders on the basis of such structural subtleties observed here.
Supporting Information Available: Computational and experimental details.
Acknowledgements: We thank the Royal Golden Jubilee Ph.D. Program (3C.KU/47/B.1) and the Thailand Research Fund for support of WT, EPSRC and the Scottish Funding Council for their funding of the Physical Organic Chemistry initiative at Strathclyde, and the National Grid Service for access to cluster facilities.
References
(1) Dickinson, L. A.; Gulizia, R. J.; Trauger, J. W.; Baird, E. E.; Mosier, D. E.; Gottesfeld, J. M.; Dervan, P. B. Inhibition of RNA polymerase II transcription in human cells by synthetic DNA-binding ligands. Proc. Natl. Acad. Sci. U. S. A.1998, 95, 12890.
(2) Mapp, A.; Ansari, A. Z.; Ptashne, M.; Dervan, P. B. Activation of gene expression by small molecule transcription factors. Proc. Natl. Acad. Sci. U. S. A.2000, 97, 3930.
(3) Kopka, M. L.; Yoon, C.; Goodsell, D.; Pjura, P.; Dickerson, R. E. The molecular origin of DNA-drug specificity in netropsin and distamycin. Proc. Natl. Acad. Sci. U. S. A. 1985, 82, 1376.
(4) Mrksich, M.; Wade, W. S.; Dwyer, T. J.; Geierstanger, B. H.; Wemmer, D. E.; Dervan, P. B. Antiparallel side-by-side dimeric motif for sequence-specific recognition in the minor groove of DNA by the designed peptide 1-methylimidazole-2-carboxamide netrosin.
Proc. Natl. Acad. Sci. U. S. A.1992, 89, 7586.
(6) Wade, W. S.; Mrksich, M.; Dervan, P. B. Design of peptides that bind in the minor groove of DNA at 5'-(A,T)G(A,T)C(A,T)-3' sequences by a dimeric side-by-side motif. J. Am. Chem. Soc.1992, 114, 8783.
(7) Pelton, J. G.; Wemmer, D. E. Structural characterization of a 2:1 distamycin A/d(CGCAAATTGGC) complex by two-dimensional NMR. Proc. Natl. Acad. Sci. U. S. A. 1989, 86, 5723.
(8) Lane, A. N.; Jenkins, T. C. Thermodynamics of nucleic acids and their interactions with ligands. Quart. Rev. Biophys.2000, 33, 255.
(9) Misra, V. K.; Honig, B. On the magnitude of the electrostatic contribution to ligand-DNA interactions. Proc. Natl. Acad. Sci. U. S. A.1995, 92, 4691.
(10) Chaires, J. B. A thermodynamic signature for drug-DNA binding mode. Arch. Biochem. Biophys.2006, 453, 26.
(11) Anthony, N. G.; Fox, K. R.; Johnston, B. F.; Khalaf, A. I.; Mackay, S. P.; McGroarty, I. S.; Parkinson, J. A.; Skellern, G. G.; Suckling, C. J.; Waigh, R. D. DNA binding of a short lexitropsin. Bioorg. Med. Chem. Lett.2004, 14, 1353.
(12) Anthony, N. G.; Johnston, B. F.; Khalaf, A. I.; MacKay, S. P.; Parkinson, J. A.; Suckling, C. J.; Waigh, R. D. Short lexitropsin that recognizes the DNA minor groove at 5 '-ACTAGT-3 ': Understanding the role of isopropyl-thiazole. J. Am. Chem. Soc. 2004, 126, 11338.
(13) Khalaf, A. I.; Ebrahimabadi, A. H.; Drummond, A. J.; Anthony, N. G.; Mackay, S. P.; Suckling, C. J.; Waigh, R. D. Synthesis and antimicrobial activity of some netropsin analogues. Org. Biomol. Chem.2004, 2, 3119.
(14) Anthony, N. G.; Breen, D.; Clarke, J.; Donoghue, G.; Drummond, A. J.; Ellis, E. M.; Gemmell, C. G.; Helesbeux, J. J.; Hunter, I. S.; Khalaf, A. I.; Mackay, S. P.; Parkinson, J. A.; Suckling, C. J.; Waigh, R. D. Antimicrobial lexitropsins containing amide, amidine, and alkene linking groups. J. Med. Chem.2007, 50, 6116.
(15) Treesuwan, W.; Wittayanarakul, K.; Anthony, N. G.; Huchet, G.; Alniss, H.; Hannongbua, S.; Khalaf, A. I.; Suckling, C. J.; Parkinson, J. A.; Mackay, S. P. A detailed binding free energy study of 2: 1 ligand-DNA complex formation by experiment and simulation. Phys. Chem. Chem. Phys.2009, 11, 10682.
(16) James, P. L.; Merkina, E. E.; Khalaf, A. I.; Suckling, C. J.; Waigh, R. D.; Brown, T.; Fox, K. R. DNA sequence recognition by an isopropyl substituted thiazole polyamide.
Nucleic Acids Res.2004, 32, 3410.
(17) Kopka, M. L.; Goodsell, D.; Han, G. W.; Chiu, T. K.; Lown, J. W.; Dickerson, R. E. Defining GC-specificity in the minor groove: side-by-side binding of the di-imidazole lexitropsin to C-A-T-G-G-C-C-A-T-G. Structure1997, 5, 1033.
(18) Freyer, M. W.; Buscaglia, R.; Nguyen, B.; Wilson, W. D.; Lewis, E. A. Binding of netropsin and 4,6-diamidino-2-phenylindole to an A(2)T(2) DNA hairpin: A comparison of biophysical techniques. Anal. Biochem.2006, 355, 259.
(19) Bailly, C.; Waring, M. J. Transferring the purine 2-amino group from guanines to adenines in DNA changes the sequence-specific binding of antibiotics. Nucleic Acids Res. 1995, 23, 885.
(20) Hawkins, G. D.; Cramer, C. J.; Truhlar, D. G. Parametrized models of aqueous free energies of solvation based on pairwise descreening of solute atomic charges from a dielectric medium. J. Phys. Chem.1996, 100, 19824.
(21) Feig, M.; Onufriev, A.; Lee, M. S.; Im, W.; Case, D. A.; Brooks, C. L. Performance comparison of generalized born and Poisson methods in the calculation of electrostatic solvation energies for protein structures. J. Comput. Chem.2004, 25, 265.
field for molecular mechanics simulations of proteins based on condensed-phase quantum mechanical calculations. J. Comput. Chem.2003, 24, 1999.
(23) Hamdan, I.; Skellern, G. G.; Waigh, R. D. Use of capillary electrophoresis in the study of ligand-DNA interactions. Nucleic Acids Res.1998, 26, 3053.
Figure and table captions
Figure 1. Sections of 1D 1H NMR spectra after mixing 2 equivalents Thiazotropsin A with the self complementary oligonucleotides a) d(CGACTAGTCG)2; b) d(CGTCTAGACG)2; c)
d(CGGCTAGCCG)2; d) d(CGCCTAGGCG)2; e) d(CGCCTAGICG)2.
Figure 2.The ITC titrations of Thiazotropsin A to ODN sequences in PIPES buffer at 25 °C (pH 6.8). (A) Raw data for titration of Thiazotropsin A into d(GCGCCTAGGCGC)2 (left),
andd(GCGCCTAGICGC)2 (right). (B) Enthalpogram retrieved from A and corrected for the
heat of dilution; the line represents the least-squares-fit to a single-site binding model.
Figure 3. Thermodynamic cycle for the association of the thiazotropsin A dimer (L2, shades
of blue) with duplex 5’-d(GCGACTAGTCGC)2-3’ (D, red)
Figure 4. Left: relative binding free energies for 1 bound to the different ODNs based on experiment and implicit MD using igb=1 and igb=5. Right: relative binding free energies of
1, 2 and 3 binding to d(GCGACTAGTCGC)2.
Table 1. The energy contributions of 1, 2 and 3 binding to d(GCGACTAGTCGC)2 using
N O H N N H N O S N HN O N NH O H N O H N N H N O S N HN O N NH O H N O H N N H N O S N HN O N NH O H O
Figure 1
2 3
4 ppm
11 12 13
14 ppm10
δ1H (ppm)
Figure 2
(A)
(B)
(A)
Figure 3
aq
aq
D
L
2+
b
G
Δ
n associatio
G
Δ
gas
gas
D
L
2+
D sol L
sol
G
G
+
Δ
Δ
2 DL2sol
G
Δ
aq
DL
2gas
Figure 4
1 2 3
k
c
al
/m
ol
-16 -14 -12 -10 -8 -6 -4 -2 0
Experimental Implicit - igb=5
CCTAGI ACTAGT TCTAGA GCTAGC
kc
a
l/
m
ol
-20 -15 -10 -5 0
Table 1
Energy term
Experimental Simulated
1 2 3 1 2 3
-12.8 -14.3 -15.6 -78.5 -82 -90.3
-2.4 -5.2 -6.1 -22.9 -35.5 -39.0
-10.4 -9.1 -9.5 -55.6 -46.5 -51.3
-14.2 -5.0 -9.8