Abstract— In this paper, we present a novel method for content adaptation and video summarization fully implemented in compressed-domain. Firstly, summarization of generic videos is modeled as the process of
extracted human objects under various activities/events. Accordingly, frames are classified into five categories
via fuzzy decision including shot changes (cut and gradual transitions), motion activities (camera motion and
object motion) and others by using two inter-frame measurements. Secondly, human objects are detected using Haar-like features. With the detected human objects and attained frame categories, activity levels for each
frame are determined to adapt with video contents. Continuous frames belonging to same category are grouped
to form one activity entry as content of interest (COI) which will convert the original video into a series of
activities. An overall adjustable quota is used to control the size of generated summarization for efficient
streaming purpose. Upon this quota, the frames selected for summarization are determined by evenly sampling
the accumulated activity levels for content adaptation. Quantitative evaluations have proved the effectiveness
and efficiency of our proposed approach, which provides a more flexible and general solution for this topic as
domain-specific tasks such as accurate recognition of objects can be avoided.
Index Terms— Activity-driven content adaptation, content of interest, activity level, video summarization, compressed-domain processing.
Activity-Driven Content Adaptation for
Effective Video Summarization
Jinchang Ren and Jianmin Jiang
Digital Media & Systems Research Institute, University of Bradford, BD7 1DP, U.K.
I. INTRODUCTION
Summarization of digital videos plays essential roles in efficient content-access, browsing and retrieval of large video databases as well as effective storage, management and transmission [1-5]. In general, a good summarization should only keep the most important information while ignoring the less important ones, which consequently leads to extraction the content of interest (COI). However, it is found that objective defining of COI is difficult due to the fact that COIs are inevitably dependent on both the application domain and the users’ preferences. One of the most widely investigated application is sports video summarization [10, 13-14, 25, 34], followed by movies [5, 7, 21, 30, 35], news [18, 32], surveillance [6], home videos [28] and web videos [19, 24]. Regarding the users’ preferences, personalized and user-adaptive summarization techniques are introduced and can be found in [10-11, 28].
Video summarization generally involves four main components, including video segmentation, key frame extraction, COI extraction, and summary generation. Segmentation is used to determine shots and sub-shots in original videos for further processing [6, 12-13], in which shot boundary detection is usually employed [1, 8]. Normally, histogram and frame differences are measured and decision is then made via simple thresholding or complex classifying techniques for shot boundary detection [8]. Key frames are defined as most representative frames in each shot, and many techniques have been proposed for the extraction of them [5-6, 11, 37, 38] whilst frame similarity can be measured by using simple histogram distance [1, 7, 30, 32, 39] and mutual information etc. [8]. Extraction of COIs including objects and activities can be solved by introducing user-attention model and domain knowledge [3, 6, 16]. As for summary generation, combining of key frames, video segments, or even a complex layout of these frames whose sizes are determined by their contained information may be considered [18]. Recent literature surveys on relevant techniques can be found in a number of sources [2, 17, 20, 36].
According to the information used in determining COIs, video summarization methods can be categorized into two main groups, i.e. “internal summarization” and “external summarization” [17]. The prior utilizes only information extracted from the video, including image features [7, 14-15, 20, 26, 30, 32], audio [32-34], camera motion [8, 12] and object motion [1,7,13, 16]. In contrast, the latter supports interactive processing by employing additional information such as manual annotation of the video used in MPEG-7 descriptors [32] and knowledge about the users to achieve personalized summarization [10-11, 28].
surveillance environment and normal/abnormal activities at an airport, models and approaches for the summarization of general video contents are desired.
In this paper, we propose a new content-adaptation algorithm for video summarization, which is basically an internal summarization solution. Firstly, video summarization is modeled as extraction of COIs, which is further emphasized by using human objects under motion activities. Two inter-frame measurements are then applied for frame categorization via fuzzy decision. Secondly, human objects are detected using Haar-like features. With frame categorization results and detected human objects, each frame is assigned with an activity level to represent its importance for summarization. Continuous frames of same category are then grouped to form a motion activity which has converted the original video into a series of motion activities. Thirdly, under an adjustable quota of summarization size, representative frames in each activity are determined by evenly sampling the accumulated activity level to adapt with the activity-driven content changes.
The remaining part of this paper is organized as follows. In Section II, video summarization is modeled as extraction of useful COIs in which frame categorization is presented in details. Section III describes the definition of activity level and extracted series of motion activities, on the basis of extracted human objects and frame categorization results. Experimental results and discussions with quantitative evaluations are given in Section IV, and finally brief conclusions are drawn in Section V.
II. MODELING
In this section we will model the elements in extracted COIs for content adaptation, based on which frames are classified into several categories including shot changes, motion activities and others. This categorization is achieved by two inter-frame measurements. This on the one hand solves the problem of shot boundary detection. On the other hand, it provides useful information to rank the importance of frames for summarization.
To design effective techniques for video summarization, one important requirement is the COIs extracted should be closely related with the video contents. In general, video sources are captured to cover scenes of people’s daily life. As a result, the COIs need to be defined in a way where such scenes can be modeled. There are two common elements involved in modeling these scenes, including objects and activities (events). The prior normally refers to both human and other entities, and the latter is generally caused by movement of objects and cameras. Some examples to show relationships between these objects and activities are given below.
Since deep understanding of these objects and activities are purely domain-specific tasks, we avoid going to any further and try to provide a more general solution for video summarization. Consequently, our tasks are constrained in identifying human objects and corresponding camera and object motions rather than exactly recognizing the objects and motion activities. By measuring these extracted objects and activities, COIs are then obtained for video summarization.
To detect the above motion activities, one apparent indicator is that these activities will lead to large frame difference in video frames. However, as we know, shot changes including cuts and gradual transitions will also generate large frame difference. Therefore, the video frames need to be classified into at least five categories including cut, gradual transition, camera motion, object motion and others. In the following, we will discuss the principles in classifying these five categories of frames.
If we consider video frames as sequential images, the inter-frame difference (
IFD
), namely frame distortion metric in [9], will be high when shot changes occur. Normally, this difference will remain low if there are no such shot changes. As for cut, this change can be identified by a large peak in theIFD
curve which lasts for only one frame. For gradual transitions, however, there will be multiple peaks which are relative high but generally lower than the height of the peak as a cut. Regarding frames without shot changes, theirIFD
values should be very low except those containing apparent motions. Here camera motion usually leads to higherIFD
values than that of object motion as it refers to overall change of pixel positions.Although camera motion may cause large
IFD
values in counting co-sited pixel difference, the overall similarity of the frames remains high. Therefore, global similarity of images (GSI
) can be employed to filter such cases from real shot changes. Please note that accurate definitions of GSI and IFD are given in the next section, based on the extracted DC-images from MPEG video. For boundary frames of cuts, theirGSI
values are small as the boundary frames are apparent different. For boundary frames of gradual transitions, theirGSI
values will become smaller when the interval between the frames increases. If there is no large motion and shot changes involved, theGSI
values between frames will become large. Regarding large object motion, it may lead to intermediate values of bothIFD
andGSI
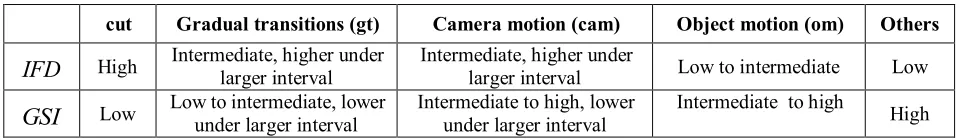
which makes it different from other patterns.Table 1. Appearance of five kinds of frames in terms of relevant
IFD
andGSI
values.cut Gradual transitions (gt) Camera motion (cam) Object motion (om) Others
IFD
High Intermediate, higher under larger interval Intermediate, higher under larger interval Low to intermediate LowGSI
Low Low to intermediate, lower under larger interval Intermediate to high, lower under larger interval Intermediate to high High [image:4.612.61.542.584.654.2]intervals. In gradual transitions, larger interval between frames will produce higher
IFD
values and lowerGSI
values, and smaller intervals will lead to lowerIFD
values and higherGSI
values. Whilst for object motion,IFD
andGSI
values under varying frame intervals do not satisfy these appearances.To help understand how
IFD
andGSI
values change under various frame categories, Figure 1 illustrates some examples in which the data is extracted from test set of TRECVID’08 [40]. The frame numbers in the plots are for index purpose only, as the curves are compacted with intermediate points being omitted for better visualization effect. The frame ranges for the three sequences “BG_36528”, “BG_34413” and “BG_35148” in determining these values are [1575, 1945], [120, 225], and [2, 205], respectively. As seen, frame categories of cut and others can be clearly identified. Although sometimes it is difficult to distinguish between camera motion and large object motion (see Fig 1b), such inaccuracy will not degrade our results as both these motion activities will be ranked the same level for summarization as discussed in the next Section.(a)
(b)
(c)
III. FRAME CATEGORIZATION
Frame categorization is to classify video frames into five categories by using the principles as illustrated in Table 1. For the input videos compressed in MPEG format, we implement the whole process in compressed-domain for efficiency. The high efficiency is achieved due to the fact that only partial decoding of the video is required and the time-consuming inverse discrete cosine transform (IDCT) is avoided. Actually, both
IFD
andGSI
are attained on the basis of our extracted DC-images. Since all the macroblocks are intra-coded in I-frames, the corresponding DC-images can be directly extracted. For P-frames and B-frames, their DC-images are obtained via weighted motion compensation as proposed in [23]. As each DC value corresponds to the average pixel value inside the related block, the DC-image provides a low-resolution version of the original frame, which presents a scaled-down visual content platform for further analysis.If we define
Y
dc(i) as the corresponding DC-images of luminance component for the thi frame, for two given frames i and j, their
IFD
value is defined using the Soergel distanceas follows [41]:
k j dc i dc k j dc i dck
Y
k
Y
k
Y
k
Y
j
i
IFD
)]
(
),
(
max[
|
)
(
)
(
|
)
,
(
() ( ) ) ( ) ( (1)where k is the index of the elements in the DC-images. Since all the elements in each DC-image are non-negative, we can easily have
IFD
(
i
,
j
)
[
0
,
1
]
where largerIFD
values indicate more difference between the two frames and vice versa. If the overall illumination of the image is low, a small change within frames may result in a largeIFD
value. On the other hand, a larger change is required to generate the same IFD value over frames of high illumination conditions. For example, if the average luminance of the image is 200, the required intensity change should be 40 to obtain aIFD
value of 0.2. To achieve the sameIFD
value, the intensity change of 10 is sufficient if the average luminance of the image becomes 50. Consequently,IFD
value provides certain degree of robustness to adapt with illumination changes over frames.As seen,
IFD
values are defined in a way to measure the sum of co-sited block difference hence it is inevitably sensitive to block motions that makes the contents inconsistent. To overcome this drawback, we intend to introduceGSI
as frame correlation which is implemented by phase correlation on extracted DC-images for efficiency [33]. For two DC-imagesY
dc(i) andY
dc(i), its phase correlations is defined as follows, where
(
)
denotes Fourier transform:
|
)
(
)
(
|
)
(
)
(
)
,
(
() * ( ) ) ( * ) ( 1 j dc i dc j dc i dcY
Y
Y
Y
j
i
(2)|
)
,
(
|
max
arg
)
,
(
) , (
l
k
j
i
GSI
l k
(3)Apparently, we also have
GSI
(
i
,
j
)
[
0
,
1
]
and largerGSI
value refers to higher similarity and vice versa.Examples of extracted DC-images and their associated original images in four consecutive video frames are shown in Figure 2, where significant intensity changes can be found in the last two frames. The measurements of
IFD
andGSI
values for each consecutive pairs of the DC-images are also given. Since there are very limited content changes in the two frames before the cut, a lowIFD
value of 0.282 and a highGSI
value of 0.908 are found. When the cut occurs, a rather highIFD
value of 0.765 and a very lowGSI
value of 0.105 are obtained indicating apparent content changes associated. Due to significant change of intensity, the two post-cut frames appear very different with a pretty highIFD
value of 0.805, even higher than theIFD
value during the cut. However, thanks to the robustness ofGSI
in measuring frame similarity, a relative high value of 0.774 still suggests consistent contents of the two frames.
Figure 2. Examples of four original video frames (top row) extracted from “BG_34413” sequence, their associated DC-images (middle row) and the difference between three pairs of consecutive DC-images (bottom row). The IFD and
GSI values for the three pairs DC-images are (0.282, 0.908), (0.765, 0.105) and (0.805, 0.774), respectively, which clearly shows that GSI is insensitive to intensity changes in providing accurate measurement of image similarity.
With the defined
IFD
andGSI
values, five fuzzy membership functions (FMF)
i,i1(.)
are defined for frameof the maximum membership value over the five FMFs. This is different from the work in [29] where FMF is employed for fuzzy content representation. According to the principles in Table 1, FMFs for cut and others category are defined as follows.
.
,
/
/
,
/
,
/
,
1
)
(
2 1 1 2 2 1 2 1 1 ,otherwise
s
s
d
d
d
d
if
s
s
s
s
if
d
d
s
s
d
d
if
others
i i i i i i i i ii (4)
.
,
/
/
,
/
,
/
,
1
)
(
1 2 1 2 2 1 2 1 1 2 1 ,otherwise
s
s
d
d
s
s
d
d
if
d
d
s
s
d
d
if
s
s
s
s
d
d
if
cut
i i i i i i i i i i ii (5)
In (4), the FMF is defined to reflect the fact that frames in the category
others
tend to have smalld
i but larges
i values, i.e. low frame difference and high inter-frame similarity. If thed
i is small enough ands
i is sufficient large, i.e.d
i
d
1
s
i
s
2, it is determined asothers
with 100% membership degree. Otherwise, the degree is linearly degraded. Since the visual appearance ofcut
is of larged
i and smalls
i, which is opposite to that ofothers
, hence the FMF for frame categorycut
in (5) is defined in a similar way, but in a different logic of (4).To further classify camera motion, object motion and gradual transition cases, two flags,
f
IFD(
i
,
i
1
)
andf
GSI(
i
,
i
1
)
, are attained below, wherestep
1
is a large frame interval.
.
,
)
1
,
(
)
,
(
)
2
,
(
,
)
1
,
(
otherwise
false
i
i
IFD
step
i
i
IFD
step
i
i
IFD
if
true
i
i
f
IFD (6)
.
,
)
1
,
(
)
,
(
)
2
,
(
,
)
1
,
(
otherwise
false
i
i
GSI
step
i
i
GSI
step
i
i
GSI
if
true
i
i
f
GSI (7)Again, according to the principles in Table 1, FMF for frame categories of gradual transition and camera motion determined as follows: If
!
f
IFD(
i
,
i
1
)
!
f
GSI(
i
,
i
1
)
,
i,i1(
gt
)
i,i1(
cam
)
0
; Otherwise, we have
.
,
)
/
,
/
min(
)
/
,
/
min(
]
,
[
]
,
[
,
)
/
,
/
min(
]
,
[
]
,
[
,
)
/
,
/
min(
]
,
[
]
,
[
,
1
)
(
1 2 1 2 2 1 2 1 1 2 2 1 2 1 1 2 2 1 2 1 1 ,otherwise
s
s
s
s
d
d
d
d
s
s
s
d
d
d
if
s
s
s
s
s
s
s
d
d
d
if
d
d
d
d
s
s
s
d
d
d
if
gt
i i i i i i i i i i i i i i i
.
,
/
)
/
,
/
min(
]
,
[
,
/
]
,
[
,
)
/
,
/
min(
]
,
[
,
1
)
(
2 1 2 2 2 1 2 2 2 1 1 2 2 2 1 1 ,otherwise
s
s
t
d
d
t
s
s
d
d
d
if
s
s
s
s
d
d
d
if
t
d
d
t
s
s
d
d
d
if
cam
i i i i i i i i i i i i ii (9)
In Eq. (8), if
d
i
[
d
1,
d
2]
, we have eitherd
i
d
1 ord
i
d
2, and the part of corresponding fuzzy likelihood ford
i isthen defined as
min(
t
2/
d
i,
d
i/
t
1)
. Similar rules are applied tos
i, i.e. whens
i
[
s
1,
s
2]
, the part of its corresponding fuzzylikelihood is determined as
min(
s
2/
s
i,
s
i/
s
1)
. In Eq. (9), please note that even the likelihood part ford
i is similar to that defined in Eq. (8), the range ofs
i is different, and this difference will help to identify these two cases.Also, FMF for the frame category of object motion is defined as follows: If
f
IFD(
i
,
i
1
)
f
GSI(
i
,
i
1
)
,
i,i1(
om
)
0
;Otherwise, we have
.
,
/
)
/
,
/
min(
]
,
[
,
/
]
,
[
,
)
/
,
/
min(
]
,
[
,
1
)
(
1 1 2 1 2 1 1 1 2 1 1 2 1 2 1 1 ,otherwise
s
s
d
d
d
d
s
s
d
d
d
if
s
s
s
s
d
d
d
if
d
d
d
d
s
s
d
d
d
if
om
i i i i i i i i i i i i ii (10)
As can be seen, parameters
d
1 andd
2 are used as a group to thresholdIFD
(.)
values, and parameterss
1 ands
2 form another group to thresholdGSI
(.)
values. Each parameter is determined by using Bayesian minimum error classification rules as follows. Takingd
1 as an example, firstly we calculate p(others|IFD) and p(nonothers|IFD) as conditional probability learnt from a training set. Secondly, the thresholdd
1 is optimally decided in (11) below,]
)
(
)
|
(
)
(
)
|
(
[
min
arg
1 01
p
non
others
IFD
d
IFD
p
others
IFD
d
IFD
d
(11) where the first and second parts of (11) respectively denotes errors caused by false alarms and missing classifications when the decision is made where
IFD
(.)
refers to others. Finally, we have determined thatd
1
0
.
06
,d
2
0
.
75
,s
1
0
.
1
and93
.
0
2
s
.IV. HUMAN OBJECT DETECTION AND COIS EXTRACTION
A. Human-object Detection
To detect human objects within videos, Haar-like features are used for their accuracy, robustness and efficiency [31]. The Haar-like features are determined like a group of templates which denote the difference of dark and light regions. As a result, they can be considered as features containing edge information at different orientation and scale. Although the whole set of Haar-like features is large, during a training process only a small sub-set is learned from positive and negative examples for face detection. In our system, the implementation of Haar face detector in OpenCV is used for the detection of human objects [42].
For efficiency, face detection is only applied to I-frames on the corresponding DC-images of luminance component,
Y
dc(i). Since the size of a face in the DC-image will become one-eighth of its original size in width and height, the extracted DC-image is enlarged to enable successful detection of small face regions in the DC-image. Also a small window of 10*10 pixels is used as the initial search window with a step of 10% of the initial size, i.e. increasing 1 pixel in both width and height. Finally, the number of detected face objects is denoted asn
i, which will be employed in video summarization in the next step.B. Activity-Driven COIs Extraction
As described in the previous sections, COIs should be defined in a way that human objects and apparent motion activities are a focus. To this end, for each frame i we assign
r
(
i
)
as a rank of importance to be selected as COIs which is defined as follows,
r
(
i
)
[
IFD
(
i
,
i
1
)]
1/(1ni)(12) Apparently, larger values of
IFD
(
i
,
i
1
)
andn
i produce higher ranks ofr
(
i
)
as they respectively refer to more content changes (caused by motion activities, etc.) and more detected human objects. On the contrary, smaller values ofIFD
(
i
,
i
1
)
andi
n
will generate lower ranks ofr
(
i
)
. When there is no human objects detected, i.e.n
i
0
, we simply have)
1
,
(
)
(
i
IFD
i
i
r
. WhenIFD
(
i
,
i
1
)
0
, we haver
(
i
)
0
no matter hown
i changes. This is useful to skip frames which have no difference to its prior ones, such as embedded static or black frames in videos.Since both camera motion and large object motion yield large values of
IFD
(
i
,
i
1
)
, they will lead to high ranks ofr
(
i
)
for further processing. In other words, both of them are treated equally in ranking frames for summarization thus the inaccuracy in classifying these two categories can be ignored. As for frame category of others, its rank values are low due to very small)
1
,
(
i
i
IFD
values that have been attached. In addition, it can be seen that for shot changes including both cut and gradual transitions, the associated rank values will also be high due to largeIFD
(
i
,
i
1
)
values contained. However, these frames can be processed specifically by making use of the frame category information which will be addressed in the next section.According to the sequence “BG_2408.mpg” from TRECVID’07 test set, we have illustrated the change of
r
(
i
)
between)
1
,
(
i
i
the rank value
r
(
i
)
and makesr
(
i
)
IFD
(
i
,
i
1
)
. In other words, it is the human objects (represented by detected face masks) and large inter-frame difference (caused by motion activities) that leads to high rank values for effective video summarization. To this end, our approach is activity-driven which shows content adaptation with COIs.Figure 3. Illustration the change of
r
(
i
)
under varyingn
i, andIFD
(
i
,
i
1
)
is also shown for comparison, and the data is extracted from the sequence of “BG_2408.mpg” of TRECVID’07 test set.C. Generating Summarization through Content Adaptation
After frame categorization, the original video
V
can be represented by a series of motion activitiesA
, including camera motion, object motion, and others, i.e.V
{
A
1,
A
2,...,
A
M}
, andM
is the total number of extracted motion activities. These activities may separated by shot changes like cut and gradual transitions. Frames in the category of camera and object motion will be included in the generated summarization, but those gradual transitions will be excluded. Two boundary frames of cut effects will be merged with their directly adjacent motion activities. The reason that we put others within the activity series is that frames in this category may be also included in the summarization, though under a coarse re-sample rate due to much low rank values of)
(
i
r
.In fact,
r
(
i
)
is employed to determine the importance of the frame to be included in the summarization. For each motion activitiesA
m, the sum of its average motion activity levelR
mis determined by (13) wherei
m1 andi
m2 denote the frameboundary of
A
m,
2 1(
)
m m
i i i
m
r
i
R
(13) The overall activity level of the whole sequence
R
all is then obtained asTo provide certain flexibility, an adjustable upper limit of the summarization ratio
(between 0 and 1) is allowed in video summarization, i.e. the target video will have frames no more than a fixed percentage of the original video. Next, we will discuss how to assign the size quota to all detected activitiesA
m for video summarization. Let L be the length of the original video in frames, the length of the summarization video should be no more than
L frames. Therefore, each rank unit corresponds toall
R L/
frames inside the summarization video. For each activity
A
m, the frame quotaq
(
m
)
assigned for it is determined as1
)
(
all m
R
LR
m
q
(15) In the following, we will discuss how to determine the specific
q
(
m
)
frames inA
m for summarization. Ifq
(
m
)
0
, thewhole clip of
A
m is ignored. Ifq
(
m
)
1
, the middle frame ofA
m at the index(
i
m1
i
m2)
/
2
is selected. Otherwise, both thefirst and the last frames of
A
m are selected. Whenq
(
m
)
2
, the remaining frames to be selected for summarization is determined via an iterative process as follows. If framei
1 has been selected, the next frame to be selected isi
2, andi
2 should be the first frame satisfying that the accumulated activity level betweeni
1 andi
2 is no less than L/Rall.
2 1 2
1
)
,
(
),
(
/
)
(
1 2i i i
m m i
i i
all
r
i
i
i
i
R
L
i
r
(16)
Please note that the above re-sampling is nonlinear and unevenly distributed over frames. In terms of the accumulated activity levels, however, the sampling process could be regarded as even. If a video clip contains high activity level caused by camera/object motion and detected human objects, it is re-sampled under a small interval. On the other hand, a video clip of low activity level will have a large re-sample interval due to smooth contents it has contained. In an extreme case, static frames of no changes in comparison with its prior frame will be skipped. This is consistent with the expectations of our human perceptions in viewing videos whilst extracting COIs and identifying importance over sequence of videos. Some interesting results are illustrated and discussed in the next section.
V. RESULTS AND DISCUSSIONS
The proposed model and techniques have been fully tested by using the data set from the well-known TRECVID evaluation series. In this section, the results on frame categorization and video summarization are illustrated and analyzed. Quantitative evaluations are achieved objectively by using our extracted manual ground truth maps and the details are presented below.
A. Data Set and Evaluation Criteria
According to the results of frame categorization and video summarization, two different evaluations are used in our system. To achieve objective and quantitative measurements of the performance, these results are compared with our manually extracted ground truth maps. The ground truth maps are produced for each sequence which contains a series of video segments in varying frame categories. Each such segment is represented as
id
,
type
,
i
1,
i
2,
w
whereid
andtype
denote its index and frame category, respectively;i
1 andi
2 refer to the start and end frames;w
[
0
,
1
]
denotes average importance of the segments to be selected as COIs. The most important content is assigned withw
1
and the least important one withw
0
. The parameterw
is manually determined as follows. Firstly, we have three independent viewers and they view each sequence and assign a weight to every video segment. To enable accurate weighting, the viewers need glance over the whole sequence before they rank the video segments. Finally, the average score from them is then utilised as the determinedw
. Accordingly, quantitative analysis of these evaluations are achieved and discussed below.B. Evaluation of Frame Categorization
To evaluate the performance of frame categorization, the results attained are converted to the similar format as defined in the ground truth, which contains
id
,
type
,
i
1,
i
2,
rank
whererank
denotes the average activity level within the frame interval]
,
[
i
1i
2 and the other elements are the same as those in ground truth maps. On the average the overall accuracy of frame categorization is about 88.3%. By comparing the results with ground truth frame by frame, a confusion matrix is obtained to show the accuracy of frame categorization as presented in Table 2.As seen, in general the most accurate results are achieved in classifying frames in the categories of cut and others, followed by
object motion and camera motion. And the worst results are obtained in classifying gradual transition effects. One apparent reason here is that both cut and others can be defined clearly with little ambiguity, such as its appearances listed in Table 1. While for the other three categories, they share some common appearances hence the lower accuracy in classification. Although there are relative large errors in classifying frames in the categories of gradual transition, camera motion and object motion, such errors will not necessarily lead to poor performance in video summarization, especially for the misclassification errors between camera motion
and object motion. However, inaccurately classifying motion activities into gradual transitions may lead to critical problems as it may lead to content lost when such gradual transitions are removed during summarization.
In addition, it is found in Table 2 that motion activities including both camera motion and object motion form more than 80% of the video contents. This has also proved that our activity-driven scheme has the potential to extract the most meaningful contents from the videos for effective summarization. On the contrary, shot changes only occupy less than 2.5% of frames in the original videos. Regarding frames in the category of others, they appear as a percentage about 16% in the test videos.
GT
Results cut transition Gradual Camera motion Object motion others Sum
Cut 99.2% 0.1% 0.2% 0.2% 0.0% 0.1%
Gradual transition 0.3% 77.6% 9.7% 2.9% 0.1% 2.1%
Camera motion 0.2% 12.5% 82.3% 3.8% 0.3% 14.7%
Object motion 0.2% 9.3% 7.6% 88.2% 3.2% 66.8%
Others 0.1% 0.5% 0.2% 4.9% 96.4% 16.3%
sum 0.1% 2.3% 16.2% 65.6% 15.8% 100%
The parameter
rank
in obtained results andw
in ground truth maps are used to evaluate the accuracy of frame importance which is measured by using activity levels. For each motion activity, the error of frame ranking is(
i
2
i
1
1
)
|
rank
w
|
. The relative overall error of frame rankinge
f is defined as
id gt id
id id id
id
f
id
R
w
rank
i
i
e
)
(
|
|
)
1
(
( ) ( ) ( )1 ) ( 2
(17)
where
R
gt(
id
)
denotes the sum of frame importance of motion activityid
in the ground truth maps as defined below)
1
(
)
(
( )1 ) ( 2 )
(
id id idgt
id
w
i
i
[image:14.612.90.519.49.188.2]R
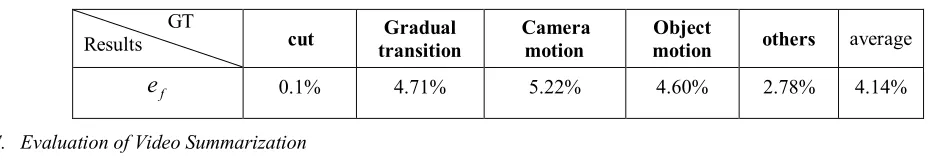
(18) Table 3 gives
e
f values under various frame categories from which we can see that our extracted activity level is closely matched with the frame importance defined in the ground truth. This one hand has demonstrated that activity levels indeed can be used to measure frame importance in such a context. On the other hand, it also reveals that large errors in frame categorization (about 11.7%) only cause a quite small error ine
f at about 4.1%. This again has shown that misclassification of frame categories will not certainly lead to degradation of summarized videos.Table 3. Relative overall error of frame ranking. GT
Results cut transition Gradual Camera motion Object motion others average f
e
0.1% 4.71% 5.22% 4.60% 2.78% 4.14%C. Evaluation of Video Summarization
[image:14.612.53.526.511.592.2]objective evaluation in which subjective scoring by human observers is avoided as those used in many other systems such as [27]. For a given motion activity in the ground truth, its associated frame quota
q
gt can be decided by
id gt all
gt all
gt gt
gt
R
R
id
R
id
LR
id
q
(
)
(
)
,
_(
)
_
(19) where parameter
and L respectively denote a given summarization ratio and the length of the original video as defined in (15).The overall inclusion of frame accuracy
IN
f is then attained as
id gt id f
id
q
id
n
IN
)
(
)
(
(20) where
n
(
id
)
denotes number of frames within theid
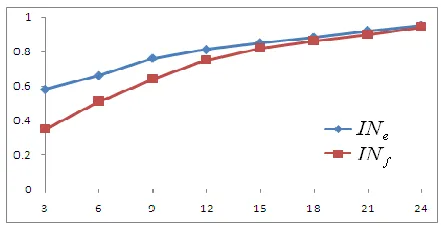
thmotion activity in the ground truth that has been included in the summarized video.Figure 4. Illustration of
IN
e andIN
f over various
(x-axis).Figure 4 plots the changes of activity inclusion
IN
e and frame inclusionIN
f under varying summarization ratio
.According to the results in Figure 5, several facts can be summarized below. Firstly,
IN
f is found more accurate thanIN
e due tothe fact that
IN
f is determined by a percentage of frames included. Therefore, incompleteness of frame inclusion may lead to alow
IN
f value but still a highIN
e value. In other words,IN
f is more accurate in measuring the inclusion of summarizedvideo. Secondly, decreasing summarization ratio will lead to lower inclusion scores, and
IN
f values will degrade more thanIN
e values. Thirdly, it seems
15
%
is a good tradeoff between a low summarization ratio and a high inclusion values. [image:15.612.202.425.316.432.2]seen, our method yield slightly better results than the one reported in [27] under linear fusion scheme. Since the weights in [27] can be adjusted for better performance, the overall performances of the two algorithms are quite comparative. However, fewer features are needed in our algorithm and it is also nearly three times faster than the one in [27]. Regarding the method in [8], it generates the worst results in this test due to the fact that extraction of high-level semantics such as face detection is excluded. Taking this into consideration, the result is not bad as it can be further improved in video summarization context.
Table 4. Evaluation of our proposed algorithm in terms of inclusion of events and frames. The work in [8] Linear fusion in [27] Our method e
IN
81.9% 84.7% 85.1%f
IN
79.4% 81.8% 82.2%Note, an average face detection rate achieved is only 74.6% using the Haar detector, and three reasons to explain this are given as follows. The first one is the pose variation of faces in video, as Haar detector performs better only in detecting frontal faces. The second reason is the limited size of image for face detection, especially using DC-image, the smoothed small version of the original frame image. The third reason is that we only detect faces in I-frames, thus faces in B- and P- frames may be missed. Although the face detection rate is less than 75%, the
IN
f andIN
e values achieved in Table 4 is 82-85%. This has clearly shown that our proposed approach can still generate good results even the detected faces is less accurate. In other words, it means that our method does not rely on face detection. As a result, it can be applied to general videos even without human objects for content-adaptive summarization.Finally, it is worth mentioning that our system can achieve a processing speed of 128.3fps, i.e. more than 5.1 times faster than real-time play of the video. The percentage of time spend in our algorithm is summarized in Table 5 in which we can find that nearly 32% of computational load is used in calculating
GSI
, even under fast implementation of Fourier transform. Partial decoding of MPEG videos occupies about 30% of the computation capacity. These two need to be further improved.Table 5. Time spent in different stages of the algorithm.
Partial-decoding
IFD
GSI
Fuzzy decision Face detection OtherTime spent 29.8% 11.4% 31.9% 8.6% 7.1% 11.2%
VI. CONCLUSIONS
applied to any videos, although the presence of human objects helps to refine the weights in generating content-adaptive summarization. Our COI-based modeling is found not only useful in frame categorization but also helpful in activity-driven content adaptation for effective video summarization. We have introduced two measures for objective evaluation of summarization results, and it is found that our proposed methodology can generate very promising results under such a context. In addition, we have also demonstrated that compressed-domain processing is not only efficient but also effective in such a context. Further improvement could be made by introducing new techniques towards more effective presentation of COIs of varying activity levels.
ACKNOWLEDGMENT
The authors wish to acknowledge the financial support from the EU IST Framework Research Programme under both HERMES project (Contract No IST-216709) and MICIE project (Contract No IST-225353).
REFERENCES
[1]. C. W. Ngo, Y. F. Ma, and H.-J. Zhang, “Video summarization and scene detection by graph modelling,” IEEE T-CSVT, 15(2): 296-305,
2005.
[2]. S.-F. Chang and A. Vetro, “Video adaptation: concepts, technologies, and open issues,” Proceedings of the IEEE, 93(1): 148-158, 2005.
[3]. A. Hanjalic and L.-Q. Xu, “Affective video content representation and modelling,” IEEE T-Multimedia, 7(1): 143-154, 2005.
[4]. Z. Li, G. M. Schuster and A. K. Katsaggelos, “Rate-distortion optimal video summary generation,” IEEE Trans. Image Proc., 14(10):
1550-1560, 2005.
[5]. A. Hanjalic and H.-J. Zhang, “An integrated scheme for automated video abstraction based on unsupervised cluster-validity analysis,” IEEE
T-CSVT, 9(8): 1280-1289, 1999.
[6]. C. Kim and J. N. Hwang, “Object-based video abstraction for video surveillance systems,” IEEE T-CSVT, 12(12): 1128-1138, 2002.
[7]. A. Hanjalic, “Towards theoretical performance limits of video parsing,” IEEE T-CSVT, 17(3): 261-272, 2007.
[8]. Z. Cernekova, I. Pitas and C. Nikou, “Information theory-based shot cut/fade detection and video summarization,” IEEE T-CSVT, 16(1):
82-91, 2006.
[9]. Z. Li, G. M. Schuster and A. K. Katsaggelos, “MINMAX optimal video summarization,” IEEE T-CSVT, 15(10): 1245-1256, 2005.
[10].N. Babaguchi, Y. Kawai, T. Ogura and T. Kitahashi, “Personalized abstraction of broadcasted American football video by highlight
selection,” IEEE T-Multimedia, 6(4): 575-586, 2004.
[11].A. M. Ferman and A. M. Tekalp, “Two-stage hierarchical video summary extraction to match low-level user browsing preferences,” IEEE
T-Multimedia, 5(2): 244-256, 2003.
[12].X. Zhu, A. K. Elmagarmid, X. Xue, L. Wu and A. C. Catlin, “InsightVideo: toward hierarchical video content organization for efficient
browsing, summarization and retrieval,” IEEE T-Multimedia, 7(4): 648-666, 2005.
[14].A. Hanjalic, “Adaptive extraction of highlights from a sport video based on excitement modelling,” IEEE T-Multimedia, 7(6): 1114-1122,
2005.
[15].N. Dimitrova, “Context and memory in multimedia content analysis,” IEEE Multimedia, 11(3): 7-11, 2004.
[16].J. Calic, D. P. Gibson and N. W. Campbell, “Efficient layout of comic-like video summaries,” IEEE T-CSVT, 17(7): 931-936, 2007.
[17].A. G. Money and H. Agius, H. “Video summarization: a conceptual framework and survey of the state of the art,” J. Visual Commu. Image
Repres., 19(2): 121-143, 2008.
[18].S.-C. S. Cheung and A. Zakhor, “Efficient video similarity measurement with video signature,” IEEE T-CSVT, 13(1): 59-74, 2003.
[19].S.-C. S. Cheung and A. Zakhor, “Fast similarity search and clustering of video sequences on the world-wide-web,” IEEE Trans. Multimedia, 7(3): 524–537, 2005.
[20].B. T. Truong and S. Venkatesh, “Video abstraction: a systematic review and classification,” ACM T-Multimedia Computing Commun.
Appl., 3(1), Article 3: 1-37, http://doi.acm.org/10.1145/1198302.1198305, 2007.
[21].Y. Li, S.-H. Lee, C.-H. Yeh and C.-C. J. Kuo, “Techniques for movie content analysis and skimming,” IEEE Signal Proc. Magaz., 23(2):
79-89, 2006.
[22].S. X. Ju, M. J. Black, S. Minneman and D. Kimber, “Summarization of videotaped presentations: automatic analysis of motion and gesture,”
IEEE T-CSVT, 8(5): 686-696, 1998.
[23].B. L. Yeo and B. Liu, “Rapid scene analysis on compressed video,” IEEE T-CSVT, 5(6): 533-544, 1995.
[24].J. Bescos, J. M.. Martinez, L. Herranz and F. Tiburzi, “Content-driven adaptation of on-line video,” Signal Proc.: Image Communication,
22(7-8): 651-668, 2007.
[25].D. Tjondronegoro, Y. P. Chen and B. Pham, “Integrating highlights for more complete sports video summarization,” IEEE Multimedia,
11(4): 22-37, 2004.
[26].X. Zhu, J. Fan, A. K. Elmagarmid and X. Wu, “Hierarchical video content description and summarization using unified semantic and visual
similarity,” Multimedia Systems, 9(1): 31-53, 2003.
[27].J. You, G. Liu, L. Sun and H. Li, “A multiple visual models based perceptive analysis framework for multilevel video summarization,”
IEEE T-CSVT, 17(3): 273-285, 2007.
[28].Y. Takeuchi and M. Sugimoto, “User-adaptive home video summarization using personal photo libraries,” in Proc. 6th ACM Int. Conf. Image and Video Retrieval (July 9-11), Amsterdam, The Netherlands, 472-479, 2007.
[29].A. Doulamis, N. Doulamis, Y. Avrithis and S. Kollias, “A fuzzy video content representation for video summarization and content-based
retrieval,” Signal Proc., 80(6): 1049-1067, 2000.
[30].P. M. Fonseca and F. Pereira, “Automatic video summarization based on MPEG-7 descriptions,” Signal Processing: Image Communication,
19(8): 685-699, 2004.
[31].C. Papageorgiou and T. Poggio, “A trainable system for object recognition,” Int. J. Computer Vision, 38(1): 15–33, 2000.
[32].Y.-F. Ma, X.-S. Hua, L. Lu and H.-J. Zhang, “A generic framework of user attention model and its application in video summarization,”
[33].J. Ren, T. Vlachos and J. Jiang, “Subspace extension to phase correlation approach for fast image registration,” in Proc. ICIP, (1): 481-484,
2007.
[34].Y. Wang, Z. Liu and J. Huang, “Multimedia content analysis: using both audio and visual clues,” IEEE Signal Proc. Magaz., 17(6): 12-36,
2000.
[35].R. Lienhart , S. Pfeiffer and W. Effelsberg, “Video abstracting,” Communications of the ACM, 40(12): 54-62, 1997.
[36].X. Zhu, X. Wu, J. Fan, A. Elmagarmid and W. Aref, “Exploring video content structure for hierarchical summarization,” Multimedia
Systems, 10(2): 98-115, 2004.
[37].C. Gianluigi and S. Raimondo, “An innovative algorithm for key frame extraction in video summarization,” J. Real-Time Image Proc., 1(1):
69-88, 2006.
[38].M. S. Drew and J. Au, “Clustering of compressed illumination-invariant chromaticity signatures for efficient video summarization,” Image
and Vision Computing, 21(8): 705-716, 2003.
[39].L.-H. Chen, C.-W. Su, H.-Y. M. Liao and C.-C. Shih, “On the preview of digital movies,” Journal of Visual Commu. and Image Repre.,
14(3): 358-368, 2003.
[40].NIST (National Institute of Standards and Technology), TRECVID Homepage, www-nlpir.nist.gov/projects/trecvid.
[41].M. Hatzigiorgaki and A. N. Skodras, “Compressed domain image retrieval: a comparative study of similarity metrics,” Proc. SPIE, vol.
5150, 439-448, 2003.