ENVIRONMENTAL
IMPACTS OF
ECO-LOCAL FOOD SYSTEMS
– final report from
BERAS Work Package 2
Artur Granstedt, Olof Thomsson
and Thomas Schneider (eds.)
Centrum för uthålligt lantbruk
Evaluation of nitrogen utilization by
means of the concept of primary nutrient efficiency
This work is also reported as Seuri and Kahiluoto (2005) “Evaluation of nitrogen utilization by means of the concept of primary production balance” in Köpke et al. (2005) but is here somewhat revised. Nutrient balances (farm-gate balance, surface balance1 and cattle balance) only
indicate an absolute load of nutrients as a difference between input nutrients and output nutrients (kg or kg/ha). Basically they do not say anything about the efficiency of nutrient utilization.
It is also possible to calculate a ratio between output and input. This type of ratio can be used as a measure of nutrient utilization efficiency. As long as the system is simple enough, i.e. a farm without livestock and with no recycling of nutrients, the output/input ratio indicates the efficiency of nutrient utilization. However, as soon as a system involves recycled nutrients, the output/input ratio is difficult to interpret (Myrbeck 1999).
From an ecological point of view there is only one production pro-cess in the agricultural system, i.e. crop production = primary produc-tion. Primary production can either be used directly as human food or fed to animals. Nutrient load and nutrient utilization, i.e. efficiency of nutrient utilization, are two separate dimensions. If only crops are produced, the nutrient load is less than if an equal amount (in kg nitro-gen) of animal products is produced but the efficiency to utilize nutrients is equal. This is because more crop products are needed to produce an equal amount of animal products. This can be explained by two examples: A) If 1 kg nitrogen in crop products are produced and used as human food, there are some losses, let's say 0.4 kg nitrogen. These losses are also the total load.
B) If 1 kg nitrogen in animal products are produced and used as hu-man food there must first be produced some crops for fodder. Let's say we are able to produce1 kg nitrogen in animal products by 4 kg nitrogen in crops (fodder) (= cattle efficiency = 25 %). If each kg ni-trogen in fodder is produced with same efficiency than in case A, this means that total losses are 4 x 0,4 kg nitrogen = 1,6 kg nitrogen. The efficiency to utilize nitrogen on the field has been equal in both cases A and B (60 %) and equal amount of human food has been produced (1 kg nitrogen), but the total load in case A is 0,4 kg nitro-gen and in case B 1,6 kg.
In order to reduce the nutrient load there are two possibilities: either produce less or improve the efficiency of nutrient utilization. Since the amount of primary production is highly dependent on the priorities in the human diet, it can be taken as a given constant. According to this assumption, the harvested yield (Y) to external nutrient input (= primary nutrients, P) ratio alone indicates the nutrient utilization in any system.
Pentti Seuri, MTT Agrifood Re-search, Finland
The concept of primary nutrient efficiency (PNE) is based on this fact (Seuri 2002) but now renamed. Earlier it was called primary production balance (PPB).
The aims of this study were:
• To introduce a new method, primary nutrient efficiency, for the evaluation of nutrient utilization
• To demonstrate and find the key factors to reach a high utilization rate of nutrients
Material and methods
A deeper analysis was made of nitrogen utilization on nine organic farms in eastern Finland, referred to as J-BERAS-farms earlier in this chapter and in Appendix 2. Data was collected in 2004 by personally interviewing farmers. An overall picture was drawn of how the farms were functioning and, to ensure the validity of data, the results were discussed personally with each farmer. The estimations of harvested yield (dry matter & nitrogen) were adjusted with the number of animals and total animal production. The nitrogen contents of all organic materials within the system (crops, fodder, bedding materials, seeds, animal products, and purchased manure) were estimated by means of standard figures, unless measured values were available. Atmospheric deposition, 5 kg nitrogen/ha, was included as an input.
All the main nutrient flows were identified. However, because of the steady-state assumption (i.e. balanced systems, no change in re-serve nutrients in soil) and estimation of biologically fixed nitrogen the results may include some error.
Biological nitrogen fixation (BNF) was estimated based on harves-ted legume yield: the assumption was 50 kg nitrogen per 1000 kg harvested dry matter of legume. That means that roughly 70 % of the total nitrogen content in the legume biomass originated from BNF. This assumption was derived from the Swedish STANK model (STANK 1998), the Danish model by Kristensen et al. (1995) and the Finnish model by Väisänen (2000). On all farms the most important legume was red clover. However, some white clover and alsike clover were grown in perennial ley mixtures as well. Besides peas, which was the most important annual legume crop, some annual vetch was grown.
The farm-gate efficiency, surface efficiency and primary nutrient efficiency (PNE) were calculated for each individual farm (Table 2-2). The primary nutrient efficiency can be calculated from the following two equations (Seuri 2002):
(I) PNE = Y/P
where Y = total harvested yield and P = primary nutrients (= external nutrients)
(II)PNE = U * C
where U = utilization rate (= surface efficiency) and C = circulation factor = (P + S)/P
Equation (I) follows the definition of PNE. Equation (II) illustrates two components of PNE: utilization rate, which is equal to surface efficiency, and circulation factor, which indicates the extent of recirculated nutrients in the system. There is a major difference between farms with and without livestock. Since there are no recirculated nutrients (S) on farms without livestock, the circulation factor is always 1.0. On farms with livestock the circulation factor is always higher than 1.0.
To illustrate the difference between primary and secondary nutrients and to point out the role of recirculation in improving nutrient utilization, some simple simulations were made on two farms without livestock, farms 8 and 9. The farms produce some fodder and receive some farmyard manure (FYM) from the neighbouring farm. The initial efficiency (A) indicates utilization in a case where manure from the neighbouring farm is an external nutrient input (primary nutrient). The simulated efficiency (B) indicates the utilization in a case where all the harvested fodder yield is used on the farm for dairy cattle. It is assumed that 25 % of the nitrogen in the fodder is sold out from the farm in the form of milk and beef and 25 % is lost in the gaseous form before the manure is spread on the field. The rest of the nitrogen (50 %) remains in the manure.
The average utilization rate of the primary nitrogen in the agri-culture in Finland was calculated from statistics. Rough estimations and comparisons were made between the farms in this study and national average utilization rates.
Results and discussion
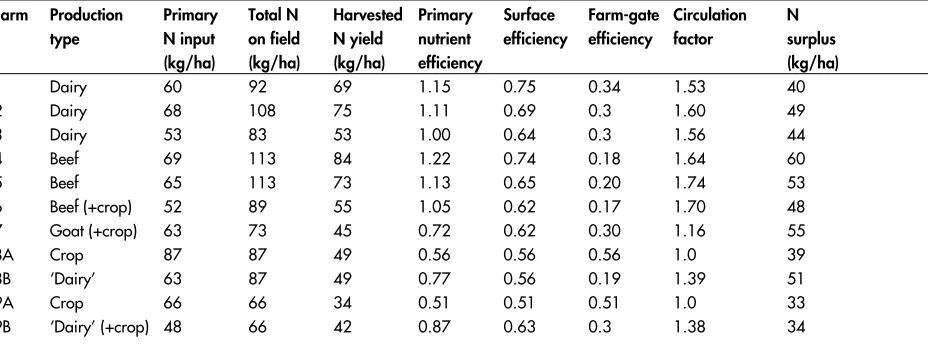
[image:4.595.60.524.598.771.2]The PNE of nitrogen fell in the range 1.0–1.2 on all mixed farms except for farm 7, i.e. the farms were able to harvest more nitrogen than they received as an input into the crop production from outside the farm (including fixation). Both farms without livestock reached a PNE down around 0.5; the dairy farm simulation increased the PNE up to 0.8.
Table 2 2. Comparison between primary nutrient efficiency (PNE), surface efficiency (SE) and farm-gate efficiency (FGE) of nitrogen on nine organic farms in eastern Finland. Farms 8B and 9B are simulated from 8A and 9A, respectively.
Farm Production Primary Total N Harvested Primary Surface Farm-gate Circulation N
type N input on field N yield nutrient efficiency efficiency factor surplus
(kg/ha) (kg/ha) (kg/ha) efficiency (kg/ha)
1 Dairy 60 92 69 1.15 0.75 0.34 1.53 40
2 Dairy 68 108 75 1.11 0.69 0.3 1.60 49
3 Dairy 53 83 53 1.00 0.64 0.3 1.56 44
4 Beef 69 113 84 1.22 0.74 0.18 1.64 60
5 Beef 65 113 73 1.13 0.65 0.20 1.74 53
6 Beef (+crop) 52 89 55 1.05 0.62 0.17 1.70 48
7 Goat (+crop) 63 73 45 0.72 0.62 0.30 1.16 55
8A Crop 87 87 49 0.56 0.56 0.56 1.0 39
8B ‘Dairy’ 63 87 49 0.77 0.56 0.19 1.39 51
9A Crop 66 66 34 0.51 0.51 0.51 1.0 33
The surface efficiency (SE) of nitrogen fell in the range 0.6–0.75 on all mixed farms and by definition PNE and SE are identical (around 0.5) in a system without livestock, i.e. in any system without recirculated nutrients. The Farm Gate Efficiency (FGE) of nitrogen correlated strongly with production type, being around 0.3 on dairy farms and around 0.2 on beef farms. Analogously to PNE and SE, also FGE was identical on farms with no livestock (around 0.5). The dairy farm simulation dec-reased the FGE down to 0.19 on farm 8 and down to 0.3 on farm 9.
Simulation on farm 8 shows clearly the role of recirculation and the difference between PNE and SE. On farm 8, the only difference between the real farm and the simulated farm is the method of defini-tion of the origin of input nitrogen, i.e. the initial yield harvested and the initial amount of nitrogen available in the field are exactly the same. On farm 8A, all the nitrogen in the farm yard manure (FYM) from the neighbouring farm is considered as primary nitrogen analogous to the nitrogen in artificial fertilizers or the nitrogen from BNF. This is analogous to any nitrogen input that increases the total amount of ni-trogen in the system. On farm 8B, the nini-trogen in the FYM from the neighbouring farm is considered as secondary nitrogen analogous to the nitrogen in FYM originating from the farm. This is analogous to any recycled nitrogen that does not increase the total amount of nitro-gen in the system. However, the SE method does not identify the origin of the nutrients in the field, i.e. unlike PNE, SE remains constant on farm 8. The higher PNE value on the simulated farm 8B indicates higher efficiency of primary nitrogen utilization, thereby a lower nitrogen load potential.
On farm 9B there are some green manure fields, from where yield is harvested instead of ploughing directly. Therefore also the SE is influenced by simulation on farm 9, but otherwise it is analogous to farm 8.
In Finland (1995–1999), calculations of nitrogen balance in agri-culture show that the annual total primary nitrogen input (artificial fertilizers, atmospheric deposition and symbiotically fixed nitrogen) is about 100 kg/ha. The total harvested nitrogen yield is about 74 kg/ha, (Lemola & Esala 2004). Thus, the PNE in agriculture averages 74 kg/ha /100 kg/ha = 0.74, indicating a serious lack of nutrient re-cycling. However, there is huge potential to recycle nutrients in agriculture, because 80 % of the total crop yield is used as animal fodder.
In this study, all the livestock farms exceeded the value 0.74. They ranged from 0.8–1.2, with an average around 1.0. The high PNE for nitrogen was due not only to recycling but also to biological nitrogen fixation. The main source of primary nitrogen input was symbiotic fixed nitrogen by legumes. The utilization rate of nitrogen by legumes is clearly higher than for any other source of nitrogen into a system. In most cases about the same amount of nitrogen was harvested as was symbiotically fixed, i.e. the utilization rate is approximately 100 %.
production) was of major importance in reaching a high PNE. Whenever the livestock density was increased by means of purchased fodder, the utilization of farmyard manure was poor and resulted in lower PNE (farms 3, 6 and 7). Self-sufficient fodder production was the optimum. The farms with high PNE had also a slightly higher yield level than farms with lower PNE.
On the other hand, the two organic farms without livestock indicated that without recirculation an organic system cannot utilize nitrogen very efficiently. On these farms the primary source of nitro-gen consisted of legumes, but because the legume crop was partly used as green manure, there were heavy losses of nitrogen resulting in a lower total PNE.
Conclusions
It was fairly easy to calculate the primary nutrient efficiency (PNE) for each of the nine farms included in this study. The estimation of biological nitrogen fixation and harvested nitrogen yield are, however, obvious sources of error. The assumption of steady state is not necessarily valid in all cases.
Even though crop production causes only minor nutrient load compared with animal production, it does not necessarily mean that crop farms utilize nutrients effectively. Using the PNE it is easy to compare different farms. The results of this study show clearly that livestock farms are able to reach a remarkably higher PNE compared with crop farms despite the very low farm-gate efficiency on livestock farms.
References
Anon. 2001. The Bichel Committee 1999. Report from the Bichel Committee – Organic Scenarios for Denmark. Report from the Interdisciplinary Group of the Bichel Committee. http:// www.mst.dk/udgiv/Publications/2001/87-7944-622-1/html/ default_eng.htm , 1-118.
Berntsen, J., Petersen, B. M., Kristensen, I. S., and Olesen J. E. 2004. Nitratudvaskning fra økologiske og konventionelle planteavlsbedrifter. - simuleringer med FASSET bedriftsmodellen. http://www.foejo.dk/publikation/a_rap.html#Anchor-Nitratudvasknin-62817 . DJF rapport.Markbrug 107, 1-43. Brandt, M. & Ejhed, H. 2002. TRK Transport – Retention – Källfördelning.
Belastning på havet. Naturvårdsverket, SE-106 48 Stockholm, Rap-port 5247, 120 p.
Brink, N. 1990. Land Use Changes in Europe. Process of Change, Environmental Transformation and Future Patterns (F. M. Brower editor). Kluwer Academic Publishers; London.
Eco-systems and Environment 80(1-2), 169-185.
Granstedt, A., Seuri, P. & Thomsson, O. 2004. Effective recycling agriculture around the Baltic Sea. Background report. BERAS 2. Ekologiskt lantbruk 41. Centre for Sustainable Agriculture. SLU. Uppsala
HELCOM 1998. The Third Baltic Sea Pollution Load Compilation (PLC-3). Baltic Sea Environ proc. No. 70.
HELCOM. 2004. The Fourth Baltic Sea Pollution Load Compilation (PLC-4). Helsinki Commission, Baltic Marine Environment Protection Commission, Baltic Sea Environment Proceedings No. 93.
Høgh-Jensen, H., Loges, R., Jensen, E. S., Jørgensen, F. V., and Vinther, F. P. 2003. Empirical model for quantification of symbiotic nitro-gen fixation in leguminous crops. Agricultural Systems http:// www.orgprints.org/, 1-31.
Jordbruksverket. 1998. Statens Jordbruksverks dataprogram för växtnäringsbalansberäkning. Stallgödsel och växtnäring i krets-lopp (STANK) Jordbruksverket, Jönköping. (Plant nutrient balance calculation program)
Knudsen, M. T., Kristensen, I. S., Berntsen, J., Petersen, B. M., and Kristen-sen, E. S. 2005. The effect of organic farming on N leaching. Sub-mitted. Journal of Agricultural Science , 1-35.
Kristensen, I. S. 2002. Principles and methods for collecting and evaluation nutrient balances, 29-40. http://www.agrsci.dk/jbs/ demolit/Principles%20and%20methods.pdf , Danish Institute of Agricultural Science. Lithuanian Dairy Farms Demonstration Project.
Kristensen, I. S. 2005. Nitrogen balance from dairy farms (2002). http:/ /www.lcafood.dk/processes/agriculture/N_balance_ dairyfarms_2002.htm#table_1 .
Kristensen, I. S., Dalgaard, R., Halberg, N., and Petersen, B. M. 2005a. Kvælstofbalance og -tab fra forskellige bedriftstyper. Plantekong-res 2005. http://www.lr.dk/planteavl/diverse/PLK05_11_1_3_I_S_ Kristensen.pdf og http://www.lr.dk/planteavl/diverse/ plk05_11_1_3_i_s_kristensen.ppt . Planteproduktion i landbruget, 1-2.
Kristensen, I. S., Halberg, N., Nielsen, A. H., and Dalgaard, R. 2005b. N-turnover on Danish mixed dairy farms. Part II. In: Bos, J.; Pflimlin, A., Aarts, F. and Vertés, F.(Eds): "Nutrient management on farm scale. How to attain policy objectives in regions with intensive dairy farming. Report of the first workshop of the EGF Workshop. http:/ /www.agrsci.dk/var/agrsci/storage/original/application/ 57b9a70804960c2c9f54ad255b11f22d.pdf . Plant Research Interna-tional. 83, 91-109.
Kus, J., Kopinski, J., Stalenga J. & Tyburski, J. 2004. Rolnictwo ekologiczne a spoleczenstwo i srodowisko. Raport naukowy. Lipiec.
Köpke, U., Niggli, U., Neuhoff, P.C., Lockeretz, W. & Willer, H. (eds.) 2005. Researching Sustainable Systems. Proceedings of the First Scientific Conference of the International Society of Organic Agriculture Research (ISOFAR), Held in Cooperation with the In-ternational Federation of Organic Agriculture Movements (IFOAM) and the National Association for Sustainable Agriculture, Australia (NASAA), 21–23 September 2005, Adelaide Convention Centre, Adelaide South Australia. pp. 48–51
Lemola, R. & Esala, M. 2004. Typen ja fosforin virrat kasvintuotannossa. AESOPUS-hankkeen loppuseminaari 4.11.2004. SYKE, Helsinki. (Nitrogen and phosphorus flows in agriculture. Seminar on the AESOPUS project 4.11.2004. Finnish Environment Institute, Helsinki.)
Mikkelsen, M.H., Gyldenkærne, S., Poulsen, H. D., Olesen, J. E., and Sommer S. G. 2005. Opgørelse og beredningsmetode for landbru-gets emissioner af ammoniak og drivhusgasser 1985-2002. Arbejds-rapport fra DMU. [204].1-84
Myrbeck, Å. 1999. Nutrient flows and balances in different farming systems - A study of 1300 Swedish farms. Bulletins from the Divi-sion of Soil Management, Department of Soil Sciences, Swedish University of Agricultural Sciences. 30: 1-47, 11 app.
Nielsen, A. H. & Kristensen, I. S., 2005. Nitrogen and phosphorus surpluses on Danish dairy and pig farms in relation to farm char-acteristics. Livestock prod. science no. 96, 97-107.
Seuri, P. 2002. Nutrient utilization with and without recycling within farming systems. In: eds. Magid et al. Urban Areas - Rural Areas and Recycling - the Organic Way Forward? DARCOF Report 3: p. 175-181. http://www.agsci.kvl.dk/njf327/papers/NJF-Co-development.pdf
SCB. 2002. Kväve och fosforbalanser för svensk åkermark och jordbruks-sektor 2000. (In Swedish with English summary: Nitrogen- and phosphorus balances in arable land and agricultural sector in Sweden 2000). Statistics Sweden, 34 pp.
Stein-Bachinger, K., Bachinger, H. & Schmitt, L. 2004. Nährstoffmanagement im Ökologischen Landbau. Ein Handbuch für Beratung und Praxis. KTBL Schrift 423. Kuratorium für Technik und Bauwesen in der Landwirtschaft e.v. (KTBL), Darmstadt. Väisänen, J. 2000. Biological nitrogen fixation in organic and