Computer model for simulating the long-term dynamics
of annual weeds under different cultivation practices
I.A. Rasmussen, N. Holst, L. Petersen, K. Rasmussen Department of Crop Protection
Danish Institute of Agricultural Sciences, Research Centre Flakkebjerg,
DK-4200 Slagelse, Denmark
Abstract
A model is being developed which describes the population dynamics of annual weeds and how it is affected by crop rotation, cultivation practices and weed control. The model aims to predict the development of a certain weed species in order to plan crop rotation and cultivation practices to minimize the risk of proliferation. The model does not predict the exact number of weeds expected to be found in a certain year or crop, but rather the general development over a number of years. The model includes documented knowledge, as well as informal expert knowledge, on seed survival in the soil, seed placement in soil after tillage, seed germination with respect to placement in soil, time of year and tillage, weed development in response to crop competitiveness and seed production of the weeds. The model is at present only accounting for the development of one weed species at a time, and only a few weed species are parameterised. However, the model can easily be extended with more weed species, crops and cultivation practices. Model predictions should match what knowledgeable weed scientists already know, perhaps with a little new insight.
Introduction
Weed control alone is not always enough to prevent proliferation of a certain weed species. This is particularly the case in organic farming, where the efficacy of mechanical weed control often is low. Because of this, many preventive methods including tillage, crop rotation, augmentation of the competitiveness of the crop against the weed, sowing time and harvest time etc. are included in the weed control strategy – particularly in organic farming (Kropff et al. 2000; Rasmussen et al. 2000).
A diversified crop rotation can prevent proliferation of a single weed species, since the demands of most weed species in terms of germination, growth and propagation cannot be met if sowing time, crop growth and harvest time are varied between years. An example is that winter annual species germinate primarily in the fall and their establishment is less successful in spring-sown crops than in crops spring-sown in the fall. Experiments have shown that some of the problems with grass weeds, which can arise in crop rotations dominated by winter cereals, can be alleviated by incorporating larger proportions of spring cereals in the rotation (Melander 1993).
The competitiveness of the crop against the weeds is a very important parameter for the growth and propagation of the weeds. Choice of cultivar, seed rate, quality of the seedbed, row distance and geometrical arrangement, fertiliser level and fertiliser application/placement are among the most important factors influencing crop competitiveness (Espeby 1989; Kropff & van Laar 1993; Christensen & Rasmussen 1996; Weiner et al. 2001).
There are many possibilities to prevent weed problems, but they have to be planned well in advance. Optimally, for a certain crop rotation, there would be a strategy for the utilisation of preventive methods within that crop rotation. The need for direct control should be restricted to as little as possible. However, it is quite complicated to characterize the way the different methods interact in the crop rotation and how the crop rotation itself may influence the weed proliferation.
In order to illustrate this, a computer model has been developed which describes the development of different annual weed species under different scenarios. The purpose of the model is to define the development in order to choose the best management to avoid proliferation of a certain weed. The model does not attempt to predict the exact number of weeds likely to germinate in any certain year, but to predict a general trend in the development over a course of several years. As such, it is not a decision support system to plan control in a given crop, but a management support system to plan crop rotation and other cultural measures to decrease reliance on high control efficacy.
Materials and Methods
Modelling approach
Several models have been published, which describe the proliferation of field weeds (Cousens & Mortimer 1995). The system components and processes incorporated in these models reflect the interest of the modeller and the purpose of the model and include soil seed bank, germination, establishment, growth, competition, and seed production. Most of these models work in time steps of one year and under the common assumption that all individuals of a weed species germinate and shed seeds at the same time. Such models are well suited to describe the proliferation of a weed under uniform cropping conditions, such as grass weed propagation in no-till, continuous winter cereals. In contrast, models with a finer time step can capture the variation within a year. Most weed species emerge and shed seeds unevenly through the year; for example, new emergence is often seen after rain or tillage. Within a competitive crop, latecomers will suffer a high mortality thus depleting the soil seed bank, whereas in less competitive crops, plants are more likely to thrive and eventually contribute to the seed bank. To grasp such within-year processes, models with a time step finer than one year are needed. Thus Christensen et al. (1999), based upon the matrix model approach of Silvertown (1987), developed a model that operated in time steps of 14 days. This facilitated the modelling of weed cohorts, having emerged at different times through the year, and the effect of various control measures in different crop rotations could be predicted based upon the knowledge put into the model.
The model presented here is a continuation of this line of work. As a guideline for model design, we wish to keep it simple so that it can easily be extended with additional weed species, crops and cultivation practices. At the same time, we wish to maintain the overall realism so that the model can offer guidance on weed management through targeted planning of cropping cycle and cultivation practices. Model predictions should match what knowledgeable weeds scientists already know, perhaps with a little surprise and new insight now and then.
Weed life stages
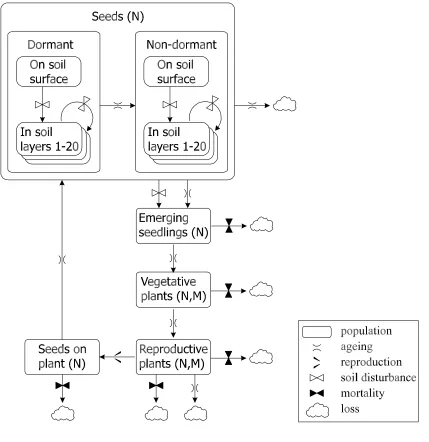
Our weed model is stage-structured (Fig. 1) and incorporates each life stage as a separate sub-population: number of seeds in or on the ground, or still fastened to the plant; number of emerging seedlings; number and mass of plants in the vegetative and the reproductive growth stage. In the first version of the model, the population dynamics of each weed species is considered separately with no inter-specific competition other than between crop and weed. The time step of the model is 1 day. The vertical distribution of seeds in the soil is kept in 20 1-cm layers. Seed dormancy takes many forms (Baskin & Baskin 1998) but only primary dormancy is included directly in the model.
equations, e.g., for ploughing at 16 cm depth, the four layers would each be considered 4 cm thick. Mechanical weed control, which properly operated only disturb the top cm of the soil, is assumed not to shift seeds around, except mixing seeds from the soil surface into the top layer.
[image:3.595.57.486.193.635.2]In undisturbed soil seeds will perish at a rate specific to the species. In the model we use the mortality rates determined by Chancellor (1986), which leads to an exponential decrease in seed numbers. For lack of knowledge we assumed mortality rates to apply equally to seeds at all soil depths. For seeds upon the soil surface we assumed a fixed mortality rate per day-degree common to all species. This mortality is thought primarily to be caused by non-specific predation by insects and birds.
Figure 2. Seed emergence depending on soil depth summarised by log-normal curves (data after Chancellor 1964).
Relat
ive ger
m
inat
ion
0.0 0.1 0.2 0.3 0.4 0.5 0.6 0.7 0.8 0.9 1.0
Chamomilla recutita Stellaria media Soil depth (cm)
0 1 2 3 4 5 6 7 8 9 10
R
elati
ve
g
er
m
in
ation
0.0 0.1 0.2 0.3 0.4 0.5 0.6 0.7 0.8 0.9 1.0
[image:4.595.62.438.460.722.2]The germination rate of seeds depends on their vertical position in the soil, as described by
Chancellor (1964). Based on his data we could summarise for each species the relative germination rate according to depth by a log-normal curve (Fig. 2). Furthermore, the propensity of seeds to germinate varies with the season. Sophisticated models of germination have been developed, incorporating the effects of soil temperature and humidity (Forcella 1998; Forcella et al. 2000) and dormancy (Vleeshouwers 1997; Benech-Arnold et al. 2000). However, we chose a simpler
approach, because we are interested only in the typical course over the year of the weed life cycle and how it interacts with the typical timing of cultivation practices. Thus the phenology of
germination was described, for each species, by a relative measure of germination for each calendar month, linearly interpolated to yield daily values (Fig. 3). These species-specific germination curves were determined by experts based on formal (Håkansson 1983; Chancellor 1986) and informal knowledge.
The number of seeds germinating from a certain soil layer on a specific date can now be obtained be multiplying the two relative rates (from Figs. 2 and 3) with the germination rate in undisturbed soil specific to the weed species. On dates when the soil is disturbed (to a certain depth by a certain cultivation practice), additional germination will occur. This is calculated multiplying the two relative rates with the maximum germination rate (determined experimentally under optimal conditions).
Weed growth and reproduction
The development through the life stages, emergence, vegetative and reproductive growth (Fig. 1), is modelled on a day-degree scale. For simplicity, competition is modelled for mass only, and
numbers are translated into the projected final weed biomass, as plants leave the seedling stage and enter the vegetative stage.
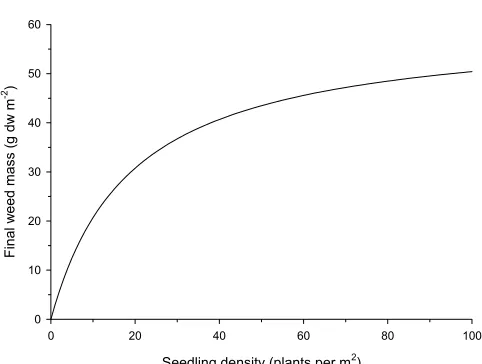
[image:5.595.63.304.531.713.2]The final biomass of the weed is calculated by multiplying the effect of intra-specific competition (Fig. 4) with the effect of the crop (Fig. 5), on the day the weeds shift from the emergence to the vegetative growth stage. The relation for intra-specific competition (Fig. 4) concerns the total number of seedlings emerging and not just those emerging on a single day. The effect of taking this into account is that those that emerge first are allotted a larger share of the final biomass than those that emerge later, which makes sense biologically.
Figure 4. Example of how final, maximum weed biomass is calculated from seedling density.
Seedling density (plants per m2)
0 20 40 60 80 100
F
inal w
eed
m
ass (
g dw
m
-2)
Figure 5. The phenology of crop competitiveness in a field with a spring-sown followed by an autumn-sown crop (dotted line), and the relative final biomass that the weed population would achieve if it emerged at a certain date (full line).
Seed production is assumed to happen at a fixed daily rate, specific to each species, which is proportional to the weed mass in the reproductive stage (Rasmussen 1993; Wilson et al. 1995).
Weed mortality caused by cultural practices
The effect of cultural practices depends on the mode of intervention (seeding, harrowing, ploughing, herbicide treatment, various mechanical weed control methods) and the life stage of the weed; seeds are unaffected (other than vertical movement: from plant to soil, from surface into soil, and between layers within soil), seedlings are the most sensitive, plants in the vegetative growth stage less sensitive, and reproductive plants the least sensitive. Effects are specified as the percentage mortality caused by each kind of cultural practice for each of the three susceptible life stages. In addition, the mortality caused by harvesting (removal) on seeds still on the plant can be specified.
Parameters for the model
Currently, model parameters are being estimated from literature data or, when information is lacking, from informal expert knowledge. Important literature sources include (Stevens 1932; Chancellor 1964; Holm et al. 1991; Moss 1985; Chancellor 1986; Legere & Deschenes 1989; Milberg 1990; Cousens & Moss 1990; Baskin & Baskin 1998; Bouwmeester 2001).
Evaluation of the model
At this early stage, the only evaluation carried out on the model is an expert panel assessing the results retrieved from the runs of the model under different scenarios. However, a great body of data from experiments over a long period of time with a record of crop rotation and cultivations, some with and without weed control, chemical as well as mechanical, will later be used to evaluate the model in a more objective manner.
Jan Feb Mar Apr May Jun Jul Aug Sep Oct Nov Dec
Fi nal w eed bio m as s -or - C rop c om petiv enes s 0.0 0.1 0.2 0.3 0.4 0.5 0.6 0.7 0.8 0.9 1.0
Acknowledgements
This work is supported by a grant from The Danish Directorate for Food, Fisheries and Agro Business.
References
BASKIN CC & BASKIN JM (1998) Seeds - Ecology, Biogeography, and Evolution of Dormancy
and Germination. Academic Press, San Diego, California.
BENECH-ARNOLD RL, SÁNCHEZ RA, FORCELLA F, KRUK BC, & GHERSA CM (2000)
Environmental control of dormancy in weed seed banks in soil. Field crops research 67, 105-122.
BOUWMEESTER HJ (2001) The effect of environmental conditions on the annual dormancy
pattern of seeds of Spergula arvensis. Canadian Journal of Botany 71, 64-73.
CHANCELLOR RJ (1964) The depth of weed seed germination in the field. In: Proceedings of the
7th British Weed Control Conference, 606-613.
CHANCELLOR RJ (1986) Decline of arable weed seeds during 20 years in soil under grass and the
periodicity of seedling emergence after cultivation. Journal of Applied Ecology 23, 631-637. CHRISTENSEN S & RASMUSSEN G (1996) Crop-weed competition and choice of variety, seed rate and drilling date in winter wheat (Original title: Konkurrence mellem afgrøde og ukrudt i relation til sortsvalg, såmængder og såtider i vinterhvede. With English summary). In: 13. Danske
Planteværnskonference, Ukrudt, SP-rapport nr. 3, 103-112.
CHRISTENSEN S, RASMUSSEN K, MELANDER B & RASMUSSEN G (1999) Weed management in organic crop rotations. (Original title: Forebyggelse og regulering af ukrudt i økologiske sædskifter. With English summary) In: 16. Danske Planteværnskonference,
Plantebeskyttelse i økologisk jordbrug, sygdomme og skadedyr. DJF Rapport Markbrug nr. 10,
41-53.
COUSENS R & MORTIMER M (1995) Dynamics of Weed Populations. Cambridge University
Press, Cambridge, UK.
COUSENS R & MOSS SR (1990) A model of the effects of cultivation on the vertical distribution
of weed seeds within the soil. Weed Research 30, 61-70.
ESPEBY L (1989) Germination of weed seeds and competition in stands of weeds and barley.
Influences of mineral nutrients. Crop Production Science, Sveriges lantbruksuniversitet, 6, 1-172.
FORCELLA F (1998) Real-time assessment of seed dormancy and seedling growth for weed
management. Seed science research 8, 201-209.
FORCELLA F, BENECH-ARNOLD RL, SANCHEZ R & GHERSA CM (2000) Modelling
seedling emergence. Field crops research 67, 123-139.
HÅKANSSON S (1983) Seasonal variation in the emergence of annual weeds - an introductory
investigation in Sweden. Weed Research 23, 313-324.
HOLM LG, PLUCKNETT DL, PANCHO JV & HERBERGER JP (1991) The World’s Worst
Weeds, Distribution and Biology. Krieger Publishing Company, Malabar, Florida.
KROPFF MJ, BAUMANN DT, BASTIAANS L (2000) Dealing with weeds in organic agriculture – challenge and cutting edge in weed management. In: Proceedings 13th IFOAM Scientific
Conference: IFOAM 2000: the world grows organic, Basel, 175-177.
KROPFF MJ & VAN LAAR HH (1993) Modelling crop-weed interactions. CAB International,
Walingford, UK.
LEGERE A & DESCHENES JM (1989) Effects of time of emergence, population density and
interspecific competition on Hemp-Nettle (Galeopsis tetrahit) seed production. Canadian Journal
of Plant Science 69, 185-194.
MILBERG P (1990) Hur länge kan ett frö leva? (With English summary) Svensk botanisk tidskrift 84, 323-351.
MOSS SR (1985) The survival of Alopecurus myosuroides Huds. seeds in soil. Weed Research 25,
201-211.
RASMUSSEN IA (1993) Seed production of Chenopodium album in spring barley sprayed with different herbicides in normal to very low doses. In: 8th EWRS Symposium "Quantitative
approaches in weed and herbicide research and their practical application", Braunschweig,
639-646.
RASMUSSEN IA, MELANDER B, RASMUSSEN K et al. (2000) Recent advances in weed management in cereals in Denmark. In: Proceedings 13th IFOAM Scientific Conference: IFOAM
2000: the world grows organic, Basel, 178.
SILVERTOWN J (1987) Introduction to Plant Population Ecology. Longman Scientific &
Technical, Essex.
STEVENS OA (1932) The number and weight of seeds produced by weeds. American Journal of
Botany 19,784-794.
VLEESHOUWERS LM (1997) Modelling weed emergence patterns. PhD thesis, Wageningen
Agricultural University.
WEINER J, GRIEPENTROG H-W & KRISTENSEN L (2001) Suppression of weeds by spring
wheat Triticum aestivum increases with crop density and spatial uniformity. Journal of applied
ecology 38,784-790.
WILSON BJ, WRIGHT KJ, BRAIN P, CLEMENTS M & STEPHENS E (1995) Predicting the