Modelling representative and coherent Danish farm types based on
farm accountancy data for use in environmental assessments
Randi Dalgaard
a,b,*
, Niels Halberg
a, Ib S. Kristensen
a, Inger Larsen
c aDanish Institute of Agricultural Sciences, PO Boks 50, 8830 Tjele, Denmark b
Department of Development and Planning, Aalborg University, Fibigerstræde 13, 9220 Aalborg East, Denmark cFood and Resource Economic Institute, Rolighedsvej 25, 1958 Frederiksberg C., Denmark
Received 9 November 2005; received in revised form 23 March 2006; accepted 3 April 2006
Abstract
There is a need for valid and representative data on the production, resource use and emissions from different farm types in Denmark for public regulation and assessment. The data should be usable for both area-based environmental assessment (e.g. nitrate leaching per ha) and product-oriented environmental assessment (e.g. greenhouse gas emissions per kg pork). The objective of this study was to establish a national agricultural model for estimating data on resource use, production and environmentally important emissions for a set of representative farm types.
Every year a sample of farm accounts is established in order to report Danish agro-economical data to the ‘Farm Accountancy Data Network’ (FADN), and to produce ‘The annual Danish account statistics for agriculture’. The farm accounts are selected and weighted to be representative for the Danish agricultural sector, and similar samples of farm accounts are collected in most of the European countries. Based on a sample of 2138 farm accounts from year 1999 a national agricultural model, consisting of 31 farm types, was constructed. The farm accounts were grouped according to the major soil types, the number of working hours, the most important enterprise (dairy, pig, different cash crops), livestock density, etc. For each group the farm account data on the average resource use, products sold, land use and herd structure were used to establish a farm type with coherency between livestock production, feed use, land use, yields, imported feed, homegrown feed, manure production, fertilizer use and crop production. The set of farm types was scaled up to national level thus representing the whole Danish agricultural sector and the resulting production, resource use and land use was checked against the national statistics. Nutrient balance methodology and state-of-the-art emission models and factors were used to establish the emissions of nitrate, phosphate, ammonia, nitrous oxide, methane and fossil carbon dioxide from each farm type. In this paper data on resource uses and emissions from selected farm types are presented and it is demonstrated that this approach can lead to an agro-environmental inventory, which is consistent with national level estimates and still has the advantage of being disaggregated to specific farm types. Conventional dairy farm types in general emitted more nitrate but less phosphate compared with pig farm types. The methane emission was higher from dairy farm types compared with all other farm types. In general the conventional dairy farms emitted more nitrate, ammonia, and nitrous oxide, compared with organic dairy farms.
#2006 Elsevier B.V. All rights reserved.
Keywords:Agriculture; Environmental assessment; Environmental impact; Emissions inventory; Nutrient balances
1. Introduction
Agricultural production has an impact on the environ-ment on a local scale (e.g. nitrate leaching to fens) and on a global scale (e.g. greenhouse gas emissions to the
atmo-sphere). In order to identify the most polluting sources of the agricultural production it is crucial to use well-defined environmental indicators and valid data to describe resource use and emissions from different farm types.
Environmental indicators developed for agricultural purposes have recently been reviewed by Halberg et al.
(2005)andPayraudeau and van der Werf (2005).Halberg
et al. (2005) distinguish between area-based indicators
www.elsevier.com/locate/agee Agriculture, Ecosystems and Environment xxx (2006) xxx–xxx
* Corresponding author. Tel.: +45 8999 1254; fax: +45 8999 1200.
E-mail address:[email protected](R. Dalgaard).
0167-8809/$ – see front matter#2006 Elsevier B.V. All rights reserved.
doi:10.1016/j.agee.2006.04.002
AGEE-2815; No of Pages 15
Archived
at
(e.g. nitrate leaching per ha) and product-based indicators (e.g. greenhouse gas emissions per kg product) and conclude that both types of indicators are needed in order to comprehensively characterise environmental impacts from food production.
Area-based indicators are useful for evaluating farms emissions of nutrients such as nitrate, ammonia and phosphate that all have an effect on the local environment. In several studies (Jarvis and Aarts, 2000; Haas et al., 2001; Holbeck and Hvid, 2004; Jarvis and Menzi, 2004; Kristensen et al., 2005a;
Nielsen and Kristensen, 2005) area-based indicators have
been used to compare nutrient surpluses from different farm types. As data-collection from farms is time-consuming, these studies are based on a limited number of farms and are not statistically representative for the agricultural sector. The lack of representative data for environmental indicators and assessment may be misleading because results such as comparison between farm types may be highly influenced by individual farm performances.
Product-based indicators are useful for evaluating the impact of food productions on the global environment (e.g. climate change) and have the advantage that in addition to emissions from the farms, emissions related to the production of inputs (e.g. soybean, artificial fertilizer) and outputs (e.g. manure exported to other farms) are also included. Life-cycle thinking is the basic idea behind the product-based indicators.
Life-cycle thinking is one of five key principles in the European Union’s Integrated Product Policy (IPP) ( Eur-opean Commision, 2003) and is also supported by the United Nations Environmental Programme (UNEP, 2004). In Life-cycle thinking the cradle-to-grave approach for a product is adopted to reduce its cumulative environmental impacts
(European Commision, 2003). The most developed tool for
life-cycle thinking is life cycle assessment (LCA), which is a method of evaluating a product’s resource use and environmental impact throughout its life-cycle. LCA has been used for environmental assessment of milk (Cederberg and Mattsson, 2000; Haas et al., 2000; Thomassen and de Boer, 2005), pork (Cederberg and Flysjo¨, 2004; Eriksson et al., 2004; Basset-Mens and van der Werf, 2005), grains (Weidema et al., 1996) and other agricultural products, but most of the existing LCAs are based on data from only one or a few farms. However, there is considerable variation in the resource use and emissions between farms of the same main enterprise (Halberg, 1999; Haas et al., 2000; Weidema
et al., 2002; Thomassen and de Boer, 2005) and it is
therefore unsatisfactory to base evaluation and comparison of agricultural products on case studies.
In order to produce representative area-based and product-based environmental indicators, there is a need for representative and valid farm data that describes resource use and emissions from typical farms.
Poppe and Meeusen (2000) and Halberg et al. (2000)
proposed basing environmental assessments on representa-tive farm accounts such as those collected for The Farm
Accountancy Data Network (FADN). The aim of FADN is to gather accountancy data from farms for income determina-tion and business analysis of agricultural holdings. The annual sample of FADN covers approximately 80,000 holdings in Europe, that represent about 5,000,000 farms, thus covering approximately 90% of the agricultural area and more than 90% of the total agricultural production of the European Union (FADN, 2006). For each farm sampled, the data relates to variables such as livestock, agricultural area, crop yields, etc. FADN is an instrument for evaluating the income of agricultural holdings and the impacts of the Common Agricultural Policy. We found that FADN could also be used as the data source for performing area-based and product-based environmental assessments.
The objective of this study was to establish a national agricultural model to estimate resource use, production and environmentally important emissions based on a set of representative farm types.
The national agricultural model should be able to deliver data for both area-based environmental assessments (e.g. nitrate leaching per ha, methane emissions per ha) and product-based environmental assessments (e.g. global warming potential per kg pork). This paper gives results in terms of representative farm types, their resource uses and emissions per ha. Per hectare results are given in kg N and P farm gate balances, nitrate–N, ammonia–N, nitrous oxide– N, phosphate–P, methane and fossil carbon dioxide.
2. Methods
The Danish agricultural sector was divided into 31 representative farm types. For each farm type data describing farm type characteristics (e.g. agricultural area, crop yields) were averaged over a number of farm accounts from private farms. Based on this, resource use (e.g. import of soybean meal, diesel, artificial fertilizer) and products sold (e.g. pork, cereals) from the farm types were modelled. Emissions (e.g. methane, nitrate, ammonia) were also calculated from the modelling of nutrient cycling and flows of energy and materials. Point of departure for modelling of the farm types was a set of representative farm accounts as explained below.
2.1. Farm account statistics
Danish farmers are obliged to keep records of purchases and sales for tax purposes and the annual accounts are made with professional help. Every year a sample of these farm accounts are collected by Food and Resource Economic Institute in order to fulfil Denmark’s obligation to supply FADN with farm data, and to produce ‘The annual Danish account statistics for agriculture’ (Møllenberg, 2001; Larsen, 2003).
agricul-R.
Dalgaar
d
e
t
al.
/
Agricultu
re
,
Ecosystems
and
En
vir
onment
xxx
(2006)
xxx–xxx
[image:3.595.54.729.136.297.2]3
Table 1
Criteria used for partitioning of farm accounts among farm types (sandy loam soil)
Farm type 1 2 3 4 5 6 7 8 9 10 11 12 13 30
Name Part-time Sugar beets Grass seeds Milk Milk Milk Organic milk Pig Pig Pig Cash crops Residual Horticulture Organic plant
Type of criteria
Working hours per yeara <832 >832 >832 >832 >832 >832 >832 >832 >832 >832 >832 >832 >832 >832
Conventional (C)/organic (O) Cb Cb Cb Cb Cb Cb Oc Cb Cb Cb Cb Cb Cb Oc
Specialization Non Sugar
beetsd
Grass seedse
Milkf Milkf Milkf Milkf Pigg Pigg Pigg Cash cropsh Nonh Horticulturei Organic
plantj
Livestock density (LU ha 1)k <1.4 <1.4 <1.4 1.4–2.3 >2.3 <1.4 1.4–1.7 >1.7 <0.5 >0.5
Distribution of farm accounts
Samplel 67 88 63 23 32 14 24 50 27 98 53 38 185 30
Populationm 5663 2009 1616 432 849 267 115 1322 424 1437 1983 1219 1133 289
Percent of total production in Denmark
Milk 0% 2% 0% 4% 7% 3% 1% 0% 0% 0% 0% 2% 0% 0%
Fattening pigs 0% 4% 3% 0% 0% 0% 0% 4% 4% 21% 0% 3% 0% 0%
a Part-time holdings: less than 832 working hours per year. b C: holdings that did not receive organic subsidies. c
O: holdings that did receive organic subsidies.
d
Holdings where at least 10% of the area was cultivated with sugar beets.
e
Holdings where at least 10% of the area was cultivated with grass seeds.
f
Holdings with dairy cattle. Maximum 10% of gross margin came from pigs.
g
Holdings with pigs. Minimum 10% of gross margin came from pigs. Maximum 10% of gross margin came from cattle.
h
Residual holdings not applying to previous criteria.
i
Horticultural accounts were marked specific, and could therefore be selected for this farm type.
j
Residual holdings that did receive organic subsidies, but had no dairy cattle.
k
One LU equals to: 1 milking cow, 3 sows with piglets (to 25 kg) or 24 fattening pigs (30–110 kg).
l
Number of farm accounts that fulfilled the criteria of the respective farm type.
m
tural area (e.g. number of hectares of spring barley and rape seed), crop yields (e.g. kg cereals, rape seed, potatoes and grass seeds per ha), livestock products sold (e.g. kg milk, meat, live animals), livestock density, electricity use, etc. The farm accounts were weighted and selected to be representative for the entire population of 50,487 Danish farms. Firstly, the farm accounts were divided into two groups according to their main soil type. The sandy loam soil group was composed of farm accounts where the majority of the agricultural area had soil containing more than 10% clay, whereas the sandy soil group contained the rest. The farm accounts from farms in the sandy loam soil group were, subsequently, divided into 14 groups using the criteria presented inTable 1. For each farm type on sandy loam soil a set of criteria regarding the number of working hours per year, organic subsidies, specialization (e.g. sugar beets, milk, pigs) and livestock density (livestock units ha 1) was defined. The criteria regarding number of working hours and specialization were used in order to separate small mixed farms from large specialized farms. Thereby the modelling was facilitated and the farm types were reflecting the structure of the Danish agricultural sector, which is moving towards larger and more specialized farms. The criterion of livestock density was used to separate livestock farms from cash crop farms, and to secure that the modelling of manure exchange between farm types could be performed in accordance with the public regulation of manure and fertilizer use in Denmark, which partly is based on livestock density (Plantedirektoratet, 1998). Organic farms and conventional farm accounts were separated to secure that artificial fertilizer was not purchased by organic farms.
Secondly, all farm accounts belonging to the sandy loam soil group were tested against the criteria of farm type 1. The number of working hours should be less than 832 year 1and the farm should not receive organic subsidies. The criteria were fulfilled by 67 farm accounts, representing a population of 5663 Danish part-time farms. The remaining farm accounts were tested against the criteria of farm type 2, and 88 farm accounts matched the four criteria, namely more than 832 working hours year 1, not receiving organic subsidies, at least 10% of the area cultivated with sugar beets and maximum 1.4 livestock units ha 1. This procedure was followed to divide all the farm accounts for sandy loam soil farms in a sequential procedure using the criteria under each predefined type as shown from left to right inTable 1. The same was done to farm accounts in the sandy soil group (Table 2). For further details, seeLarsen (2003).
Farm accounts with more than 10% of gross margin from poultry were not divided according to soil type, but were partitioned into farm types 27, 28 and 29 (not presented in Tables 1 and 2).
After the partitioning of the farm accounts into the 31 farm types, the data in the farm accounts belonging to the same farm type were averaged, and thus each farm type was represented as one averaged farm account, containing data describing the agricultural area, crop yields, livestock
production, purchased inputs, etc. The existing system of sampling did unfortunately not permit calculation of variance on data from the farm types. However, on a European level, the Commission has since 1965 used the farm account data to determine differences between farm types in their productivity and economic competitiveness (FADN, 2006), and therefore we also found it suitable for comparison of environmental aspects.
For each farm type a detailed model was then developed, based partly directly on the averaged farm accounts, and partly on general knowledge as explained in the following.
2.2. Modelling coherent and representative farm types
The data in the farm accounts contained information on the agricultural area, crop yields, livestock products sold, livestock density, electricity use, etc. of each farm type. This information was thus used to establish the general crop– livestock interaction (e.g. how much homegrown barley was used as feed on the farm, how much manure was used for fertilization), and the level of production within each farm type. Because the use of external inputs like purchased feed and fertilizer was only available in the monetary units Danish Kroner (DKK) in the accounts, the feed and fertilizer use in kg nutrients was modelled using standards. The use of electricity and chemicals in DKK and the production of fattening pigs and milk were not modelled but were averaged data from the farm accounts.
Due to the public regulation of manure and fertilizer use in Denmark, representative average values for feed efficiency in livestock production (e.g. feed use per kg live weight pig) and the production of nitrogen (N) and phosphorus (P) in manure by livestock types are readily available. For example a fattening pig (30–100 kg) by standard excretes 5.1 kg N and 0.72 kg P and has an N efficiency of 0.38 (Poulsen et al. (2001), an update from Poulsen and Kristensen (1998)). N efficiency is defined as the N produced in the carcass divided by the N intake in feed, and was lower for sows and piglets in comparison with fattening pigs. The N demand and N excretion of a milking cow were also calculated according toPoulsen et al. (2001), an update from Poulsen and Kristensen (1998), but as they depend on the milk yield per cow and on the percentage of Jersey stock, they were calculated for each the farm type using the farm accounts data. N demand and N excretion were 150–176 and 114–133 kg N cow 1year 1, respec-tively. N-efficiency of 0.25 and 0.24 for Jersey and dual-purpose breed cows, respectively, were used (Poulsen et al. (2001), an update fromPoulsen and Kristensen (1998)).
R.
Dalgaar
d
e
t
al.
/
Agricultu
re
,
Ecosystems
and
En
vir
onment
xxx
(2006)
xxx–xxx
[image:5.595.56.735.145.297.2]5
Table 2
Criteria used for partitioning of farm accounts among farm types (sandy soil)
Farm type 14 15 16 17 18 19 20 21 22 23 24 25 26 31
Name Part-time Potatoes Milk Milk Milk Organic milk Pig Pig Pig Suckler cows Cash crops Residual Horticulture Organic plant
Type of criteria
Working hours per yeara <832 >832 >832 >832 >832 >832 >832 >832 >832 >832 >832 >832 >832 >832
Conventional (C)/organic (O) Cb Cb Cb Cb Cb Oc Cb Cb Cb Cb Cb Cb Cb Oc
Specialization Nond Potatoese Milkf Milkf Milkf Milkf Pigsg Pigsg Pigsg Suckler cowsh Cash cropsi Noni Horticulturej Organic plantk
Livestock density (LU ha 1)l <1.4 <1.4 1.4–2.3 >2.3 <1.4 1.4–1.7 >1.7 <0.5 >0.5
Distribution of farm accounts
Samplem 59 62 83 182 16 125 99 38 164 103 52 91 100 107
Populationn 5043 1184 1912 4004 330 695 2319 600 2347 6309 2103 2229 644 1084
Percent of total production in Denmark
Milk 0% 2% 15% 43% 4% 9% 0% 0% 0% 0% 0% 7% 0% 0%
Fattening pigs 0% 2% 0% 0% 0% 0% 13% 4% 30% 2% 0% 6% 0% 0%
a
Part-time holdings: less than 832 working hours per year.
b
C: holdings that did not receive organic subsidies.
c
O: holdings that did receive organic subsidies.
d No suckler cows.
e Holdings where at least 10% of the area was cultivated with potatoes. f Holdings with dairy cattle. Maximum 10% of gross margin came from pigs.
g Holdings with pigs. Minimum 10% of gross margin came from pigs. Maximum 10% of gross margin came from cattle. h Holdings with suckler cows.
i Residual holdings not applying to previous criteria. j
Horticultural accounts were marked specific, and could therefore be selected for this farm type.
k
Residual holdings that did receive organic subsidies, but had no dairy cattle.
l
One LU equals to: 1 milking cow, 3 sows with piglets (to 25 kg) or 24 fattening pigs (30–110 kg).
m
Number of farm accounts that fulfilled the criteria of the respective farm type.
n
Moreover, each farm has a fertilizer quota based on official crop N norms multiplied by the area with different crops. From this is deducted the plant-available N in the either home-produced or imported farm manure. For example, a cash crop farm on sandy loam soil with no manure production could import 117 kg N in artificial fertilizer ha 1of spring barley if the field has carried a cereal crop the previous year (Plantedirektoratet, 1998). Thus, fertilizer use on the different farm types was calculated using these norms. As part of Danish compliance with the EU Nitrate Directive, the use of manure–N is limited, why some farms are obliged to export manure to cash crop farms. This was modelled as a transfer of manure from farm types with a high livestock density to other farm types, which then reduced the artificial fertilizer input accordingly. In 1999 the use of manure on pig farms was limited to 170 kg N ha 1. Dairy farm types with a straw shortage were supplied with straw from farm types with a low livestock density. Because the model accounts for the entire land use and agricultural production on national level the consistency of exchange of manure and straw between farms could be checked.
Livestock farms are primarily situated in the western part of Denmark, where sandy soil predominates. This is reflected in the national agricultural model, where 80% of the milk and 57% of the fattening pigs were produced on sandy soil farm types (Table 2). It was assumed that transfer of manure and straw for bedding between the western and eastern parts of Denmark, which are separated by two straits, only occurred on a minor scale, and therefore the transfer of manure and straw between farm types was modelled to only occur between farm types belonging to the same soil group. Consequently, farm types on sandy soil interchanged more manure and straw than farm types on sandy loam soil.
In this way a coherent model of crop–livestock interactions was established for each farm type with a consistent relation between livestock production, use of homegrown versus imported feed and export of cash crops. There was also coherence between the farm types in terms of manure and straw. Moreover the use of N in artificial fertilizer and manure on all farm types was in harmony with Danish legislation.
Energy use for traction was modelled followingDalgaard et al. (2001), where each crop was assigned a number of field operations multiplied by diesel use per ha. It was assumed that the diesel consumption for passenger car driving was 5 l ha 1year 1, while the average distance from farm to field was 2 km. Electricity use was estimated directly from the data in the farm accounts using a standard price per kW h consumed, but corrected against national statistics.
2.3. Modelling farm nutrient balances and emissions
For each of the 31 farm types, N and P balances were established at farm gate level, herd level and field level following the procedures of Halberg et al. (1995) and
Kristensen et al. (2005a). The N input to the farm types
included: feed concentrates, straw, artificial fertilizer, manure, deposition, biological N fixation (BNF) and living animals. The BNF in pure legumes was calculated as a proportion of the yield in grain legume multiplied by the standard N content (Høgh-Jensen et al., 2004). In grass clover BNF was set at the average value obtained for approximately 100 private pilot farms during the period 1989–2003. BNF was estimated from the percentage of clover in the season based on 300 visual clover estimations per farm per year as described byKristensen et al. (1995). The estimated BNF in organic grass/clover was 150 kg N ha 1year 1 and in conventional grass/clover fertilized with around 130 kg N ha 1year 1as artificial fertilizer the estimated BNF was 100 kg N ha 1year 1. The N output from the farm types included: Meat, milk, crops and manure sold to other farm types.
The amounts of nitrate, ammonia, phosphate and greenhouse gasses (methane, nitrous oxide and fossil carbon dioxide) emitted from the farm types were determined on the basis of nutrients balances in combination with farm account data on agricultural area, livestock and internal flows.
Nitrate leaching was assumed to be equal to the N farm gate balance minus ammonia losses, denitrification ( Kris-tensen et al., 2005a) and net change in soil N status. The ammonia emission from animal housing, manure storage and handling was calculated using standard values from Hutchings et al. (2001). These values are also presented by Kristensen et al. (2005a, see appendix). Denitrification was estimated using the method ofVinther and Hansen (2004), and the net change in soil N status was modelled using the dynamic soil model from Gyldenkærne et al. (2005), implemented in C-TOOL (Petersen et al., 2002).
The nitrous oxide emissions were calculated according to
IPCC (2000), but using a country-specific accounting
method for some of the crop residue N content (Møller et al., 2000).
According to ‘Evaluation of the Action Plan for the Aquatic Environment II’ (Action Plan for the Aquatic Environment, 2003) 1000 t of P leached in 2004, correspond-ing to 0.4 kg P ha 1. In order to reach that level for the national agricultural model and to obtain proportionality between P farm gate balance and leaching it was assumed, that 2.9% of the P farm gate balance leached as phosphate.
The emission of CO2 from combusted fossil fuel was assumed to be 91 g CO2MJ 1diesel and 94 g CO2MJ 1 heating oil (Nielsen et al., 2003).
Emissions and resource use relating to the construction and maintenance of buildings and machinery used on the farm were not included, and the use of medicine and pesticides was not considered. Emissions and resource use associated with the production of purchased resources (e.g. soybean meal, fertilizer) were not included in this study.
Estimates of uncertainty on the N farm gate surplus were calculated using a study byKristensen (2005, a short translation of the Danish report byHvid et al. (2004)), who found the uncertainties to be 8, 21, 13 and 18% (measured as coefficients of variation (CV)), respectively, for the farm types conventional and organic dairy, pig farms and non-livestock farms. These uncertainties were calculated on basis of standard deviations for each item in the N farm gate balance. The lowest CVs were on artificial fertilizer (5%) and milk (3%), whereas the highest were on BNF (25%) and on cash crops (20%). Those CVs were used to calculate the standard deviations for the actual items. Farm types with a large area of clover grass (e.g. organic dairy farm) and thus high N-input from BNF, also had high uncertainty on the N farm gate surplus. For further details on calculation of CVs and uncertainties, see Kristensen (2005). The uncertainties on the N farm gate balances were used in our study to indicate whether the differences in N farm gate balances between farm types were important. Due to the importance and variability analyses of the BNF estimate we also performed sensitivity analyses of changes in this parameter.
The emissions of N in the form of ammonia, nitrous oxide and nitrate were estimated in a coherent way, so that sum of the partial emissions and the net change in soil N status equalled the N farm gate balance. It was beyond the scope of this study to determine uncertainties on these items. But as explained above we have used international recognized methods for calculation of greenhouse gas emissions and national recognized methods for calculation ammonia emissions. In addition we checked the total estimated emissions against a separate national level inventory of emissions as explained in the following.
2.4. Securing consistency with the national statistics
To secure a consistency of the farm types with the national statistics, a three-step validity check was per-formed.
Firstly, a validity check of farm type production data against national statistics was performed. This was done by multiplying production data (e.g. number of milking cows, agricultural area, pigs produced) from each farm type with the number of farms the farm type represented (population inTables 1 and 2), and then summarizing these multiplied data across all farm types and comparing the
values with national statistics (Agricultural Statistics, 2000).
Secondly, the modelled resource use (e.g. soybean meal, diesel, artificial fertilizer N) of the farm types was compared with national statistics by similarly multiplying the resource use of each farm type with the population of the farm type, and then comparing these values with national statistics. The total use of artificial fertilizer N was underestimated. Therefore, figures for the farm types were adjusted using an overall factor on the input to all farm types. The model also underestimated the total use of diesel and heating oil, and the farm types were therefore adjusted accordingly.
Thirdly, the emissions of nitrous oxide and methane from farm types were compared with national statistics for emissions of greenhouse gasses (Gyldenkærne and Mikkel-sen, 2004).
Area-based environmental indicators were calculated on the basis of the modelled farm types and presented as N and P farm gate balances and emissions of nitrate, phosphate, ammonia, methane, nitrous oxide and fossil CO2 per ha.
3. Results
The results from the modelling of farm types and their consistency with national statistics are presented followed by results from the farm types in terms of emissions per ha.
3.1. Establishment of farm types and their consistency with national statistics
To secure the consistency of the national agricultural model based on representative farm types, production data and resource use across all 31 representative farm types were aggregated using the population of the respective farm types (Tables 1 and 2). The production data for pig and milk production and land use were in good agreement with the Danish National Statistics (Agricultural Statistics, 2000) as shown in Table 3. The farm types did not, however, account satisfactorily for the total use of artificial fertilizer N. The unexplained difference was corrected using an overall factor of 10% on the artificial fertilizer N input to all farm types. The total use of diesel and heating oil was underestimated by 18%, and the farm types were therefore adjusted accordingly. The underestimation of diesel use might be due to underestimation of passenger car driving or the distance from farm to field.
The aggregated emissions of nitrous oxide and methane across all farm types were 22,000 t N2O and 160,000 t CH4, and thereby the nitrous oxide emission was 9% higher and the methane emission 10% lower than the Danish National Statistics for emissions of greenhouse gasses (Andersen
et al., 2001; Gyldenkærne and Mikkelsen, 2004). The difference in nitrous oxide emission was expected since we used more detailed information for crop residues than in the national nitrous oxide budget.
3.2. Selected farm types’ characteristics and resource use
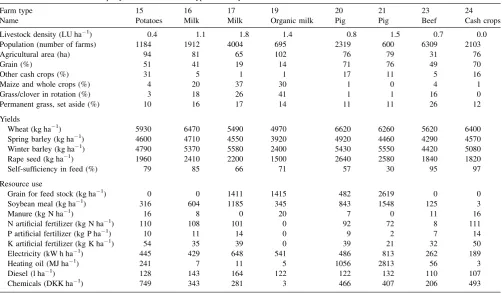
After correcting for national level consistency in terms of artificial fertilizer N, diesel and heating oil, the representative and coherent farm types showed the relationship between resource uses and emissions and specific volumes of livestock and cash crop productions. Detailed results are presented as an open database (Nielsen et al., 2003). Agricultural area, yields and resource use for selected farm types on sandy loam soil and sandy soil are presented inTables 4 and 5, respectively. In Tables 4 and 5the following parameters are modelled: Self-sufficiency in feed, grain for feed stock, soybean meal, manure, artificial fertilizer, heating oil and diesel. The rest of the parameters are farm account data.
[image:8.595.51.290.109.386.2]On pig farms 71–79% of the area was cropped with grains compared with 14–48% on dairy farms. Organic dairy farms had the largest area (50–55%) with grass-clover, permanent grass and set-aside. The self-sufficiency in terms of feed (calculated on the basis of Scandinavian Feed Units) decreased with increasing livestock density and was in general higher for dairy farm types (64–85%) than for pig farm types (30–67%).
Table 4
Characteristics and resource use per year for selected farm types on sandy loam soil
Farm type 2 3 4 5 7 8 9 11
Name Sugar beets Grass seeds Milk Milk Organic milk Pig Pig Cash crops
Livestock density (LU ha 1) 0.5 0.2 0.9 1.7 1.2 0.7 1.6 0.1
Population (number of farms) 2009 1616 432 849 115 1322 424 1983
Agricultural area (ha) 78 105 99 50 88 58 77 68
Grain (%) 60 57 48 32 24 77 79 74
Other cash crops (%) 30 35 6 3 3 14 11 15
Maize and whole crops (%) 1 0 17 29 23 0 1 0
Grass/clover in rotation (%) 1 0 14 24 33 1 1 2
Permanent grass, set aside (%) 8 8 15 12 17 7 8 9
Yields
Wheat (kg ha 1) 8630 8030 6700 6830 5850 6950 7260 7510
Spring barley (kg ha 1) 6180 5940 4790 4970 3650 5370 5760 5360
Winter barley (kg ha 1) 6470 6080 5390 5370 – 6160 6000 5600
Rape seed (kg ha 1) 3040 3170 3040 2710 3000 3100 3170 2880
Self-sufficiency in feed (%) 72 75 83 64 74 67 36 91
Resource use
Grain for feed stock (kg ha 1) 0 0 0 1294 1116 117 2214 0
Soybean meal (kg ha 1) 483 219 594 1402 250 763 1532 13
Manure (kg N ha 1) 6 7 6 0 22 7 0 16
N artificial fertilizer (kg N ha 1) 110 120 107 89 0 116 95 136
P artificial fertilizer (kg P ha 1) 10 12 10 11 0 9 5 15
K artificial fertilizer (kg K ha 1) 50 46 27 17 0 41 29 53
Electricity (kW h ha 1) 327 284 464 598 446 456 951 177
Heating oil (MJ ha 1) 440 229 5 19 2 1121 2334 334
Diesel (l ha 1) 140 120 147 166 124 140 148 178
Chemicals (DKK ha 1) 746 578 333 299 4 572 526 538
Table 3
Aggregated production data and resource use across 31 representative farm types, scaled to national level and compared with the Danish National Statistics
Farm types scaled to national level
Danish National Statisticsa
Deviation from Danish National Statistics (%)
Production data Fattening pigs producedb(1000)
20639 20801 1
Sows (yearly basis) (1000)
1083 1052 3
Milking cows (1000)
633 661 4
Milk production (1000 t)
4624 4455 4
Agricultural area (1000 ha)
2585 2644 2
Area with cereals (1000 ha)
1395 1448 4
Area with roughage (1000 ha)
567 570 1
Resource use Artificial fertilizer N (1000 t N)
226 252 10
Soybean meal (1000 t N)
142 156 9
Grain (1000 t) 6571 6728 2
Diesel and heating oil (PJ)
13.0 15.8 18
a
Agricultural Statistics (2000).
b
[image:8.595.53.551.444.734.2]The grain yields of wheat, spring barley and winter barley, calculated as an area weighted average across all farm types, were 29% higher on farm types on sandy loam soil. This is presumably because of a higher soil fertility
(Halberg and Kristensen, 1997). Organic dairy farms had
the lowest yields of wheat and spring barley (Tables 4 and 5). Calculated as a weighted average the grain yields on organic dairy farms and organic arable farms were 81 and 58%, respectively, of the conventional level (data not shown).
The amount of N in manure and artificial fertilizer imported to the farm types varied inversely with the livestock units (LU ha 1). For example 107 kg artificial fertilizer N ha 1 and 6 kg manure–N was imported to farm type 4 (dairy farm type on sandy loam soil, 0.9 LU ha 1), and only 89 kg artificial fertilizer N ha 1 and no manure–N was imported to farm type 5 (dairy farm type on sandy loam soil, 1.7 LU ha 1). These differences are due to the strict Danish regulations on the use of manure and limitations in the use of fertilizer (Hutchings et al., 2005).
Generally the pig farm types imported less artificial fertilizer P (2–9 kg P ha 1) compared with other farm types (10–114 kg P ha 1), because pig manure has a high P content. Pig farm types used more heating oil than any of the other farm types due to the heating requirements for animal houses. There was a tendency for higher diesel imports to dairy farm types in comparison to other farm types. This was
caused by the high diesel requirements for the processing and handling of roughage for feeding. The expenditure on chemicals (per ha) was highest for the two farm types producing sugar beets and potatoes. This was in agreement with our expectations, since cultivation of sugar beets and potatoes often includes high levels of pesticide use
(Christensen and Huusom, 2003). The data in the farm
accounts on chemicals purchased were not specified, but it was assumed that most of these chemicals were pesticides, although some may have been detergents for cleaning pig housing and milking equipment. The use of chemicals was lowest on the dairy farm types, probably because of low pesticide use for grassland.
Product sales from the farm types are not shown in
Tables 4 and 5, but are presented at the open database
(Nielsen et al., 2003).
3.3. Nutrient balances and emissions from selected farm types
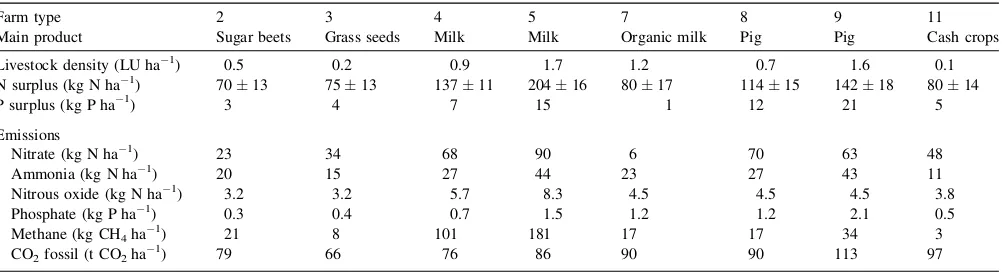
[image:9.595.43.546.86.379.2]The selected farm types together do not represent the entire Danish agricultural sector and therefore the results are solely valid for the farm types presented inTables 4 and 5. The N and P farm gate balances (surpluses) and the emissions from selected farm types on sandy loam soil and sandy soil are presented in Tables 6 and 7, respectively. Tables 6 and 7shows that dairy farm types have the highest N and P surplus per ha followed by pig farm types and cash R. Dalgaard et al. / Agriculture, Ecosystems and Environment xxx (2006) xxx–xxx 9
Table 5
Characteristics and resource use per year for selected farm types on sandy soil
Farm type 15 16 17 19 20 21 23 24
Name Potatoes Milk Milk Organic milk Pig Pig Beef Cash crops
Livestock density (LU ha 1) 0.4 1.1 1.8 1.4 0.8 1.5 0.7 0.0
Population (number of farms) 1184 1912 4004 695 2319 600 6309 2103
Agricultural area (ha) 94 81 65 102 76 79 31 76
Grain (%) 51 41 19 14 71 76 49 70
Other cash crops (%) 31 5 1 1 17 11 5 16
Maize and whole crops (%) 4 20 37 30 1 0 4 1
Grass/clover in rotation (%) 3 18 26 41 1 1 16 0
Permanent grass, set aside (%) 10 16 17 14 11 11 26 12
Yields
Wheat (kg ha 1) 5930 6470 5490 4970 6620 6260 5620 6400
Spring barley (kg ha 1) 4600 4710 4550 3920 4920 4460 4290 4570
Winter barley (kg ha 1) 4790 5370 5580 2400 5430 5550 4420 5080
Rape seed (kg ha 1) 1960 2410 2200 1500 2640 2580 1840 1820
Self-sufficiency in feed (%) 79 85 66 71 57 30 95 97
Resource use
Grain for feed stock (kg ha 1) 0 0 1411 1415 482 2619 0 0
Soybean meal (kg ha 1) 316 604 1185 345 843 1548 125 3
Manure (kg N ha 1) 16 8 0 20 7 0 11 16
N artificial fertilizer (kg N ha 1) 110 108 101 0 92 72 8 111
P artificial fertilizer (kg P ha 1) 10 11 14 0 9 2 7 14
K artificial fertilizer (kg K ha 1) 54 35 39 0 39 21 32 50
Electricity (kW h ha 1) 445 429 648 541 486 813 262 189
Heating oil (MJ ha 1) 241 7 11 5 1056 2813 56 3
Diesel (l ha 1) 128 143 164 122 122 132 110 107
crops farm types. Using the estimated standard errors organic dairy farm types have lower N surplus than conventional, and conventional dairy farm types with high livestock density had higher N surplus than the other livestock farm types. There were probably no differences between different cash crop farm types.
For more details on the N nutrient balances see
Kristensen et al. (2005a). Following our methodology,
Tables 6 and 7show the same differences in the emissions
between farm types, with comparably high ammonia emissions on high livestock density pig and dairy farm types and low emissions on organic farm types.
The emission per ha of nutrients (nitrate, ammonia, nitrous oxide and phosphate) was higher on the farm types with the highest livestock density, as also shown in Kristensen et al. (2005a). The cash crop farm types (e.g. farm types 2, 3 and 11) in general emitted less nutrients than livestock farms. This is because manure–N is utilised less efficiently compared with N in artificial fertilizer and because the storage and handling of manure result in losses of ammonia and nitrous oxide. The emission of phosphate was also higher from farm types with a high livestock density.
The emissions of nitrate and phosphate were generally lower from farm types on sandy loam soil than farm types on sandy soil. This could be explained by the higher crop yields
(shown in Tables 4 and 5) due to higher soil fertility and more stable water supply on sandy loam soil. Moreover, the precipitation surplus is generally higher in the western part of Denmark where most sandy soils are situated resulting in a higher risk of leaching during winter.
Conventional dairy farm types in general had higher nitrate emissions (68–108 kg N ha 1) compared with pig farm types (63–95 kg N ha 1). The higher nitrate emissions were caused by a lower N efficiency in the milk/meat production compared with pork production and the fact that fewer cash crops are sold from dairy farms than pig farms. The phosphate emissions from dairy farm types were lower (0.4–1.7 kg P ha 1) compared with pig farm types (1.2– 2.2 kg P ha 1). In Danish legislation the use of N is limited but not the use of P and this probably causes heavier P fertilization on pig farms than on dairy farms, simply because more P is applied per unit N. Pig manure has a higher P/N ratio than cattle manure (Poulsen and Kristensen, 1998). There were no differences in the ammonia emissions per ha between dairy farm types and pig farm types at comparable livestock density. The methane emission per ha was higher from dairy farm types (101–189 kg CH4ha 1) compared with all other farm types (3–63 kg CH4ha 1), due to the enteric fermentation of cattle.
[image:10.595.53.554.88.225.2]In general the conventional dairy farms emitted more nitrate (68–108 kg NO3–N ha 1), ammonia (27–44 kg
Table 6
Emissions per year from selected farm types on sandy loam soil
Farm type 2 3 4 5 7 8 9 11
Main product Sugar beets Grass seeds Milk Milk Organic milk Pig Pig Cash crops
Livestock density (LU ha 1) 0.5 0.2 0.9 1.7 1.2 0.7 1.6 0.1
N surplus (kg N ha 1) 7013 7513 13711 20416 8017 11415 14218 8014
P surplus (kg P ha 1) 3 4 7 15 1 12 21 5
Emissions
Nitrate (kg N ha 1) 23 34 68 90 6 70 63 48
Ammonia (kg N ha 1) 20 15 27 44 23 27 43 11
Nitrous oxide (kg N ha 1) 3.2 3.2 5.7 8.3 4.5 4.5 4.5 3.8
Phosphate (kg P ha 1) 0.3 0.4 0.7 1.5 1.2 1.2 2.1 0.5
Methane (kg CH4ha 1) 21 8 101 181 17 17 34 3
CO2fossil (t CO2ha 1) 79 66 76 86 90 90 113 97
[image:10.595.50.554.590.725.2], the standard deviation.
Table 7
Emissions per year from selected farm types on sandy soil
Farm type 15 16 17 19 20 21 23 24
Main product Potatoes Milk Milk Organic milk Pig Pig Beef Grain
Livestock density (LU ha 1) 0.4 1.1 1.8 1.4 0.8 1.5 0.7 0.0
N surplus (kg N ha 1) 10319 15012 20917 11023 10714 14819 13611 7814
P surplus (kg P ha 1) 8 9 18 4 14 23 5 7
Emissions
Nitrate (kg N ha 1) 84 85 108 32 77 95 86 73
Ammonia (kg N ha 1) 18 30 43 27 28 44 23 10
Nitrous oxide (kg N ha 1) 4.5 7.0 8.9 5.7 4.5 5.1 6.4 3.8
Phosphate (kg P ha 1) 0.8 0.9 1.7 0.4 1.4 2.2 0.5 0.7
Methane (kg CH4ha 1
) 26 113 189 141 19 33 63 3
CO2fossil (t CO2ha 1) 70 74 85 64 79 111 58 55
NH3–N ha 1), and nitrous oxide (5.7–8.9 kg N2O–N ha 1), compared with organic dairy farms (6–32 kg NO3–N ha 1, 23–27 kg NH3–N ha 1and 4.5–5.7 kg N2O–N ha 1). The very low nitrate emission (6 kg NO3–N ha
1
) from farm type 7 (organic dairy farm on sandy loam soil) was a result of low N surplus (80 kg N ha 1), high denitrification and high accumulation of N in the soil. Further results regarding the N surplus of different farm types are presented byKristensen et al. (2005a).
Emission of fossil CO2was a function of combustion of both heating oil and diesel. So even though the pig farm types used less diesel per ha than dairy farm types, the smaller amount of CO2 from the diesel combustion was counterbalanced by a higher emission of CO2 from the combustion of heating oil.
4. Discussion
4.1. Methodology: establishment of farm types
The results presented demonstrate how the resource use and emissions from farm types can be modelled on the basis of representative farm accounts and accepted norms for feed conversion and fertilization.
An important strength of the method is that the farm types are representative, partly because of the use of the representative data set of farm accounts and partly because of the adjustment to the national level statistics. The farm types are based on realistic and documented levels of resource use per unit agricultural product and the emissions, therefore, reflect average production levels and efficiency within different farm types. The farm types are all consistent in terms of crop–livestock interactions, and together they form the national agricultural model that documents the total resource use and emissions of the Danish agricultural sector, including the exchange of manure and straw between farm types.
The method of establishing a set of representative farm types including emissions may be used in many European countries, because similar data sets are reported yearly to Eurostats’ FADN. However, the exact modelling approach must be adjusted according to local regulations and N and P norms and the level of detail recorded. For some countries, e.g. Netherlands, data on inputs required for agricultural production are given in quantities instead of expenditures
(Poppe and Meeusen, 2000) and thereby the establishment
of farm types is facilitated.
The major drawback of the method from our point of view is that the large variation that may exist between farms within one farm type in e.g. feed or fertilizer use efficiency due to differences in farm management skills and strategic choices of crop rotation and feed planning is not reflected in differences between the farm types. This was, however, a necessary choice based on the primary purpose of establish-ing representative and coherent farm types that could be
used for environmental assessment of farm types and agricultural products.
According to Poppe and Meeusen (2000) and EEA (2005), there are two important shortcomings of the FADN, namely, that fertilizer purchases are only valued in monetary units and that it is not disaggregated into the different units such as N, P and K. In the development of the farm types a lot of effort was devoted to estimating the N flows and we did it on the basis of the Danish legislation on fertilizer use. Even so we underestimated the N fertilizer use by 10%. This could have been avoided if we had had the figures for the different volumes of N, P and K fertilizers purchased for the different farm types. So we can only support the request from theEEA (2005)for the expansion of FADN to include the volume of fertilizers.
The amounts of feed and fertilizer purchased could have been modelled for individual farms based on the monetary information using standard prices per unit. But that might have introduced another bias because of differences in the actual price paid per unit, for example farms that get discount prices, would in reality have used more feed or fertilizer than estimated from average prices. Furthermore Halberg et al. (2000)found that calculation of purchased fertilizer from prices is very sensible to unit prices.
Another drawback is the relatively large number of small co-enterprises in the Danish farm types resulting from combining many different co-enterprises (for example two dairy farms growing 5 ha with cash crops, one bread wheat, the other sugar beets will result in a combined type growing 2.5 ha of each). This issue may not be a problem in regions with more specialized farm types compared with the Danish mixed dairy farms.
The national agricultural model did not initially account for the total use of artificial fertilizer N, diesel and heating oil in Danish agriculture, why correction factors were used. While this secures consistency with national level statistics, it is not a completely satisfactory solution because the error may in fact be due to an underestimation in specific rather than all farm types.
The statistical weighting method used to divide the farm accounts into farm types ensures representativity of each farm type. However, due to this method it was not possible to test statistically the variation between farm types. Therefore, the uncertainty of the N balances was estimated using the variance of the individual inputs (e.g. fertilizer, feed) and outputs (e.g. cash crops, milk) (see methods).
Using this method it was established that dairy farm types had higher N surpluses and losses compared with pig and cash crop farm types. There was higher N surplus on conventional farm types compared to organic farm types, and pig and dairy farm types with high livestock density had higher N losses compared to farm types with lower livestock density.
averages of a large number of farms, probably overestimates the variation. Therefore, we find that these are conservative estimates and it seems therefore reasonable to use these estimates to assess differences in the emissions also. The findings were in agreement with studies on Danish pilot farms (Halberg et al., 1995; Halberg, 1999; Nielsen and Kristensen, 2005).
In a parallel study byKnudsen et al. (in press)sensitivity analyses were performed to test how the N farm gate balances of the dairy farms were affected by changes in amount of BNF, N efficiency in dairy herd, crop yields and N in fodder produced on the farm. The sensitivity analyses showed that the N farm gate balances on conventional farms had a relatively low degree of sensitivity to changes in assumptions (Knudsen et al., in press), due to small areas grown with fixating crops. On organic farms the sensitivity was higher. The N farm gate balances of the organic dairy farms increased 17–19% if a 25% higher BNF was assumed. The N farm gate balances of conventional dairy farms decreased by 5–8% only with 10% increased N content in home grown fodder. On this basis we conclude that the overall pattern and level of nutrient balances and related emissions on the farm types have a satisfactory degree of precision. For further details seeKnudsen et al. (in press). In this study the national agricultural model was used to demonstrate resource uses and emissions of different farm types, but it can also be used on a sector level. For example the eight dairy farm types and six pig farm types can be aggregated (by using population values equal to those in
Tables 1 and 2) into two farm types representing the
specialized dairy sector and specialized pig sector, respectively. The specialized dairy sector then accounts for 86% of the milk produced in Denmark and the specialized pig sector then accounts for 76% of the fattening pigs produced in Denmark. The establishment of these specialized sectors can give information on which sector is main contributor of different emissions, and which sector has the highest resource use.
4.2. Farm nutrient balances and emissions
Nielsen and Kristensen (2005) studied data from 56
Danish livestock farms collected from 1997 to 2003 and found that N and P surplus increased significantly with increasing livestock density. This is in good agreement with our results showing the emissions of nutrifying substances in general were higher from farms with high livestock density.
Holbeck and Hvid (2004),Hvid (2005a,b) andKristensen
et al. (2004)analysed data from farms from 1999 to 2003,
and found that the N surplus was higher from dairy farms in comparison with pig farms. This is also in accordance with our results and the results ofNielsen and Kristensen (2005). In another study based on the national agricultural model the FADN data from 1999 was updated by FADN data from 2002 (Kristensen et al., 2005b). The study showed that the nitrate leaching per hectare was 63 kg N. Exactly the same
result was obtained in the ‘Evaluation of the Action Plan for the Aquatic Environment II’ (Action Plan for the Aquatic Environment, 2003), where the nitrate leaching per hectare for the year 2002 was estimated. Thus nitrate leaching estimated by the national agricultural model is in good agreement with the ‘Evaluation of the Action Plan for the Aquatic Environment II’.
Watson et al. (2002)estimated the N and P surpluses on
eight Swedish dairy farms (livestock density higher than 0.8 LU ha 1) to 42–128 kg N ha 1 and 1–13 kg P ha 1, respectively. Our results on N and P surpluses from organic dairy farms were within these intervals. Verbruggen et al. (2005)estimated the N surplus on conventional specialized dairy farms in 2001 in Flanders to 238 kg N ha 1, which is high compared to our dairy farm types (137–209 kg N ha 1). But here it must be taken into considerations that the livestock density in the study from Flanders was 2.98 LU ha 1, which also is high compared to our dairy farm types. In a study byHaas et al. (2001)the average N and P surplus on German conventional dairy farms (2.0 LU ha 1) were 80 kg N ha 1 and 5 kg P ha 1, respectively. These values are low compared to our study, primarily because of lower import of fertilizer and feed to the German farms, which have very high yields on non-fertilized grass leys.
4.3. Environmental indicators
The FADN contains a lot of information, which until now has mainly been used for economic purposes. However, as our study demonstrates the FADN data could also be used to develop more agri-environmental indicators, which give insight into the environmental impact caused by the agricultural sectors in European countries.
The European Environmental Agency (EEA, 2005) recently developed and evaluated agri-environmental indi-cators for monitoring the integration of environmental concerns into the Common Agricultural Policy.EEA (2005) characterises FADN as the only harmonised micro-economic database that combines data on farm structure, input use and economic variables and FADN is described as a valuable data source for the establishment of agri-environmental indicators to describe energy use, cropping/ livestock patterns and organic farm incomes. The FADN was for example used to develop a farm typology to explain general trends in intensification/extensification. However,
EEA (2005) does not mention FADN as a potential data
source for establishment of agri-environmental indicators describing the emissions of methane, nitrous oxide and ammonia.
used data from the FADN to assess the N surpluses at farm level in the European Union and found that N surpluses varied widely across groups of farms in the EU because of the differences in farm structure and input use.Fais et al.
(2005) developed a methodology where FADN data were
combined with statistical, administrative and cartographic information, and then by the use of geographic information systems (GIS) technology it was possible to produce and organise data at geographical level within a region in Italy. Thereby data for environmental indicators (e.g. fertilizer consumption, soil erosion risk) could be spatial referenced and used for agri-environmental analysis in specific regions. Other types of area-based environmental indicators can also be obtained from the national agricultural model; for example the use of non-renewable resources as heating oil, diesel and artificial fertilizer P (Tables 4 and 5). The purchase of chemicals (monetary units per ha) can also be used as an area-based environmental indicator, but a major disadvantage is that the chemicals are not specified and therefore their toxicity and chemical/physical properties are unknown. The percentage of agricultural area with permanent grass and set-aside indicates the amount of extensively used agricultural area, and can therefore also be used as an environmental indicator. On the other hand data from FADN cannot be directly used for estimating agri-environmental indicators such as soil quality and biodiversity.
The environmental indicators presented in this paper are all area-based. There is an increasing interest in product-based environmental assessments (LCA) because there is a need to evaluate global emissions and impacts from the whole production chain in relation to types and amounts of products consumed (Haas et al., 2000; de Boer, 2003; Halberg et al., 2005). Product-based environmental assess-ments of agricultural products based on the data from the national agricultural statistics have been published by
Nielsen et al. (2003)andDalgaard and Halberg (2005).
5. Conclusion
On the basis of a representative sample of farm accounts collected and processed for agricultural statistics and for reporting to FADN, a national agricultural model has been established that can provide data of resource use, production and environmentally important emissions for a set of representative farm types. Within each farm type there was a consistent relation between resource use, production and emissions, and all 31 farm types cover the entire Danish agricultural sector.
Production data and resource use (e.g. soybean meal, diesel, artificial fertilizer N) for all farm types were aggregated and by comparison they were shown to be in good agreement with Danish National Statistics, except for artificial fertilizer N, diesel and heating oil where it was necessary to use correction factors to reach the same level as
the Danish National Statistics. Thereafter the national agricultural model could be used for delivering data from the 31 coherent and representative farm types for area-based and product-based (LCA) environmental assessments.
Results (per ha) showed that pig farm types imported more heating oil and less artificial fertilizer P compared to other farms, and dairy farms had the highest consumption of diesel. N in manure and artificial fertilizer imported to the selected farm types varied inversely with the livestock density.
Results (per ha) on emissions from the selected farm types showed that the emissions of nutrients (nitrate, ammonia, nitrous oxide and phosphate) in general were higher on the farm types with the highest livestock density. Conventional dairy farm types in general had higher nitrate emissions but lower phosphate emissions compared with pig farm types. The methane emission was higher from dairy farm types compared with all other farm types. In general the conventional dairy farms emitted more nitrate, ammonia, and nitrous oxide, compared with organic dairy farms.
It can be concluded that the resulting national agricultural model successfully establishes a method of modelling coherent and representative farm types based on generally available data. This method will then facilitate the establish-ment of representative agro-ecological models of typical farms, which can be used for environmental assessments.
References
Action Plan for the Aquatic Environment, 2003. Rapport fra arbejdsgruppen for udarbejdelse af en strategi for nedbringelse af landbrugets belastning af vandmiljøet med fosfor. Del IV. Available on-line (March 1st 2006) at
http://www.vmp3.dk/Files/Filer/Slutrapporter/del-4-1012031-med-logo.pdf.
Agricultural Statistics, 2000. Statistik om landbrug, gartneri og skovbrug. Danmarks Statistik. ISBN 87-501-1195-7, 287 pp.
Andersen, J.M., Poulsen, H.D., Børsting, C.F., Rom, H.B., Sommer, S.G., Hutchings, N.J., 2001. Ammoniakemission fra landbruget siden midten af 80’erne. Faglig rapport fra DMU 353, pp. 1–48.
Basset-Mens, C., van der Werf, H.M.G., 2005. Scenario-based environ-mental assessment of farming systems: the case of pig production in France. Agric. Ecosyst. Environ. 105, 127–144.
Brouwer, F.M., Godeschalk, F.E., Hellegers, P.J.G.J., Kelholt, H.J., 1995. Mineral balances at farm level in the European Union. Onderzoekver-slag Landbouw Economisch Instituut, pp. 137–141.
Cederberg, C., Flysjo¨, A., 2004. Environmental Assessment of Future Pig Farming Systems. Quantifications of Three Scenarios from the FOOD 21 Synthesis Work. SIK-report 723, pp. 1–54.
Cederberg, C., Mattsson, B., 2000. Life cycle assessment of milk produc-tion—a comparison of conventional and organic farming. J. Clean Prod. 8, 49–60.
Christensen, T., Huusom, H., 2003. Evaluering af informations—og ra˚d-givningsbaserede virkemidler i Pesticidhandlingsplan II. Arbejdsrap-port fra Miljøstyrelsen 22, pp. 1–81.
Dalgaard, R., Halberg, N., 2005. Life cycle assessment (LCA) of Danish pork. In: Proceedings from the International Workshop on Green Pork Production, Paris, France, 25–27 May 2005, pp. 165–167.
Dalgaard, T., Halberg, N., Porter, J.R., 2001. A model for fossil energy use in Danish agriculture used to compare organic and conventional farm-ing. Agric. Ecosyst. Environ. 87 (1), 51–65.
de Boer, I.J.M., 2003. Environmental impact assessment of conventional and organic milk production. Livest. Prod. Sci. 80, 69–77.
EEA, 2005. Agriculture and environment in EU-15. An indicator report. European Environmental Agency, Copenhagen. Available on-line (March 1st 2006) at http://webpubs.eea.eu.int/content/irena/Latestpro-ducts.htm.
Eriksson, I.S., Elmquist, H., Stern, S., Nybrant, T., 2004. Environmental systems analysis of pig production—the impact of feed choice. Int. J. LCA 1–12.
European Commision, 2003. Communication from the commission to the council and the European Parliament. Integrated Product Policy. Build-ing on Environmental Life-Cycle ThinkBuild-ing. COM (2000) 302 final. Available on-line (March 1st 2006) athttp://europa.eu.int/eur-lex/en/ com/cnc/2003/com2003_0302en01.pdf.
FADN, 2006. Farm Accountancy Data Network. Available on-line (March 1st 2006) athttp://europa.eu.int/comm/agriculture/rica/index_en.cfm. Fais, A., Nino, P., Giampaolo, A., 2005. Microeconomic and
geo-physical data integration for agri-environmental analysis, georefer-encing FADN data: A case study in Italy. In: Paper prepared for presentation at the XIth seminar of the EAAE (European Association of Agricultural Economists), ’The Future of Rural Europe in the Global Agri-Food System’, Copenhagen, Denmark, 24–27 August 2005.
Gyldenkærne, S., Mikkelsen, M.H., 2004. Projection of Greenhouse Gas Emission from the Agricultural Sector. Until 2017. Research Notes from National Environmental Research Institute. Report 194. Ministry of the Environment, Denmark.
Gyldenkærne, S., Mu¨nier, B., Olesen, J.E., Olesen, S.E., Petersen, B.M., Christensen, B.T., 2005. Inventory of CO2emissions from land use and
land use change. LULUCF (land use, land use change and forestry). Method description and inventory for 1990–2003. Report no 213 from the National Environmental Research Institute. 81 pp. Available on-line (March 1st 2006) at http://www2.dmu.dk/1_viden/2_Publikationer/ 3_arbrapporter/rapporter/AR213.pdf.
Haas, G., Wetterich, F., Geier, U., 2000. Life cycle assessment framework in agriculture on the farm level. Int. J. LCA 5, 345–348.
Haas, G., Wetterich, F., Ko¨pke, U., 2001. Comparing intensive, extensified and organic grassland farming in Southern Germany by process life cycle assessment. Agric. Ecosyst. Environ. 83, 43–53.
Halberg, N., 1999. Indicators of resource use and environmental impact for use in a decision aid for Danish livestock farmers. Agric. Ecosyst. Environ. 76, 17–30.
Halberg, N., Kristensen, I.S., 1997. Expected crop yield loss when con-verting to organic dairy farming in Denmark. Biol. Agric. Hortic. 14 (1), 25–41.
Halberg, N., Kristensen, E.S., Kristensen, I.S., 1995. Nitrogen turnover on organic and conventional mixed farms. J. Agric. Environ. Ethics 8 (1), 30–51.
Halberg, N., Kristensen, I.S., Dalgaard, T., 2000. Linking data sources and models at the levels of processes, farm types, and regions. In: Weidema, B., Meeusen, M.J.G. (Eds.), Agricultural Data for Life Cycle Assess-ments, vol. 1. LEI, The Hague, pp. 16–30.
Halberg, N., van der Werf, H.M.G., Basset-Mens, C., Dalgaard, R., de Boer, I.J.M., 2005. Environmental assessment tools for the evaluation and improvement of European livestock production systems. Livest. Prod. Sci. 96, 33–50.
Høgh-Jensen, H., Loges, R., Jørgensen, F.V., Vinther, F.P., Jensen, E.S., 2004. An empirical model for quantification of symbiotic nitrogen fixation in grass-clover mixtures. Agric. Syst. 82 (2), 181–194. Holbeck, H.B., Hvid, K.S., 2004. Næringsstofoverskud pa˚ kvæg-, svine- og
planteavlsbedrifter i demonstrationsprojekt med grønne regnskaber 1999–2001. Available on-line (March 1st 2006) athttp://www.lr.dk/ planteavl/diverse/groent_regnskab.htm.
Hutchings, N., Sommer, S.G., Andersen, J.M., Asman, W.A.H., 2001. A detailed ammonia emission inventory for Denmark. Atmos. Environ. 35, 1959–1968.
Hutchings, N., Nielsen, A.H., Grant, R., Gyldenkærne, S., Knudsen, L., 2005. Regulations and environment. Denmark. Part I. In: Bos, J., Pflimlin, A., Aarts, F., Verte´s, F. (Eds.), Nutrient management on farm
scale. How to attain policy objectives in regions with intensive dairy farming. Report of the first workshop of the EGF Workshop. Available on-line (March 1st 2006) at http://www.nitrogenworkshop.org/PDF/ Rapport_83_drukversie.pdf, Plant Res. Int. 83, 77–80.
Hvid, S.K., 2005a. Næringsstofregnskaber for kvægbrug 2003. Planteavl-sorientering [07-539]. Landscentret. Dansk Landbrugsra˚dgivning. Available on-line (March 1st 2006) at http://www.lr.dk/planteavl/infor-mationsserier/planteavlsorientering/pl07-539.htm.
Hvid, S.K., 2005b. Næringsstofregnskaber for svinebrug 2003. Planteavl-sorientering [07-543]. Landscentret. Dansk Landbrugsra˚dgivning. Available on-line (March 1st 2006) at http://www.lr.dk/planteavl/infor-mationsserier/planteavlsorientering/pl07-543.htm.
Hvid, S.K., Weidema, B., Kristensen, I.S., Dalgaard, R., Nielsen, A.H., Bech-Larsen, T., 2004. Miljøvurdering af landbrugsprodukter. Miljøs-tyrelsen, Miljøprojekt, 954. Available on-line (March 1st 2006) athttp:// www.mst.dk/udgiv/publikationer/2004/87-7614-395-3/html/kolo-fon.htm.
IPCC, 1997. Greenhouse gas inventories. Revised 1996 IPCC Guidelines for National Greenhouse Gas Inventories. Available on-line (March 1st 2006) athttp://www.ipcc.ch/pub/guide.htm.
IPCC, 2000. Good practice Guidance and Uncertainty Management in National Greenhouse Gas Inventories. Chapter 4. Agriculture. 4.1– 4.83. IPCC. Available on-line (March 1st 2006) at http:// www.ipcc.ch/pub/guide.htm.
Jarvis, S.C., Aarts, H.F.M., 2000. Nutrient management from a farming systems perspective. In: Søegaard, K., Ohlsson, C., Sehested, J., Hutchings, N.J., Kristensen, T. (Eds.), Grassland Farming. Balancing environmental and economic demands, vol. 5. Proceedings of the 18th General Meeting of the European Grassland Federation, Aalborg, Den-mark, 22–25 May 2000, pp. 363–374.
Jarvis, S.C., Menzi, H., 2004. Optimising best practice for N management in livestock systems: meeting production and environmental targets. In: Lu¨scher, A., Jeangros, B., Kessler, W., Huguenin, O., Lobsiger, M., Millar, N., Suter, D. (Eds.), Land Use Systems in Grassland Dominated Regions, vol. 9. Proceedings of the 20th General Meeting of the European Grassland Federation, Luzern, Switzerland, 21–24 June 2004, pp. 361–372.
Knudsen, M.T., Kristensen, I.S., Berntsen, J., Petersen, B.M., Kristensen, E.S., in press. Estimated N leaching losses for organic and conventional farming in Denmark. J. Agric. Sci.
Kristensen, E.S., Høgh-Jensen, H., Kristensen, I.S., 1995. A simple model for estimation of atmospherically-derived nitrogen in grass-clover systems. Biol. Agric. Hortic. 12, 263–276.
Kristensen, I., 2005. Uncertainties on farm gate N-balances. Available on-line (March 1st 2006) at http://www.agrsci.org/var/agrsci/storage/ori-ginal/application/5a688dc9a578d95250a831cfaac06735.pdf.
Kristensen, I.S., Nielsen, A.H., Kristensen, T., Hvid, S.K., Kristensen, K., 2004. Usikkerhed ved beregning af nøgletal for miljøpa˚virkninger. Kap 5. i MST-rapport: ‘‘Miljøvurdering af landbrugsprodukter’’. Miljørap-port [954], pp. 39–46. Available on-line (March 1st 2006) athttp:// www.mst.dk/udgiv/publikationer/2004/87-7614-395-3/html.
Kristensen, I.S., Halberg, N., Nielsen, A.H., Dalgaard, R., 2005a. N-turn-over on Danish mixed dairy farms. Part II. In: Bos, J., Pflimlin, A., Aarts, F., Verte´s, F. (Eds.), Nutrient management on farm scale. How to attain policy objectives in regions with intensive dairy farming. Report of the first workshop of the EGF Workshop. Available on-line (March 1st 2006) at http://www.nitrogenworkshop.org/PDF/Rapport_83_drukver-sie.pdf, Plant Res. Int. 83, 91–109.
Kristensen, I.S., Dalgaard, R., Halberg, N., Petersen, B.M., 2005b. Kvæl-stofbalance og -tab fra forskellige bedriftstyper. Sammendrag af indlæg. Plantekongres 2005. 11–12 januar, Herning Kongrescenter. ISBN 87-984996-6-1. pp. 190–191. Available on-line (March 1st 2006) athttp:// www.lr.dk/planteavl/diverse/plantekongres2005_tema_11.htm#ses-sion11-1.