OPTIMIZATION OF BOLTED JOINTS CONNECTING
HONEYCOMB PANELS
G. Bianchi
(*), G. S. Aglietti
(*), and G. Richardson
(**)(*)
School of Engineering Sciences, University of Southampton, Southampton SO17 1BJ, UK
(**)
Surrey Satellite Technology Limited, Tycho House, Surrey Research Park, Guildford, GU2 7YE,
UK
ABSTRACT
The paper examines the range of issues associated with the optimization of bolted joint connections between honeycomb panels, representative of spacecraft structures. The first part of a large body of work, involving the application of experimental, finite element and analytical methods, has been carried out.
A procedure has been developed to maximize the load carrying capability per unit mass of shear joints by optimizing the balance between the number of bolts and the size of the bolts used in the joint system.
The finite element method has been used with the primary aim of analyzing the stress levels experienced by the connection strips of bolted joints under different loading conditions and to investigate the effect of modifying various design parameters (e.g. connection strip thickness and number of bolts).
Lastly, a test campaign has been carried out to asses the performance of honeycomb panel inserts subjected to out of plane loads in “T” joint applications. Test results obtained from two different insert systems are compared together with static strength capability results obtained from an analytical model.
1 INTRODUCTION
Honeycomb panels are extensively used in spacecraft structures due to their high specific strength and specific stiffness properties. Honeycomb panels are advanced sandwich elements consisting of low modulus lightweight cellular (honeycomb) core sandwiched between high modulus, high strength face sheets. The assembly maximizes stiffness-to-weight ratio and bending strength-to-weight ratio, resulting in a panel structure that is particularly effective at carrying distributed loads. Because of these attributes honeycomb panels are extensively used in spacecraft structures.
Bolted joints are the normal choice when connecting honeycomb panels to form spacecraft assemblies. Because of the weakness of the core, honeycomb sandwich structures are not suited to carrying point or line loads. A local reinforcement of the core, usually in the form of one or more metallic inserts, is thus required where the joint is to be established. This feature makes
this type of bolted joints different and slightly more complex than conventional ones.
One of the disadvantages in using bolted joints and mechanical fastenings in general is that they add more mass than other attachment methods such as welds or
adhesive bonds[1]. In a spacecraft where the primary
structure consists of an assembly of honeycomb panels, bolted joints can represent a significant proportion of the mass of the structural subsystem. Considerable mass savings can thus be gained by optimizing bolted connections in terms of load carrying capability per unit mass. In light of this, a project is underway to develop a procedure to aid the spacecraft designer in selecting optimum joint configurations.
2 TYPES OF JOINTS
The three main configurations in which honeycomb panels are normally connected are the following:
• In-plane Joints
• ‘T’ Joints
• Corner Joints
These are briefly described in the following subsections.
2.1 In-plane Joints
An illustration of an in-plane joint between honeycomb panels is shown in the following Figure:
FIG 1. Illustration of an in-plane joint between honeycomb panels.
The in-plane panel joint ideally operates as a shear joint in which the loads are transmitted in the transverse direction to the longitudinal axis of the bolts. Such joints can be designed according to two fundamentally different philosophies:
Edge Inserts
[image:1.595.307.540.546.656.2]• Friction grip or slip resistant design
• Bearing type or slipped joint design
A friction grip joint design relies on a sufficiently high clamping force to prevent slippage of the clamped joint
parts due to external (transverse) loading, FQ. A bearing
joint is one in which the clamped parts have slipped until the bolts “bear” the clearance holes. Bolts in this type of joint configuration are subjected to a combination of axial and shear stresses.
In many industries the friction grip option is taken for the following reasons. Provided that slip does not occur the bolt only feels tensile load due to preload. Furthermore the high bolt preload required to produce the necessary clamping force means that the bolt only feels a small portion of externally applied tensile loads, which greatly increase fatigue resistance. Another advantage is that large clearance holes can be used which facilitates assembly and interchangability. The shear joints considered here are designed to operate in friction grip conditions.
In the in-plane panel joint shown in FIG 1 the edges of the honeycomb panels are sandwiched between two connection strips and the load is transferred via two faying surfaces. The same type of connection can also be established using only one strip but in such a configuration the joint is not symmetric to the loading axis and a moment is introduced. Hence, a design with two connecting strips should be used when possible.
2.2 ‘T’ Joints
An illustration of a ‘T’ joint between honeycomb panels is shown in the following Figure:
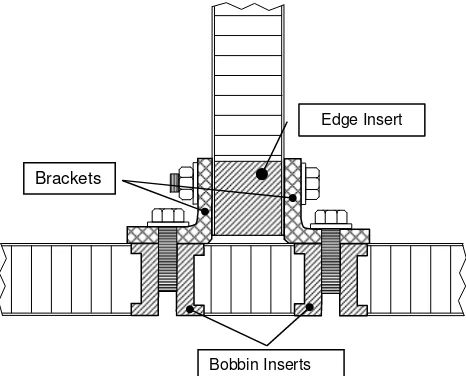
FIG 2. Illustration of a ‘T’ joint between honeycomb panels.
From the illustration it can be seen that the upper part of the joint, where the vertical panel connects with the brackets, is equivalent to one side of an in-plane joint and will ideally operate as a shear joint. In the lower part of the joint the base of the bracket is connected to the horizontal panel via a fastener. Here the horizontal panel
is locally reinforced with two lines of bobbin inserts that follow the length of the joint. These inserts are primarily subjected to out-of-plane loads and it follows that their pull-out strength is a limiting factor in the overall strength of the ‘T’ joint.
2.3 Corner Joints
An illustration of a typical corner joint between honeycomb panels is shown in the figure below:
FIG 3. Illustration of a corner joint between honeycomb panels.
In terms of load transfer mechanism corner joints are relatively similar to in-plane panel joints since in many circumstances one or both sides of the joint operate like a shear joint. If the loading action is parallel to the joint line then both sides of the joint will operate as shear joints. If load is parallel to one panel but orthogonal to the joint line then the side of the joint associated with that panel will operate as a shear joint while the other sided will operate as an axially loaded joint.
3 INSERTS
In spacecraft structures inserts are hard points which allow the transmission of point or line loads. Apart from panel to panel connections inserts are also used for attaching external equipment (boxes, feed lines, cable ducts) and to establish connections with other structural elements (frames, profiles).
Edge inserts are specifically designed for shear joint applications. These inserts are elongated in shape and normally span the length of a bolt group but they may also be long enough to cover the entire length of a panel edge and support multiple bolt groups. As well as supporting the high clamping load from the bolts edge inserts also protect the panel edge from any external damage. Although not specifically designed for the task the more generic bobbin insert design can also be used at the panel edge for shear joint applications. Using bobbin inserts does not protect the panel edge from external damage but has the advantage of being more cost
Edge Insert
Bobbin Inserts
Brackets
Nut Plate
[image:2.595.319.537.171.361.2] [image:2.595.58.291.457.645.2]effective since the insert design is simpler and requires less machining time.
The type of inserts used to resist out of plane loads in ‘T’ joints are analogous to the type of inserts used to attach external equipment. Hence, for convenience, these inserts are referred to as equipment inserts here and are going to be discussed in more detail in the next section.
3.1 Equipment Inserts
Generally equipment inserts are metallic and are in the shape of a hollow cylindrical body with flanged ends (i.e. in the shape of a bobbin). The mechanical connection is achieved through the hollow part of the insert, which in most cases is threaded but can also be an unthreaded clearance hole for a through-the-thickness type insert. The load transfer is actually achieved via the contribution of various structural elements, so it is more appropriate to talk about the “insert system”. This structural system consists of three main components: the insert itself, the surrounding sandwich structure, and filling material (adhesive foam or potting compound). The filling material is required to provide a connection between the insert and the surrounding sandwich structure elements in order to ensure a proper load transfer: the transmission of shear loads from the insert to the surrounding honeycomb core walls is of primary importance.
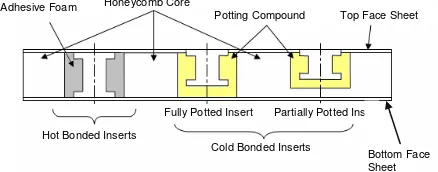
Equipment inserts can be split in two important categories depending on the method of integration into the honeycomb panel; hence a distinction is made between hot bonded inserts and cold bonded inserts (see FIG 4). In the hot bonded arrangement the insert flanges are bonded with both of the panel face sheets and the insert body is surrounded by adhesive foam, which acts as the filling material of the insert system and allows axial loads to be transmitted to the honeycomb core via shear. The insert is thus sandwiched between the two face sheets and must be of the same height as the honeycomb core. A hot bonded inserts may thus be also regarded as a
through-the-thickness type insert[4],[5]. A through-the-thickness
arrangement can also be obtained by using the cold bonded method of integration but, normally, this is used to produce either fully potted or partially potted insert arrangements. In the present paper cold bonded inserts are treated as having either fully potted or partially potted arrangements. In these arrangements the insert is immersed in a potting compound (generally a two-component resin) and only the side of the top flange is in contact with the top face sheet of the panel. The insert is thus potted into a hole machined into an existing sandwich panel. The potting compound plays an analogous role to the adhesive foam used for hot bonded inserts (i.e. operates as the filling material), but also acts as a bonding medium between the bottom of the insert and the under laying honeycomb core (for a partially potted insert) and face sheet (for a fully potted insert). To provide an adequate bond, a minimum layer of compound is required underneath the insert. This means that the insert height has to be shorter than the core height but,
provided that this condition is met, inserts of different heights can be used.
Although inserts have been widely used in the
aerospace industry, little material has been published in
the field of equipment inserts[3],[9] and most of the
published work deals with cold bonded inserts
FIG 4. Illustration of insert types used in honeycomb panels.
4 JOINT O PTIMIZATION
Bolt size and the number of bolts are the most important parameters to consider when optimizing bolted joints. Because bolts come in discrete sizes (e.g. M4, M5, M6, etc. for metric bolts) there is only one optimum combination of bolt size and bolt number which will maximize the efficiency of joint under a given load. A procedure aimed at selecting optimum combinations of bolt size and bolt number has been implemented in a system of Excel spreadsheets which is described in the following section.
4.1 Analysis Procedure
The system of spreadsheets relies on a bolt selection procedure for friction grip joints which is outlined in the
ESA manual on threaded fasteners[2].
From a given bolt number and a bolt material the bolt selection procedure is used to select the minimum required bolt sizes for a range of external loads. The bolt sizes are selected from a bolt database which contains information regarding preload capabilities and mass of all the listed bolts. The inserts used in friction grip joints are primarily subjected to a compressive force due to bolt preload and can thus be sized according to the type of bolt that is used in the joint. The bolt database includes the size and mass of the optimized inserts corresponding to all the listed bolts. Making an assumption for the thickness of the connecting strips and the separation between bolts it is possible to determine the strip mass per bolt.
Hence, when a bolt is selected from the bolt database it is also possible to determine the mass of the resulting joint. Dividing the external load by this value gives the efficiency of the joint in terms of load carrying capability per unit mass.
Using the data generated in the spreadsheets it was possible obtain plots which show how joint efficiency for
Adhesive Foam Honeycomb Core
Top Face Sheet
Fully Potted Insert Partially Potted Insert
Cold Bonded Inserts Hot Bonded Inserts
Potting Compound
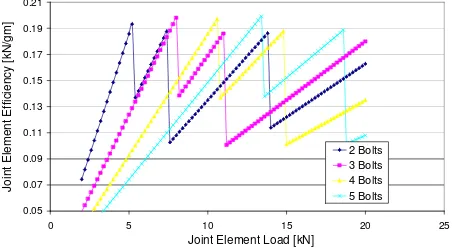
[image:3.595.308.527.154.240.2]2 to 5 bolt number joint configurations varies with external load. One of these plots is shown in FIG 5. This plot was generated using stainless steel bolt properties and is relevant to in-plane joint configurations between two 20 mm thick honeycomb panels.
0.05 0.07 0.09 0.11 0.13 0.15 0.17 0.19 0.21
0 5 10 15 20 25
Joint Element Load [kN]
J
o
in
t
E
le
m
e
n
t
E
ff
ic
ie
n
c
y
[
k
N
/g
m
]
2 Bolts 3 Bolts 4 Bolts 5 Bolts
FIG 5. Joint efficiency plotted against external joint load.
[image:4.595.63.289.130.254.2]The behaviour of the curves shown in the above plot can be explained as follows: While the bolt size remains unaltered the overall joint mass stays constant and consequently the efficiency increases linearly with external load. However, after a certain limit in external load is reached a step increase in bolt size is required to provide the necessary clamping force. The selection of a larger bolt size causes a sharp increase in joint mass which in turn results in a sharp decrease in joint efficiency. The process repeats again and again and is graphically represented by the sawtooth shaped curves in FIG 5.
The plot in FIG 5 shows that the optimum number of bolts required to maximize joint efficiency is dependent on external load; however, there is no trend towards fewer or greater bolt numbers at lower or higher values of external load. For each curve it can be seen that the efficiency is at its highest when the bolts are operating at a preload level close to their maximum allowable. The sawtooth curves representing the different bolt numbers are staggered meaning that the optimum number of bolts alternates over different external load ranges. Because of this alternating pattern being able to produce a plot of the type shown in FIG 5 can be of great assistance when designing bolted joints.
4.2 Finite Element Analysis of Bolted Joints
Apart from generating enough clamping force to ensure friction grip conditions, another important factor in designing bolted joints between honeycomb panels is to ensure that the connecting strips are strong enough to support the external loads that are applied to the joint; the connection strips are subjected to particularly high stress levels when out of plane bending loads are applied to the joint. In light of this, numerous FE analysis of different joint configurations were carried out with the main aim of assessing the stress levels experienced by the connection strips under different loading conditions.
Various configurations of an in-plane bolted joint between two honeycomb panels were modelled in order to assess the effect of the following parameters: no. of bolts, separation between bobbins, and bolt material.
Geometric models of the joints were crated in SolidEdge and were then exported to Ansys Workbench for postprocessing and analysis. For each model five sets of results were generated by considering five fundamental
loading conditions: in-plane tension, in-plane
compression, in-plane shear, out of plane shear, and out-of-plane bending.
in-plane tension
in-plane
compression in-plane shear
Out-of-plane shear
out of plane bending
FIG 6. Loading conditions considered for FE analysis of bolted joints.
A large amount of data was generated from the FE analysis of the various models; however, the presentation of these quantitative results is outside the scope of this paper. Instead, attention will be focused on the more insightful qualitative findings that were interpreted from the data.
The following are some of the key findings:
• The most highly stressed components are almost
always the connection strips.
• Larger bolt groups appear to be less effective
than smaller ones. However, larger bolt groups are more attractive when considering single point failure.
• Bolt preload alone takes the bolts close to the
maximum stress allowable. There is a need to find better ways of distributing the high clamping forces generated by bolt preload.
5 TESTING OF EQUIPMENT INSERTS
[image:4.595.311.546.194.376.2]Testing work has been carried out on both hot bonded and cold bonded reference samples and is presented here after some background information about the structural performance of equipment inserts in general. Results obtained from an analytical model relevant to the tested samples are also presented.
5.1 Static Strength Capabilities of Equipment
Inserts
The insert system can be subjected to 5 basic types of loads which may act alone or in different combinations. Bending and torsional loads should be minimized since inserts are not suited to carrying these types of loads. Torsional loads in particular should be just limited to screwing and locking torques only. Excessive bending and torsional loads can be easily avoided by using insert groups to convert moments into simple forces which are either parallel or normal to the insert axis (e.g. bending loads can be avoided by using coupled inserts which convert the load to tension/compression).
The normal tensile and compressive load carrying capabilities are the most important strength parameters in defining the structural performance of inserts. In the
Insert Design Handbook[3] strength data regarding the
structural performance of cold bonded inserts is limited to normal tensile and compressive loads, and the literature available on the topic of inserts in general is only concerned with these two load types.
5.2 Failure Modes under Normal Tensile
Loads
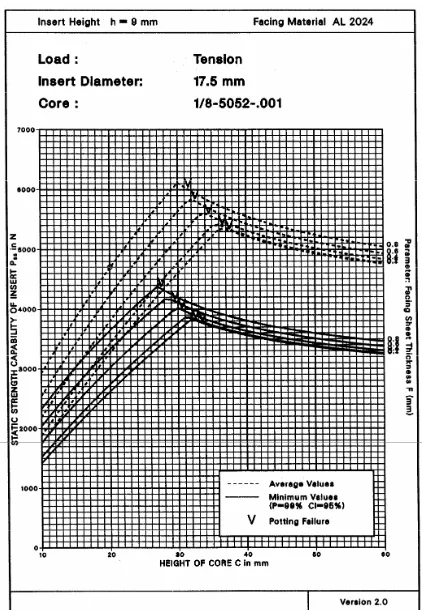
In the Insert Design Handbook it is shown that, for a given potting height hp, the decisive failure modes affecting the static strength capability Pss of a cold bonded insert are primarily influenced by the core height c. In the graph shown in FIG 7 it can be seen how the Pss of a cold bonded insert varies with core height. Looking at the Pss curve it is possible to split the graph into three areas, each of which associated with a failure mode. In the first part of the graph, starting from hp = c, the Pss increases quasi-linearly with core height. Here the insert system fails by shear rupture of the core surrounding the insert so the property limiting the Pss is the shear strength of the core. The Pss increases quasi-linearly in with core height because of the corresponding increase in area over which the shear load is distributed. As the core height increases the insert becomes partially potted and the core underneath the potting is subjected to tensile stress. When c – hp reaches a critical value the tensile stress underneath the potting reaches the tensile strength of the core, and the second failure mode (coinciding with the second part of the graph) comes into affect. Now the insert fails by the combination of shear rupture of the core around the potting and tensile rupture of the core underneath the potting occurring together: the Pss is then simultaneously limited by the core shear strength and the core tensile strength and, as illustrated in the second part of the graph, is almost independent of further increases in core height.
The potting underneath the insert is also subjected to tensile stress which increases with core height. If this stress exceeds the tensile strength of the potting compound before the tensile strength of the core is reached the insert will fail by tensile rupture of the potting. This is likely to occur for strong cores when a certain core height is reached. As can be seen in the graph, for this third failure mode, further increases in core height result in a mild decrease in Pss.
FIG 7. Influence of height of core on failure modes[3].
For hot bonded inserts the insert height hi is always equal
to the core height hc and consequently shear rupture or
buckling of the core around the insert are the only relevant failure modes for this insert type; hence static strength capability always increases quasi-linearly with core height.
5.3 Testing Procedure
Hot bonded insert reference samples and cold bonded insert reference samples where produced in order to conduct pull out tests. The same sandwich panel specifications were used for both of these coupon types. The sandwich structure consisted of two identical aluminum face sheets 0.5 mm in thickness, sandwiching a 19 mm thick aluminum core, designated as ¼” - 5056 - .0025” (which should be read as: cell size in inches – Al alloy – foil thickness in inches) , 6.35 mm in cell size and 83 kg/m3 in density. All reference samples had dimensions 80 × 80 × 20 mm.
The hot bonded insert reference samples incorporated a centrally located aluminum bobbin insert, 16 mm in outer diameter, 19 mm in height (i.e. same height as the core), introduced during sandwich panel production.
For the cold bonded reference samples aluminum bobbin inserts were potted at the center of existing sandwich panel squares cut to match the dimensions specified above. The outer diameter has a major influence on Pss so in order to ensure a proper comparison with the hot bonded reference samples the inserts used here were also 16 mm in outer diameter but only 7.3 mm in height.
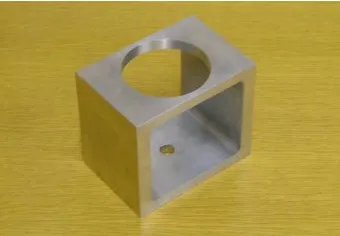
[image:5.595.314.531.173.322.2]All the reference samples where subjected to pull-out tests using an Instron 8802 servohydraulic testing machine. The testing was conducted in accordance with the guidelines outlined in the Insert Design Handbook. To comply with these guidelines a specifically designed test fixture (see FIG 8) was used to hold the samples and expose a free circular area 70 mm in diameter around the insert.
FIG 8. Aluminium test fixture.
The set-up used for all the tests is shown in FIG 9 and is described as follows: An M5 bolt is connected to the reference sample via the female threaded part of the insert. The shank of the bolt is contained within a rectangular steel block, which can be clamped into the grips of the upper crosshead. The lower part of the test fixture has a hole in which a steel adapter is inserted. The adapter is in the shape of a cylindrical body with a flanged end and is clamped into the grips of the lower crosshead at the unflanged end.
FIG 9. Experimental set-up used for insert reference sample tests.
Once the above set-up was achieved, starting from an unloaded condition, the specimens were loaded at constant displacement rate of 1 mm/min until ultimate failure load occurred. During the tests load data and crosshead displacement data were recoded at a sampling rate of 1 Hz.
5.4 Experimental Results
5.4.1 Hot Bonded Reference Samples
A significant number of hot bonded reference samples were tested as described above. Load versus crosshead displacement curves were obtained for all the tested samples and curves obtained from one of the production batches of samples are shown in FIG 10.
Hot Bonded Reference Samples
0.0 0.5 1.0 1.5 2.0 2.5 3.0 3.5 4.0 4.5 5.0 5.5 6.0 6.5
0.00 0.20 0.40 0.60 0.80 1.00 1.20 1.40 1.60 1.80
Crosshead Travel [mm]
L
o
a
d
[
k
N
]
[image:6.595.88.258.154.272.2]Coupon 1 Coupon 2 Coupon 3
FIG 10. Load Vs crosshead displacement curves for tested hot bonded reference samples.
These results give an average strength capability PSS,av is 5.60 kN. The sample size was large enough to justify the calculation of a minimum A- basis value PSS,min , which was done by assuming a normal (Gaussian) distribution of the sample population and using the following expression:
(1)
P
SS,min=
P
SS av,− ×
s
k
99where k99 is a one-sided tolerance-limit factor which varies with sample size, values for which can be found in tabulated format in MIL-HDBK-5.
After testing some of the reference samples were sectioned across the center in order to check the manufacturing quality and identify failure modes (see FIG 11). By visual observation it is evident that buckling core surrounding the insert is the main failure mode. No manufacturing defects were detected in the sectioned reference samples.
FIG 11. Image of a hot bonded reference sample sectioned after testing.
5.4.2 Cold Bonded Reference Samples
[image:6.595.309.529.175.303.2] [image:6.595.94.253.415.592.2] [image:6.595.308.535.569.664.2]displacement curves obtained from these testes are shown in FIG 12. For Coupon a the slope of the load curve drops almost completely between 0.2 and 0.4 mm of crosshead displacement. This is probably due to slip occurring in one of the interfaces of the experimental set-up. The curve appears to follow the same behavior of Curve b after 0.4 mm.
Curve a shows a typical static strength capability PSS of 3.75 kN. The statistical sample was too small to determine a meaningful minimum A- basis value.
Pull-out Test Results for Potted Inserts
0.0 0.5 1.0 1.5 2.0 2.5 3.0 3.5 4.0
0.0 0.2 0.4 0.6 0.8 1.0 1.2 1.4 1.6
Crosshead Travel [mm]
Loa
d [k
N
]
[image:7.595.316.527.54.359.2]Coupon a Coupon b
FIG 12. Load Vs crosshead displacement curves for tested hot bonded reference samples.
[image:7.595.62.283.196.326.2]Again some of the reference samples were sectioned after testing (see FIG 13) to check the potting quality and identify the main failure mode. From FIG 13 it can be seen that the rupture of the potting underneath inserts is the main failure mode. Cracks which have developed from the corners of the lower flange can be also seen and are probably at the origin of the potting failure.
FIG 13. Image of a cold bonded reference sample sectioned after testing.
5.5 Analytical Analysis of Tested Insert
Systems
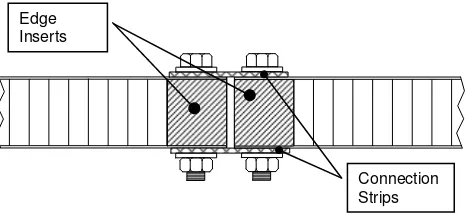
The Insert Design Handbook contains a vast range of data concerning the normal tensile and compressive strength capabilities of cold bonded inserts. These data are presented in the form of diagrams (see FIG 14) which, for a given core type and insert size; show how the minimum and average load carrying capability values vary with core height. Each diagram contains minimum and average load curves for five facing sheet thicknesses values varying from 0.1 to 0.8 mm. The minimum Pss values are regarded as A- basis values meaning that 99% of specimens are expected to exceed this value with a confidence level of 95%.
FIG 14. A typical diagram illustrating load carrying capabilities of cold bonded inserts.
The honeycomb cores for which diagrams have been produced were 0.02 or 0.03 mm in foil thickness and 3.2 or 4.8 mm in cell size, however the honeycomb core used for the experimental work described above is heavier with 0.06 mm foil thickness and 6.35 mm cell size.
The diagrams are actually produced using an analytical method which has been compared with test results to verify its validity and produce reliability coefficients.
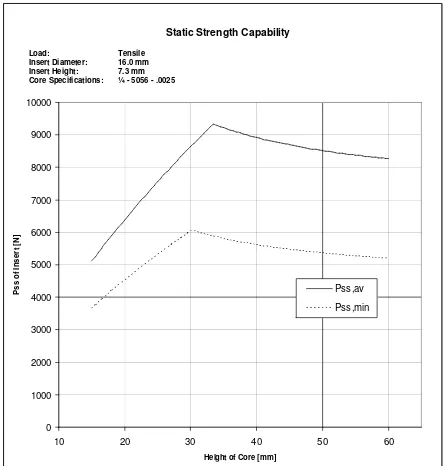
By incorporating this analytical model in an Excel workbook it was possible to accurately reproduce the diagrams shown in the Insert Design Handbook. By using the appropriate parameters a diagram relevant to the core specifications and insert dimensions used for the tested cold bonded insert reference samples was generated (see FIG 15). From the diagram it can be seen that for a core height of 19 mm the behaviour of both curves is still quasi-linear indicating that the insert system fails by shear rupture of the core around the potting. The predicted average PSS,av value is 6.14 kN and the minimum PSS,min value is 4.38 kN.
From the prospective of the analytical model the only difference between the hot bonded and cold bonded reference samples is in the insert height hi.
[image:7.595.56.293.457.521.2]break occurs at higher core height values and vice-versa. Hence if the diagram in Figure s was reproduced for a an insert height of 19 mm the break in the PSS,av and PSS,min curves would occur at higher values of core height. At a core height of 19 mm (i.e. the hot bonded insert configuration) the behavior of the curves would still be quasi-linear and indicate the same load carrying capability values PSS,av = 6.14 kN and PSS,min = 4.38 kN. This means that the analytical model does not distinguish between the hot bonded and cold bonded reference samples.
Static Strength Capability
0 1000 2000 3000 4000 5000 6000 7000 8000 9000 10000
10 20 30 40 50 60
Height of Core [mm]
P
s
s
o
f
In
s
e
rt
[
N
]
Pss,av
Pss,min
[image:8.595.62.286.189.422.2]Load: Tensile Insert Diameter: 16.0 mm Insert Height: 7.3 mm Core Specifications: ¼ - 5056 - .0025
FIG 15. Load carrying capability diagram produced from the analytical analysis of the tested cold bonded reference samples.
5.6 Discussion of Results
The experimental and analytical results are summarized in the following table:
Experimental
Results Analytical Results
PSS,av
[kN]
Typical
PSS [kN]
PSS,av
[kN]
PSS,min
[kN] Hot Bonded
Samples 5.60 N/A
Cold Bonded
Samples N/A 3.75
6.14 4.38
TAB 1. Summary of reults.
The experimental results obtained for the hot bonded and cold bonded reference samples are both lower than the analytical results obtained from the model found in the Insert Design Handbook. The difference is particularly significant for the cold bonded reference samples where the typical PSS is much lower than the analytical prediction. There is also a discrepancy in terms of the failure mode: the diagram in FIG 15 predicts a failure by shear rupture of the core around the potting but the tested
samples failed by rupture of the potting compound underneath the insert. Hence for the cold bonded reference samples the lower than expected load carrying capability occurs due to a premature potting failure. As mentioned above cracks developing from the corners of the lower flange were observed in the sectioned reference samples. These corners were quite sharp and it is likely that they caused excessively high stress concentrations, leading to an earlier failure of the potting compound and a lower than expected performance of the insert system.
The experimental results obtained for the hot bonded reference samples correlate better with the analytical predictions. The experimental PSS,av was about 9% lower than the analytical prediction and the experimental PSS,min was about 6% lower than the analytical prediction. However, as for the cold bonded reference samples, a discrepancy was noticed between the actual failure mode and that predicted by the model. Failure still occurs in the core but it involves buckling of the cell walls rather than shear rupture.
6 CONCLUSIONS
The paper highlights and takes the first steps in addressing the major issues associated with the optimization of bolted joints between honeycomb panels.
A procedure aimed at optimizing the combination of number of bolts and bolt size in shear joint applications was presented along with an example of the graphical results that can be obtained.
From the finite element analysis it was found that distributing the high clamping forces caused by bolt preload is one of the main limiting factors in designing joints that are light and have strength properties close to the honeycomb panels that they connect.
References
[1] Thomas P. Sarafin. Spacecraft Structures and
Mechanisms: From Concept to Launch. Kluwer Academic Publishers, 1995.
[2] Guidelines for Threaded Fastners, European Space
Agency, ESA PSS-02-208, Issue 1, 1989.
[3] Insert Design Handbook, European Space Agency,
ESA PSS-03-1202, Issue1, 1987.
[4] O. T. Thomsen, Sandwich plates with
‘through-the-thickness’ and ‘fully potted’ inserts: evaluation of differences in structural performance, 1998.
[5] O. T. Thomsen, W. Rits; Analysis and design of
sandwich plates with inserts - a high-order sandwich plate theory, 1998.
[6] P. Bunyawanichakul, B. Castanie, J. J. Barrau;
Experimental and Numerical Analysis of Inserts in Sandwich Structures
[7] W. S. Ericksen, The bending of Circular Sandwich
Plate Under Normal Load, Forest Products Laboratory, Report No. 1828, Madison 5, Wisconsin, US, 1953.
[8] E. D’Amato, Caratterizzazione Strutturale di Inserti
per Pannelli in Composito. Parte I: Dati Sperimentali, XXXV Convenzione Nazioinale AIAS, Ancona, Settembre, 2006.
[9] E. D’Amato, Caratterizzazione Strutturale di Inserti
![FIG 7. Influence of height of core on failure modes[3].](https://thumb-us.123doks.com/thumbv2/123dok_us/8489597.344387/5.595.314.531.173.322/fig-influence-height-core-failure-modes.webp)