varieties to weed harrowing
P K HANSEN*, I A RASMUSSEN*, N HOLST* & C ANDREASEN
*Department of Integrated Pest Management, Faculty of Agricultural Sciences, University of Aarhus, Research Centre Flakkebjerg, Slagelse, Denmark, and Department of Agricultural Sciences, Faculty of Life Sciences, University of Copenhagen, Taastrup, Denmark
Received 28 August 2006
Revised version accepted 8 March 2007
Summary
We investigated the tolerance to weed harrowing of four spring barley varieties and examined the possible inter-actions between varietal weed suppressive ability and two nutrient levels. Tolerance was defined as the combined effect of crop resistance (ability to resist soil covering) and crop recovery (the ability to recover in terms of yield). The weed harrowing strategy was a combination of one pre- and one post-emergence weed harrowing. In terms of yield, the four varieties respon-ded significantly differently to weed harrowing and the response depended on nutrient level. At the lower nutrient level, weed harrowing caused an increase in yield of 4.4 hkg ha)1for a strong competitor (cv. Otira),
while there was no effect on yield at the higher nutrient level. For a weaker competitor (cv. Brazil), weed harrowing caused no change in yield at the lower nutrient level, whereas yield decreased by 6.0 hkg ha)1 at the higher nutrient level. There were marked diffe-rences between the weed suppressive ability of the four varieties when not harrowed, with less pronounced but significant differences when harrowed. Weed harrowing did not change the weed suppressive ability of a variety. Varieties that are tall at post-emergence harrowing and have increased density after pre-emergence harrowing, are the ones that benefit most from weed harrowing.
Keywords: cereal varieties, image analysis, mechanical weed control, spring barley cultivars, weed competition.
HANSENPK, RASMUSSENIA, HOLSTN & ANDREASEN C (2007). Tolerance of four spring barley (Hordeum vulgare)
varieties to weed harrowing.Weed Research47, 241–251.
Introduction
Weed management in organic or low-input growing systems relies on the integration of preventive and curative methods (Barberi, 2002). Preventive methods like crop rotation (Bond & Grundy, 2001), fertiliser placement (Rasmussen, 2002) and use of competitive species and varieties (Lemerle et al., 2001) can keep weed populations at a manageable level within the growing system as a whole, while curative methods like pre- and post-emergence weed harrowing (Rasmussen, 1991) are required to control weeds when thresholds are exceeded. The spring tines of the harrow control weeds by uprooting and⁄or covering small weed plants with soil (Kurstjens & Kropff, 2001).
Pre- and post-emergence weed harrowing is often used in combination in organically grown spring cereals.
Timing is important for the success of pre-emergence weed harrowing, because it should be conducted just before crop emergence to ensure effective weed control without harming the crop (Rasmussen & Rasmussen, 1999). The efficacy of post-emergence weed harrowing relies on its selectivity, which has been defined as the ratio between the positive weed control effect and the negative crop cover effect (Rasmussen, 1992). If the weed plants are large relative to the crop plants, selectivity is reduced and the risk of damaging the crop mechanically or by soil coverage is increased (Rasmus-sen, 1991). The risk of crop damage also rises with the intensity of weed control, which is determined by the speed or aggresivity of the spring tines (Kurstjens & Kropff, 2001). Crop damage due to weed harrowing has been shown to reduce yield (Kirkland, 1994; Rasmussen & Svenningsen, 1995; Jensen et al., 2004). Apart from
the direct effect on yield through changes in crop growth, indirect effects on crop–weed competition from altered conditions may be important.
Toleranceto weed harrowing has been defined as the
combined characteristics of the crop to resist initial damage caused by weed harrowing and torecoverfrom this damage (Gundersen et al., 2006). Resistance to initial damage is related to the height of the crop and the flexibility and shape of the leaves (Kurstjens & Perdok, 2000). Kurstjens and Kropff (2001) found that uproo-ting was important for the resistance of the crops,
Lolium perenne L., Lepidium sativum L. and
Chenopo-dium quinoa Willd. However, for strongly anchored
plants, like cereals, soil covering is likely to be more important than uprooting. A crop with highrecoveryis characterised by growth traits well-suited to overcome soil covering and maintain yield. The degree of recovery from soil covering depends on burial depth, soil texture and plant recovery processes (Baerveldt & Ascard, 1999; Kurstjens & Kropff, 2001).
Lemerleet al.(2001) described several studies show-ing strong varietal differences in weed suppression. The majority of these studies have been conducted as a comparison between weedy and weed-free (herbicide-treated) conditions. Only a few studies have been conducted to estimate varietal differences in response to weed harrowing in cereals and to study if weed harrowing interacts with weed suppressive ability. Rasmussen et al. (2004) measured tolerance in spring barley (Hordeum vulgareL.) as the relative reduction in yield and found tolerance was negatively correlated with growth traits associated with weed suppressive ability.
The aim of this study was to investigate the tolerance of four spring barley varieties to weed harrowing under organic growing conditions at two nutrient levels. The weed harrowing strategy was a combination of one pre-and one post-emergence weed harrowing, as described by Rasmussen and Rasmussen (1995). We estimated the effect of weed harrowing (i) on soil covering of the crop just after harrowing, (ii) on yield and investigated (iii) the possible interactions among variety, weed harrowing and weed suppression.
Materials and methods
Experimental conditions
Four varieties of spring barley were chosen to represent the range in varietal weed suppressiveness among varieties in the Danish variety list (Anon, 2005c). The weed suppressive index (SI) of the varieties was 0.75, 0.91, 0.98 and 1.04 for Modena, Orthega, Otira and Brazil respectively (Hansenet al., 2006). SI indicates the expected relative amount of weed cover, where 1.00
equals an average variety. Suppressive varieties have lower SI values, and Modena was expected to be the most suppressive variety and Brazil the least.
The varieties were studied in field trials at Research Centre Flakkebjerg (5519¢N, 1124¢E) in 2004 and 2005 on sandy loam containing 12.4% clay, 60.1% silt, 25.5% sand and 2.0% organic matter. In 2004 and 2005, the precipitation from sowing to harvest was 283 mm and 207 mm respectively. Despite the greater precipitation in 2004, spring was characterised as being drier than in 2005. Growing day degrees (dC), accumulated from the date of sowing with a base temperature of 0C, was used as timescale. The interval from sowing to harvest was 1724 dC in 2004 and 1660 dC in 2005. The crop rotation of the experimental areas is shown in Table 1. The soil was mouldboard ploughed to a depth of 25 cm in late autumn.
The field trials were split-plot designs. Whole plots consisted of the eight combinations of three factors; two levels each of herbicides (±), weed harrowing (±), and nutrient level (40% or 80% of the recommended nitrogen need) (Anon, 2003). The eight subplots were arranged in two neighbouring rows with four subplots per row. Each subplot consisted of the four varieties in pure stands, three two-component mixtures and one three-component mixture of the varieties. The mixtures were not considered but were included in the primary statistical analysis to adjust for experimental design. An a-design was used to optimise the comparisons between varieties within whole plots (Patterson & Williams, 1976). With three replicates, there were 192 plots each year.
The gross plot size was 2.5·14.5 m2and the net plot size was 1.50·12.0 m2. The net plots were split into a part used for non-destructive measurements and com-bine harvesting (1.5·9.5 m2) and a part used for destructive measurements (1.5·2.5 m2).
The crop was sown with a seed drill with 12.0 cm row width on 15 April 2004 and 13 April 2005. Seed rates
Table 1 Crop rotation in experimental fields prior to experiment
Year 2004 2005
2000 Oats (Avena sativaL.) 2001 Spring barley with white
clover (Trifolium repensL.) under sown
Lucerne (Medicago sativaL.)
2002 White clover for seed production
Lucerne
2003 Winter rape (Brassica napusssp.napusL.)
Oats
2004 Spring barley, experiment Winter wheat (Triticum aestivumL.)
were adjusted for seed weights and germination rates to give a population of 350 plants m)2. As model weeds, we used a mixture of 25% viable seeds of Chenopodium
album L., 25% Phacelia tanacetifolia Benth., 25%
Brassica napusssp.napusL. and 25%Trifolium incarn-atum L. cv. Poppelsdorfer in plots with no pesticide treatments. The weeds were sown on 16 April 2004 and 13 April 2005 at a density of 200 seeds m)2. The naturally occurring weeds wereStellaria media(L.) Vill.,
Sinapsis arvensis L., Viola arvensis Murray, Veronica arvensisL.,Thlaspi arvenseL. andPolygonum convolvu-lusL.. The total density of these species did not exceed 50 plants m)2 and the biomass of these species was included in the total weed biomass. Due to heterogene-ous infestations of Cirsium arvense (L.) Scop. in the experiments, the density of this species was recorded on 6 July 2004 (992 dC) and 1 August 2005 (1435 dC). In the herbicide-treated plots, we applied a mixture of 7.5 g tribenuron-methyl ha)1 (Express ST, 500 g a.i. kg)1; DuPont Danmark Aps, Copenhagen, Denmark), 108 g fluroxypyr ha)1(Starane 180, 180 g a.i. L)1; Dow AgroSciences Danmark A⁄S, Copenhagen, Denmark) and 150 g surfactant ha)1(Lissapol Bio, 1000 g a.i. L)1; Syngenta Crop Protection A⁄S, Copenhagen, Denmark) on 12 May 2004 (310 dC). In 2005 (13 May 2005, 265 dC) we applied a mixture of 24 g ioxynil + 24 g bromoxynil ha)1 (Oxitril CM, 200 g + 200 g a.i. L)1; Bayer CropScience, Copenhagen, Denmark), 0.0255 g mefenpyr-diethyl ha)1+ 0.0085 g iodosulfuron-methyl-Na ha)1 (Hussar, 150 + 50 g a.i. kg)1; Bayer Crop-Science) + 400 g surfactant ha)1 (Isoblette, 1000 g a.i. L)1; Bayer CropScience). The applications were per-formed at a dosage of 150 L ha)1 with nozzle type S-ISO-LD-02-110 (Hardi International, Helgeshøj Alle´ 38, Taastrup, Denmark) and a pressure of 230 kPa. Driving speed was 6 km h)1. All dosages and mixtures were determined using the decision support system Crop Protection Online (Anon, 2005b). We assumed no interactions between herbicide treatments and the growth and development of the varieties.
One pre-emergence weed harrowing was conducted on 25 April 2004 (129 dC) and 21 April 2005 (79 dC). The driving speed was approximately 9 km h)1. On 13 May 2004 [319 dC, crop growth stage (GS) 21–22 (Lancashire et al., 1991)] and 17 May 2005 (300 dC, crop GS 21–25) one post-emergence weed harrowing was conducted with a driving speed of approximately 7–8 km h)1. The weeds were between cotyledon stage to four true leaves. The intensity of harrowing was adjusted by driving speed in an attempt not to exceed an average of 20% crop burial at the post-emergence weed harrowing. Weed harrowing was carried out with a spring-tine harrow (Einbo¨ck, Dorf an der Pram, Austria). The post-emergence weed harrowing in 2004 was carried out on
humid soil, while the soil was dry on the surface in 2005. In both years, pre- and the post-emergence weed harrowing were conducted under sunny and windy conditions resulting in fast drying of the soil.
Measurements
Tolerance to weed harrowing was measured as an immediate effect (area of plants covered with soil just after weed harrowing) and a long-term effect (yield). To estimate the degree of soil cover, two digital images were acquired twice weekly in every plot from crop emergence until 3 weeks after the post-emergence weed harrowing; subsequently, images were acquired weekly. Extra photographs were acquired immediately prior to the post-emergence weed harrowing. We used a Canon PowerShot G1 Camera. The exact positions of the images in the plots were marked to ensure that images were acquired at the same spot every time. The camera was mounted on a stand covered with white sheet clothing, to provide diffuse lighting conditions and to eliminate shadows and highlighted areas. The camera height was approximately 133 cm above the soil surface. The resolution of the images was 2086·1548 pixels, and they covered approximately 450·350 mm on the soil surface. Thus each pixel covered 0.22·0.22 mm soil surface. The camera set focus, ISO speed, white balance and shutter speed automatically. Images were saved as Canon RAW format, and converted to 24-bit PPM format with the free-ware program DCRAW.EXE
(Anon, 2005a). Images were loaded into MATLAB 6.5
(Anon, 2002) as RGB images and were converted to 8-bit greyscale images to make the green pixels more pronounced by using a slightly modified version of the algorithm described by Woebbeckeet al.(1995):
gx;y ¼2Gx;yRx;yBx;y ð1Þ
wheregx,yis the greyscale value of a pixel at position (x,y) in the image. R,G andB are non-normalised values from the red, green and blue channel respectively. To segment the pixels with high intensity (former green) from pixels with low intensity (former non-green), a modified version of an automatic thresholding technique was used, which chose the threshold to minimise the intra-class variance between green and non-green pixels (Otsu, 1979). After thresholding, a median filter was applied to reduceÔsalt-and-pepper noiseÕ. Vegetation cover (VC; %) was estimated in every image as the relation between the number of vegetation pixels and the total number of pixels in the binary images. Weed harrowing covered the leaves with soil, which was measured as the difference betweenVCjust before and just after harrowing (DVC; percentage point).
non-harrowed plots on 19 May 2004 (386 dC) and 25 May 2005 (396 dC) with a circular plate divided into four quarters. The plate had an area of 0.25 m2and was mounted on a measuring stick. The canopy height was defined as the vertical distance from soil surface to the underside of the plate when at least one leaf touched each of the four quarters of the plate.
Leaf area index (LAI; m2leaf area per m2ground area) was measured on 8 June 2004 (613 dC) and 1 June 2005 (496 dC). We measured twice in the same positions as the images and canopy heights, using LICOR 2000 Canopy Analyzer (LI-COR Biosciences, Lincoln, NE, USA) (Langet al., 1985; Welles & Norman, 1991).
Weed biomass (DMW; g m)2) was measured on 11
June 2004 (659 dC, crop GS 41–43) and 15 June 2005 (659 dC, crop GS 41–49) in all plots by cutting the plant material at the soil surface in a square 0.25 m2 frame. The plant material was separated into crop and weeds. The samples were dried at 100C for 24 h and dry matter was measured. The interval in dC between post-emergence weed harrowing and biomass measurement was 659)319 = 340 dC in 2004 and 659)300 = 359 dC in 2005. The experiments were harvested on 19 August 2004 and 16 August 2005 with a combine plot harvester and the yield (Y; hkg ha)1) was adjusted to
85% dry matter.
Crop density (DC; plants m)2) was recorded before
post-emergence harrowing on 4 May 2004 (207 dC) and 11 May 2005 (247 dC) as the number of crop plants in 1-m crop row replicated three ti1-mes rando1-mly in every plot.
Statistics
To adjust for experimental design and inhomogeneous presence of C. arvense, DVC, DC, DMW and Y were analysed with the following model:
Xgrcnhmv¼lþanþbhþcmþdv þ ½all two-factor interactions þ ½all three-factor interactions
þ ½the four-factor interaction þJtgrcnhmv þEgþFgnhmþGgrþHgcþIgrcnhmv ð2Þ
whereXgrcnhmvis the response (DVC,DC,DMW,LAIand Y) recorded for varietyv(regarding each variety mixture as aÔvarietyÕ), in replicateg and treated with nutrient leveln, herbicide levelhand weed harrowing levelm(and located in row r and column c). Jtgrcnhmv is the density of
C. arvense, which was considered as a random covariate.
Egis the random effect of replicate g.Fgnhmis the random effect of the whole plot with treatment combinationnhmin replicateg.Ggris the random effect of the incomplete block
r(in thea-design) in replicateg.Hgcis the random effect of columncin replicateg, andIgrchmvis the residual variance,
which is considered randomly distributed. We assumed all random effects to be normally distributed with mean zero and constant variances: r2
E;r2F;r2G;r2H;r2I. Greek letters indicate systematic effects. The two years were analysed individually and statistical analyses were carried out by the maximum likelihood method in the mixed linear model procedure (PROC MIXED) (SAS Institute Inc., 1999). To
ensure variance stability, VC was logit transformed and
DMWwas square root transformed. ForLAI,Y andDVC no transformation was necessary. Based on the model parameters we estimated yield, change in vegetation cover, LAI, crop density and weed biomass for each plot by the following model:
^
Xnhmvg¼^lþ^anþbbhþbcmþbdv þ ½all two-factor interactions þ ½all three-factor interactions
þ ½the four-factor interaction þbIgrcnhmv ð3Þ
where Xbnhmvg is the response (Ybnhmvg;DMdWnhmvg;
d
DVCnhmvg;LAIdnhmvg;DbCnhmvg) for each treatment and
replicate adjusted for experimental design and presence of C. arvense. ^l;ban;bbh;bcm;bdv andbIgrcnhmv indicate the estimated parameter values for l;an;bh;cm;dv andIgrchmv from Eqn (2). We excluded all data from variety mixtures and used the estimates in all further analyses.
The effect of weed harrowing in combination with the varietal weed suppressive ability on the weed biomass was estimated by
DWnvg¼DMdWnhmþvgDMdWnhmvg ð4Þ
where DWnvg corresponds to the absolute reduction in
weed biomass after harrowing in replicategand varietyv
at nutrient leveln, h) indicates herbicide untreated plots,
m+ indicates weed harrowed plots and m) indicates mechanically untreated plots. The effect of mechanical weed control on yield were estimated by
DYnvg¼YbnhþmþvgYbnhþmvg ð5Þ
whereDYnvgcorresponds to the absolute yield reduction
due to harrowing, h+ indicates herbicide treated plots (assuming no influence from weeds), and the other indices are as described above.
As there were significant treatment effects on crop density after pre-emergence harrowing, we estimated the difference in crop density between pre-emergence harrowed and non-harrowed plots by the following model:
DDCnvg¼DbCnhmþvgDbCnhmvg ð6Þ
whereDDCnvgindicates the difference in crop density due
to pre-emergence harrowing,m+ indicates harrowed plots,
These estimated values were used in the following analysis with a mixed linear model, which was common for the two years:
DXnvyg¼l0þa0nþd0vþ/yþunvþgnyþivyþjnvyþKnvyg ð7Þ
whereDXnvgis the response (eitherDYnvg,DWnvg,DVCnvg
orLAInvg) anda0nis the effect of nutrient level,d
0
v is the
effect of variety, /y is the effect of year, unv is the
interaction between variety and nutrient level,gny is the interaction between nutrient level and year, ivy is the
interaction between variety and year,jnvy is the
three-way interaction andKnvgy is the residual variance which
is assumed random and normally distributed with a constant variance ofr2
K.
Finally, we analysed ifDVCorDDcould explain the varietal differences in weed biomass and yield. We used data from plots with mechanical weed control but without herbicide treatment and analysed it with the following model:
b
Xnvgmþhy¼lþanþb
yþvnyþd
ðZÞ
nvgmþhyþEnvgm þhy ð8Þ
where Xbnvgmþhy is the response variable (either
b
WnvgmþhyorYbnvgmþhy), a* is the effect of nutrient level,
b* is the effect of year,v* is the effect of the interaction between nutrient level and yeard* is the effect ofZ(either DVCorDD) used as a covariate, andEnvgmþhyis the error which is considered random and normally distributed.
Results
Crop density (DC) was measured before post-emergence
weed harrowing and could thus only be affected by the pre-emergence harrowing. Measurements conducted after post-emergence harrowing comprising weed bio-mass (DMW⁄ DW), change in vegetation cover (DVC) and yield (Y⁄ DY), reflect the combined effect of both harrowings. Vegetation cover (VC) was measured after both pre- and post-emergence harrowing.
The varieties differed significantly in canopy height with similar patterns in both years, Modena and Brazil achieving the largest and smallest final height respec-tively (Table 2).
Effect of pre-emergence weed harrowing on vegetation cover and density
Pre-emergence weed harrowing reduced vegetation cover (VC; measured just before post-emergence weed harrowing) at the high nutrient level in herbicide-treated plots (P= 0.0165), from 39% in the non-harrowed to 35% in the harrowed plots (average of the two years),
while the low nutrient treatment had an average of 34%, irrespective of weed harrowing (Fig. 1). There was a strong additive effect of variety onVC, as variety did not interact with the other treatments.
Surprisingly, pre-emergence weed harrowing increased the crop density (DC) of Modena and Brazil
in both years and under both nutrient levels, by 26 and 25 plants m)2, respectively, averaged over all other factors (Fig. 2). For Otira,DCwas reduced by 11 plants
m)2on average by weed harrowing at the high nutrient level, while there was no significant difference at low nutrient levels. Pre-emergence weed harrowing had a negative effect onDCfor Orthega in 2004 (13 plants m)2
less) while in 2005 the opposite occurred (32 plants m)2
more).
Effects of post-emergence weed harrowing on vegetation cover and LAI
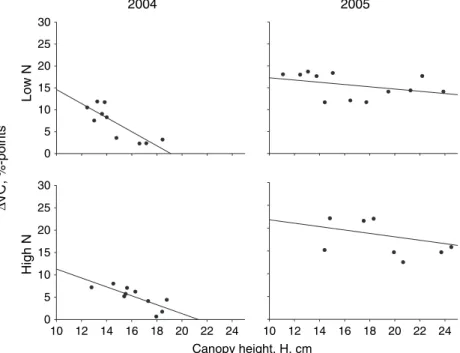
The change in vegetation cover (DVC) caused by post-emergence weed harrowing was analysed by Eqn (7) for differences between the varieties in the herbicide-treated plots. There was a very strong effect of variety (P< 0.0001) and year (P< 0.0001). We found sig-nificant effects of the interaction between nutrient level and year (P = 0.039). Orthega was covered less by harrowing than other varieties. We found only a 7% reduction in this variety compared with Otira, where the reduction was more than the double (15%). In herbi-cide-untreated plots,DVCrepresents the reduction in the sum of vegetation cover of both weeds and crop. There were only slight differences in the levels ofDVC, whether weeds were present or not, indicating that the main differences in DVC were caused by differences in crop cover (Table 3). We found a significant negative corr-elation between DVC and canopy height measured 6 days after weed harrowing in 2004 (low nutrient level,
P< 0.001; high nutrient level, P= 0.007). In 2005, there was no significant correlation (Fig. 3).
Leaf area index measured in the herbicide-treated, non-harrowed plots approximately 2 weeks after the post-emergence weed harrowing showed a strong
Table 2 Canopy height (H; 1 week after post-emergence harrowing and final) and leaf area index (LAI; final)
Variety
Canopy height;H(cm)
LAI
2004 2005
19 May Final 24 May Final 2004 2005
Modena 17 (0.5) 92 (1.3) 20 (0.9) 97 (1.7) 4.1 (0.1) 3.4 (0.1) Otira 14 (0.6) 81 (1.3) 15 (0.9) 79 (1.8) 4.7 (0.1) 3.4 (0.1) Orthega 18 (0.5) 79 (1.3) 21 (0.9) 82 (1.7) 4.2 (0.1) 3.1 (0.1) Brazil 14 (0.6) 76 (1.3) 13 (0.9) 74 (1.8) 3.9 (0.1) 2.4 (0.1)
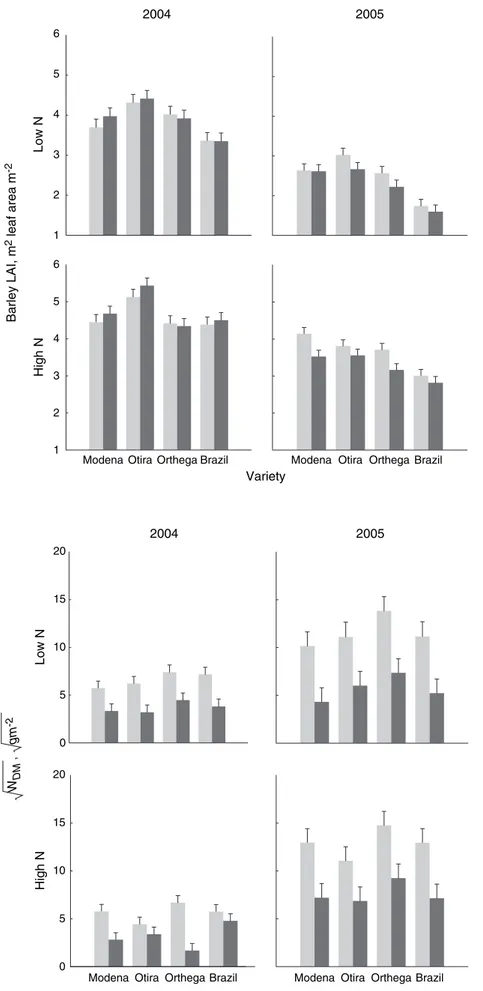
significant effect of variety Eqn (7), nutrient level and year (P< 0.0001 for all), but with an interaction between variety and year (P = 0.006) and between nutrient level and year (0.01) (Table 2, Fig. 4). For the change in LAI caused by harrowing, there was a significant difference between years, but there were no significant differences between varieties or any varietal interactions. There was no significant effect of weed
harrowing on LAI in 2004, while in 2005 harrowing caused a 9.3% reduction inLAI.
Due to the differences in crop density induced by the varietal differences in response to pre-emergence har-rowing, DD was used as a covariate in the analysis, which gave a significant improvement of the model Eqn (8). The slope ofDDwas 0.000263, which means that an increase caused by the pre-emergence weed harrowing of 2005
2004
Low N
0 20 40 60 80 100
Pre-emergence
harrowing Post-emergenceharrowing
Pre-emergence
harrowing Post-emergenceharrowing
Vegetation cover, %
High N
0 100 200 300 400 500 600 0 100 200 300 400 500 600 0
20 40 60 80 100
Pre-emergence harrowing
Post-emergence harrowing
Pre-emergence harrowing
Post-emergence harrowing
d °C
Fig. 1 Development of vegetation cover (VC) exemplified bycv. Brazil under the low nutrient level (upper) and the high nutrient level (lower) in herbicide-treated plots in 2004 (left) and 2005 (right). The solid lines show weed harrowed plots and the broken lines show non-harrowed plots. Vertical lines show standard errors.
2004 2005
Low N
260 280 300 320 340 360 380 400
Barley density, plants m
-2
High N
Modena Otira Orthega Brazil Modena Otira Orthega Brazil
260 280 300 320 340 360 380 400
Variety
1 plant m)2 would result in an increased vegetation cover of 0.026%.
Effects on weed biomass
In the non-harrowed, herbicide-untreated plots there was significantly more weed biomass in 2005 than in 2004 (Fig. 5). The biomass production differed among the varieties (P = 0.012): 114 g m)2 for Orthega, 85.7 g m)2 for Brazil, 74.9 g m)2 for Modena and 67.3 g m)2 for Otira (back-transformed averages over both years). Thus, there was 69% more weed biomass in non-harrowed and herbicide-untreated plots with Orth-ega compared with Otira. The only significant interac-tion was between nutrient level and year (P= 0.032).
In the weed-harrowed, herbicide-untreated plots, weed biomass was four times greater in 2005 than in 2004. As for the non-harrowed plots, we found a significant interaction between nutrient level and year; weed biomass was six times greater at the high nutrient level in 2005 (58 g m)2) compared with 2004 (10 g m)2), while at the low nutrient level there was only a three times increase from 2004 (13.8 g m)2) to 2005
(32.8 g m)2). We found a significant variety by year interaction (Fig. 5), as the plots seeded to Orthega had a greater amount of weed biomass (relative to plots seeded to other varieties) in 2005 versus 2004, while the opposite was true for Brazil. There were no significant interactions between variety and nutrient level. We tested ifDVCorDDcould explain some of the variation in weed suppression and found that there was no significant improvement of the statistical model Eqn (8) by adding eitherDVC, orDD, or both to the model.
An analysis of DW (from Eqn 7), as well as the relative reduction in weed biomass, showed no signifi-cant varietal differences, meaning that weed harrowing did not significantly affect the weed varietal suppressive ability, i.e. strong weed suppressors remained strong after weed harrowing.
Effects on crop yield
In the herbicide-treated plots without weed harrowing (Fig. 6), there were significant effects of variety (P< 0.0001), nutrient level (P< 0.0001) and year (P= 0.0026), and we found significant interactions between nutrient level and year (P= 0.022) and between variety and year (P= 0.002). In the herbi-cide-treated plots with weed harrowing (Fig. 6), we found a significant effect of variety (P< 0.0001), year (P< 0.0001) and nutrient level (P = 0.007), but yields responded differently at different nutrient levels in the two years (P= 0.0004). In 2004, there was no signifi-cant difference between the nutrient levels. In 2005, there was a strong significant difference with 7.1 hkg ha)1 increase from the low to the high nutrient level (Fig. 6). Table 3 Change in vegetation cover (percentage points) for
herbicide-treatedDVCdvhþand untreated plotsDVCdvh
Variety DVCdvhþ DVCdvh
Modena 0.10 (0.008) 0.12 (0.012)
Otira 0.15 (0.008) 0.12 (0.012)
Orthega 0.07 (0.008) 0.06 (0.011)
Brazil 0.13 (0.009) 0.17 (0.011)
Average over two years (standard error).
2004 2005
Low N
0 5 10 15 20 25 30
High N
10 12 14 16 18 20 22 24 0
5 10 15 20 25 30
10 12 14 16 18 20 22 24 Canopy height, H, cm
Δ
VC
, %-points
2004 2005
Low N
1 2 3 4 5 6
Barley LAI, m
2 leaf area m
-2
High N
Modena OtiraOrthegaBrazil Modena Otira OrthegaBrazil 1
2 3 4 5 6
Variety
Fig. 4 BarleyLAIfrom herbicide-treated plots adjusted for experimental design, under low (upper) and high (lower) nutrient levels in 2004 (left) and 2005 (right). Light grey bars show non-harrowed plots and dark grey bars show harrowed plots. Vertical lines indicate standard errors.
2004 2005
Low N
0 5 10 15 20
High N
Modena Otira Orthega Brazil Modena Otira Orthega Brazil 0
5 10 15 20
Variety
W
DM
,
gm
-2
We found a tendency for interaction between variety and nutrient level in the herbicide-treated plots that were harrowed (P= 0.068). This was caused by the relatively much greater yield response of Modena to the high nutrient level treatment in comparison with the other varieties.
The estimated yield difference between harrowed and unharrowed treatments Eqn (5) (light grey bars minus dark grey bars in Fig. 6) showed a strong tendency for varietal differences (P= 0.057), but this varietal effect interacted significantly with the nutrient level (P = 0.041). As a mean of the two years, Otira benefited significantly from the harrowing treatment (a yield increase of 4.4 hkg ha)1at the low nutrient level). In contrast, for Brazil we found a marked yield reduction as a result of harrowing in the high nutrient level treatments (a yield decrease of 6.0 hkg ha)1). Due to the marked varietal differences in crop density, we tested DD as a covariate, but it did not significantly improve the model.
Discussion
We found a significant negative effect of pre-emergence weed harrowing on vegetation cover (VC) at the high
nutrient level, but no significant differences between harrowed and non-harrowed at the low nutrient level (Fig. 1). This interaction indicates that the negative effects on VC, which usually are observed after pre-emergence weed harrowing (J. Rasmussen, pers. comm.), were reduced by a compensatory positive effect at low nutrient levels in varieties like Modena and Brazil. This could be the result of breaking a crusty soil surface or increasing soil temperature, oxygen levels and nitrogen mineralization. In a study with two to three post-emergence weed harrowings in spring wheat under conditions without any applied fertiliser, Steinmann (2002) concluded that post-emergence harrowing had only a minor effect on the nutritional status in the crop, but that the nitrogen content in the soil was increased significantly. We applied 40% of the optimal crop requirement (Anon, 2003) at the low nutrient level. At this level, a minor increase in nitrogen mineralization could compensate for damage caused by pre-emergence harrowing, making it a more suitable and viable practice under conditions of low versus high nutrient levels.
For Modena and Brazil, the positive effect of pre-emergence weed harrowing was expressed as a marked increase in crop density (Fig. 2). The varietal differences in crop density response could be caused by differences
2004 2005
Low N
30 40 50 60
Barley yield, hkg ha
-1
85% dm
High N
30 40 50 60
Modena Otira Orthega Brazil Modena Otira Orthega Brazil
Variety Fig. 6 Yield of the varieties in 2004 and
in speed of germination or vigour (Rasmussen & Rasmussen, 1999), emergence force (Bouaziz et al., 1990), or in response to changes in nutrient level, aeration and temperature caused by harrowing (Stein-mann, 2002). Bouaziz et al. (1990) found that a winter wheat variety had 100 % emergence when obstacles (clods, etc.) below 25 g were removed, and the emer-gence reduced linearly with increasing obstacle size. The study of Bouazizet al.(1990) included only one variety and there could have been an effect due to varietal differences in emergence force.
The marked varietal differences in resistance, meas-ured as change in vegetation cover (DVC, Table 3), could be explained by the differences in plant height at the time of harrowing (Table 2, Fig. 3). Similarly Kurstjens and Perdok (2000) found a linear correlation between percentage coverage and plant height for ryegrass (Lolium perenne L.). Thus varieties, which are high at the time of harrowing, are more likely to resist damage caused by post-emergence harrowing, and such varieties should be chosen if weed harrowing is planned. There was a small but significant positive correlation between the change in crop densityDDand DVC. The increase of 25 plants m)2 due to pre-emergence weed harrowing, found for Modena and Brazil, corresponded to an increase in coverage caused by post-emergence weed harrowing of 25·0.026 = 0.65%. This could be due to smaller and less cover-resistant crop plants in the varieties that showed an increase in crop density due to the pre-emergence harrowing treatment. Thus varieties, which are tall at post-emergence harrowing and have increased density after pre-emergence harrowing, are the ones that benefit most from weed harrowing.
We did not find any significant reduction in LAI
caused by harrowing in 2004, while there was a significant 9.3% reduction in LAI on average in 2005 (Fig. 4). Similarly Rasmussenet al.(2004) found negat-ive but non-significant effects on LAI. The efficacy of weed harrowing is very dependent on weather and soil conditions and differences among years are therefore also expected. We found no significant varietal interac-tions with weed harrowing, indicating that weed har-rowing affectsLAIin an additive fashion.
Rasmussenet al. (2004) found that varieties respon-ded differently to weed harrowing when measured on relative yield reduction and that the yield response was negatively correlated with parameters associated with competitive ability. The yield of high yielding varieties was affected significantly more than that of low yielding varieties. However, there was still an overall yield benefit from choosing high versus low yielding varieties, even when plots were harrowed. In that study, there was an interaction with disease severity, as mildew tended to be more aggressive in short (less suppressive) varieties. We
used the absolute yield difference between harrowed and unharrowed plots, thus eliminating the possible effects of different levels of diseases. We found very different varietal responses on crop yield, as weed harrowing was significantly beneficial for Otira, while Brazil suffered from weed harrowing. Brazil tended to be the highest yielding variety under herbicide-treated, non-harrowed conditions at both high and low nutrient levels, while Otira had an intermediate yield. We found that the highest yielding varieties did not always result in the highest yield because of differences amongst varieties in their tolerance to weed harrowing.
We found that a variety with strong weed suppressive ability remains a strong weed suppressive variety, whether or not weed harrowing is used. Rasmussen and Svenningsen (1995) studied the interaction between row distance and three spring barley varieties in an experiment with no pre-emergence weed harrowings and two post-emergence harrowings with 1-month time interval. With respect to weed control efficacy, they did not find any significant interactions between variety and harrowing treatment.
Under organic or low-input growing conditions with high weed pressure, Otira would be a good choice of variety due to its strong suppressive ability, in combi-nation with a positive response to weed harrowing and relatively high yield. In contrast, Brazil despite high yields, suffered from weed harrowing and had less weed suppressive ability. In conclusion, this study shows that the varieties differed in their response to weed harrowing in terms of yield, but not in terms of weed suppressive ability. Moreover, the yield response interacted with the nutrient level.
Acknowledgements
We thank Eugene Driessen, Karen Heinager, Henrik Grøndal and Lena Christensen for technical assistance and Kristian Kristensen for assistance with the statistical analyses. This study was granted by Danish Agricultural Research Centre for Organic Farming, DARCOF-II-VI-2, Research School for Organic Agriculture and Food Systems (SOAR) and Danish Institute of Agricul-tural Sciences.
References
Anon (2002)MATLABVer. 6.5. The Mathworks Inc., Natick, MA, USA.
Anon (2003)Vejledning og skemaer 2003⁄04, 1–102. The Danish Ministry of Food, Agriculture and Fisheries, Danish Plant Directorate, Lyngby, Denmark.
Anon (2005c) http://www.sortinfo.dk.
BaerveldtS &AscardJ (1999) Effect of soil cover on weeds.
Biological Agriculture and Horticulture17,101–111.
Barberi P (2002) Weed management in organic agriculture:
are we addressing the right issues? Weed Research 42,
177–193.
BondW &GrundyAC (2001) Non-chemical weed management
in organic farming systems.Weed Research41,383–405.
BouazizA,SoutyN &HicksD (1990) Emergence force exerted
by wheat seedlings.Soil and Tillage Research17,211–219.
GundersenH,RasmussenJ &NørremarkM (2006) Tolerance of
cereals to post-emergence weed harrowing. In:Third International Conference on Non-Chemical Crop Protection Methods, Lille, France, 70–78.
HansenPK,KristensenK &WillasJ (2006) Forskellige sorters
konkurrenceevne overfor ukrudt (Weed competitiveness of different varieties). In:Third Danish Plant Congress, Danish Institute of Agricultural Sciences and Danish Agricultural Advisory Service, Herning, Denmark, 342–343.
JensenRK,RasmussenJ &MelanderB (2004) Selectivity of
weed harrowing in lupin.Weed Research44,245–253.
KirklandKJ (1994) Frequency of post-emergence harrowing
effects wild oat control and spring wheat yield.Canadian Journal of Plant Science75,163–165.
KurstjensDAG &KropffMJ (2001) The impact of uprooting
and soil-covering on the effectiveness of weed harrowing.
Weed Research41,211–228.
KurstjensDAG &PerdokUD (2000) The selective soil covering
mechanism of weed harrows on sandy soil.Soil and Tillage Research55,193–206.
LancashirePD,BleiholderH,Van Den BoomTet al.(1991) A
uniform decimal code for the growth stages of crops and weeds.Annals of Applied Biology119,561–601.
LangARG,XiangY &NormanJM (1985) Crop structure and
the penetration of direct sunlight.Agricultural and Forest Meteorology35,83–101.
LemerleD,GillGS,MurphyCEet al.(2001) Genetic
improvement and agronomy for enhanced wheat
competitiveness with weeds.Australian Journal of Agricultural Research52,527–548.
OtsuN (1979) A threshold selection method from grey-level
histograms.IEEE Transactions on Systems, Man, and Cybernetics9,62–66.
PattersonHD &WilliamsER (1976) A new class of resolvable
incomplete block designs.Biometrika63,83–92.
RasmussenJ (1991) A model for prediction of yield response in
weed harrowing.Weed Research31,401–408.
RasmussenJ (1992) Testing harrows for mechanical control of
annual weeds in agricultural crops.Weed Research32,
267–274.
RasmussenK (2002) Influence of liquid manure application
method on weed control in spring cereals.Weed Research42,
287–298.
RasmussenJ &RasmussenK (1995) A strategy for mechanical
weed control in spring barley. In:Proceedings 1995 9th European Weed Research Society (EWRS) Symposium, Budapest, Hungary, 29–37.
RasmussenK &RasmussenJ (1999) Barley seed vigour and
mechanical weed control.Weed Research40,219–230.
RasmussenJ &SvenningsenT (1995) Selective weed harrowing
in cereals.Biological Agriculture and Horticulture12,29–46.
RasmussenJ,KurtzmannJI &JensenA (2004) Tolerance of
competitive spring barley cultivars to weed harrowing.Weed Research44,446–452.
SAS Institute Inc. (1999)SAS OnlineDoc Version 8. SAS Institute Inc., Cary, NC, USA.
SteinmannHH (2002) Impact of harrowing on the nitrogen
dynamics of plants and soil.Soil and Tillage Research65,
53–59.
WellesJM &NormanJM (1991) Instrument for indirect
measurement of canopy architecture.Agronomy Journal83,
818–825.
WoebbeckeDM,MeyerGE,BargenKV &MortensenDA