The use of a terrestrial laser scanner in an open cut mining environment
72
0
0
Full text
(2) University of Southern Queensland Faculty of Engineering and Surveying. The Use of a Terrestrial Laser Scanner in an Open Cut Mining Environment. A dissertation submitted by. Mr. Adrian Wall. In fulfilment of the requirements of. Courses ENG4111 and ENG4112 Research Project. Towards the degree of. Bachelor of Spatial Science (Surveying). October 2009.
(3) ABSTRACT Advances in Terrestrial Laser Scanning technology in the areas of topographic data capture, represent new and exciting opportunities for the mining industry, in particular open cut coal. Terrestrial laser scanning offers an alternative to traditional survey techniques. It consists of automated high speed data capture of complex surfaces in often inaccessible environments. The use of a TLS system has been examined in this dissertation with respect to its cost effectiveness, user friendliness and ability to comply with relevant government legislation regulating its use in the open cut coal surveys. The ability to be able to setup the TLS system in a safe location for both operator and machine and acquire all the data of a traditional survey and much more without putting the operator in the line of fire, suggests that TLS systems in dangerous working environments such as mining, will become common place in the near future. This dissertation has been developed from the start of 2008 when the evaluation for purchase of a TLS system was undertaken, and as such prices listed for equipment are indicative for that time. Since then, the prices of TLS systems have dropped dramatically, which is a direct reflection of the markets acceptance of TLS technology and surveyor confidence in the stated accuracies of the machines. Keywords: Terrestrial, scanning, automated, TLS, confidence.. i.
(4) University of Southern Queensland Faculty of Engineering and Surveying. ENG4111 & ENG4112 Research Project. Limitations of Use. The Council of the University of Southern Queensland, its Faculty of Engineering and Surveying, and the staff of the University of Southern Queensland, do not accept any responsibility for the truth, accuracy or completeness of material contained within or associated with this dissertation. Persons using all or any part of this material do so at their own risk, and not at the risk of the Council of the University of Southern Queensland, its Faculty of Engineering and Surveying or the staff of the University of Southern Queensland. This dissertation reports an educational exercise and has no purpose or validity beyond this exercise. The sole purpose of the course "Project and Dissertation" is to contribute to the overall education within the student’s chosen degree programme. This document, the associated hardware, software, drawings, and other material set out in the associated appendices should not be used for any other purpose: if they are so used, it is entirely at the risk of the user.. Professor Frank Bullen Dean Faculty of Engineering and Surveying. ii.
(5) CERTIFICATION. I certify that the ideas, designs and experimental work, results, analysis and conclusions set out in this dissertation are entirely my own efforts, except where otherwise indicated and acknowledged. I further certify that the work is original and has not been previously submitted for assessment in any other course or institution, except where specifically stated. Adrian Wall Student Number: W0023008. _____________________________ (Signature) ____________________________ (Date). iii.
(6) ACKNOWLEDGEMENTS This research was carried out under the principal supervision of Zhenyu Zhang. Thank you to Zhenyu Zhang for helping me in writing this dissertation. Appreciation is also due to Rio Tinto for the use of the terrestrial laser scanner and time needed to undertake this project. Finally special thanks go to my family for their support during this dissertation process.. iv.
(7) TABLE OF CONTENTS Contents. Page. ABSTRACT.. i. LIMITATIONS OF USE.. ii. CANDIDATES CERTIFICATION.. iii. ACKNOWLEDGEMENTS.. iv viii. LIST OF FIGURES. LIST OF TABLES.. x. LIST OF APPENDICES.. xi. GLOSSARY OF TERMS.. xii. CHAPTER 1 - INTRODUCTION. 1.1 Introduction ................................................................................................. 1. 1.2 Research Objectives .................................................................................... 1. 1.3 Study Area ................................................................................................... 2. 1.4 Dissertation Structure ................................................................................. 4. 1.5 Conclusions: Chapter 1 ............................................................................... 4. CHAPTER 2 - LITERATURE REVIEW. 2.1 Introduction ................................................................................................ 5. 2.2 What is a Laser Scanner?............................................................................ 5. 2.3 Principles of the Laser Scanner .................................................................. 6. 2.3.1 Time of Flight Scanners ...................................................................... 10. 2.3.2 Phase Based Scanners ......................................................................... 10. 2.3.3 Triangulation Scanners ........................................................................ 10. 2.4 Application of the Laser Scanner ............................................................... 10. 2.4.1 Application – General .......................................................................... 10. 2.4.2 Application – Mining .......................................................................... 10. v.
(8) 2.5 Legislation governing the use of Laser Scanners for Mining ..................... 11. 2.6 Summary: Chapter 2 ................................................................................... 13. CHAPTER 3 - RESEARCH DESIGN AND METHODOLOGY. 3.1 Introduction ................................................................................................. 14. 3.2 Equipment .................................................................................................... 15. 3.2.1 Product Comparison ............................................................................. 15. 3.3 Survey Examples ......................................................................................... 18. 3.3.1 Survey Types ........................................................................................ 18. 3.3.2 Survey Process ..................................................................................... 23. 3.3.3 Raw Data Processing ............................................................................ 24. 3.4 Problems ...................................................................................................... 26. 3.4.1 Office Issues ......................................................................................... 26. 3.4.2 Field Issues ........................................................................................... 28. 3.5 Conclusions: Chapter 3 ................................................................................ 28. CHAPTER 4 - DATA ANALYSIS. 4.1 Introduction ................................................................................................ 30. 4.2 Cost Analysis .............................................................................................. 30. 4.2.1 Increase in Cast to Final ....................................................................... 30. 4.2.2 End of Month Stockpile Surveys ......................................................... 33 4.2.3 Additional Surveyor ............................................................................. 33. 4.3 Benefit Analysis .......................................................................................... 33. 4.3.1 Survey Team Benefits .......................................................................... 33. 4.3.2 Mine Design Improvements ................................................................. 35. 4.3.3 Geotechnical and Geological Understanding ....................................... 35. 4.3.4 Other Potential Benefits ....................................................................... 36. 4.4 NPV Results and Sensitivity Analysis ........................................................ 36 4.5 Conclusions: Chapter 4 ................................................................................ vi. 37.
(9) CHAPTER 5 - CONCLUSIONS, DISCUSSIONS AND IMPLICATIONS. 5.1 Introduction ................................................................................................. 38. 5.2 Discussion .................................................................................................... 38. 5.3 Further Research and Recommendations ...................................................... 39. REFERENCES ..................................................................................................... vii. 58.
(10) LIST OF FIGURES. Number Title. Page. Figure 1.1. Aerial Photo – Site Location (Courtesy of Google Maps) .............. 2. Figure 1.2. Aerial Photo – Site Location (Courtesy of Google Maps) .............. 3. Figure 2.1. Principle of Pulse Laser Ranging .................................................... 7. Figure 2.2. I-Site LR4400 TOF Scanner ............................................................ 7. Figure 2.3. Schematic Drawing of two Modulated Wavelengths and Carrier Wave for Phase Based Laser Ranging ............................................. 8. Figure 2.4. Leica HDS6100 Phase Based Scanner ............................................. 8. Figure 2.5. 3D Laser Triangulation .................................................................... 9. Figure 3.1. Image showing the setup of the I-Site LR4400 Scanner ................. 14. Figure 3.2. Image showing the setup of the Riegl Scanner ............................... 15. Figure 3.3. Image showing the setup of the Laser Ace Scanner and Triangulation ............................................................................. 16. Figure 3.4. Geo-referenced Image of dragline/ dozer interaction ..................... 17. Figure 3.5. Point cloud data of Figure 3.4 ......................................................... 17. Figure 3.6. Point cloud data of end of month shovel dig .................................. 18. Figure 3.7. Point cloud data of coal floor extraction area for Digital record tracings ...................................................................... 18. Figure 3.8. Point cloud data of MTW north clean coal stockpiles ................... 19. Figure 3.9. Coal seam mapping from TLS data and geo-referenced photo ...... 19. Figure 3.10 Survey of lowwall stability monitoring .......................................... 20. Figure 3.11 Geo-referenced image of tailings dam survey ................................ 20. Figure 3.12 Point cloud data of post blast survey ............................................... 21. Figure 3.13 Flow chart of survey process ........................................................... 22. Figure 3.14 Image showing matching point pairs ............................................... 23. Figure 3.15 Survey showing dust noise ............................................................... 25. Figure 3.16 Survey showing effects of water ...................................................... 26. Figure 4.1. 30. Example of GPS data of highwall survey ....................................... viii.
(11) Figure 4.2. Example of I-Site data of highwall survey ...................................... 30. Figure 4.3. Histogram showing distance between I-site survey & GPS survey.. 31. Figure 4.4 Areas where distance between I-site survey & GPS Survey. Figure 4.5. vary by >0.5m .................................................................................... 31. Example of TLS data located from 2 survey stations ..................... 33. ix.
(12) LIST OF TABLES Number Title. Page. Table 2.1. Classification of Laser Scanners ..................................................... 6. Table 3.1. Comparison results of three tested TLS’s ....................................... 16. Table 4.1. Results of NPV (8%) and sensitivity analysis ................................ 35. x.
(13) LIST OF APPENDICES. Number. Title. Page. Appendix A. Project Specification ................................................................ 39. Appendix B. Product Specification Data Sheet .............................................. 41. Appendix C. Surveyor Workload ................................................................... 47. Appendix D. Surface Histogram Data ............................................................ 49. Appendix E. NPV Scenario 1 & Scenario 2 ................................................... 55. xi.
(14) GLOSSARY OF TERMS The following abbreviations have been used throughout the text and bibliography:As Built. A model which captures the exact physical shape of an object.. CAD. Computer Aided Design.. COGO. Coordinate Geometry.. Co-ordinate System. A set of numerical values used to denote a location in 3D space.. Cartesian co-ordinate system. Three orthogonal ‘world axis’ (the X, Y and Z Axes) are used to define the position of a point relative to the intersection of these axes, or origin.. DXF. Drawing Exchange Format.. EDM. Electronic Distance Measurement.. Geo-referencing. The assignment of coordinates of an absolute geographic reference system to a geographic feature.. GPS. Global Positioning System.. Highwall. The unexcavated face of exposed overburden and coal in a surface mine or in a face or bank on the uphill side of a contour mine excavation.. Laser Scanning. Is the use of a laser to collect dimensional data in the form of a “point cloud”.. Lowwall. An excavated face of exposed overburden and coal in a surface mine or in a face or bank on the downhill side of a contour mine excavation.. MSL. Mean Sea Level.. MTW. Mount Thorley Warkworth.. Point. A one-dimensional point in co-ordinate space.. Point cloud. A set of three-dimensional points describing the outlines or surface features of an object.. Registration. The processes of making one set of data align with another, such that both sets are in a common coordinate system. xii.
(15) RTK. Real Time Kinematic.. Surface Model. A CAD model of an object that is defined by its bounding surface.. TGO. Trimble Geomatics Office.. TOF. Time of Flight.. TLS. Terrestrial Laser Scanner.. TSCE. Trimble Survey Controller.. 2D. Two Dimensional. Descriptive of a region of space that has width and height. 3D. Three Dimensional. Descriptive of a region of space that has width, height and depth.. xiii.
(16) CHAPTER 1 INTRODUCTION 1.1 Introduction. Mining survey tasks fall into two main categories; the practical control of material movement and the collection of spatial data of physical surfaces. The current technology used by the surveyor to undertake both of these tasks consist of traditional theodilite surveys and RTK GPS surveys, involving a field party of one or two people. Surveying in a large open cut mining operation exposes survey staff to interactions with heavy mining equipment as well as placing them in confined work areas with unstable high and low walls. As a result of working under these conditions, data can be sparse and traditional methods of survey are both time and labour intensive.. 1.2 Research Objectives. This project will look at the use of a terrestrial laser scanner in an open cut coal mining environment for the application of collecting spatial data of physical surfaces only. Such surveys include: •. Post blast surveys.. •. Dragline extraction surveys.. •. Face shovels surveys.. •. Coal stockpile surveys.. •. Lowwall monitoring.. •. Accident Surveys.. •. Coal floor pickups for the purpose of generating mine working plans.. 1.
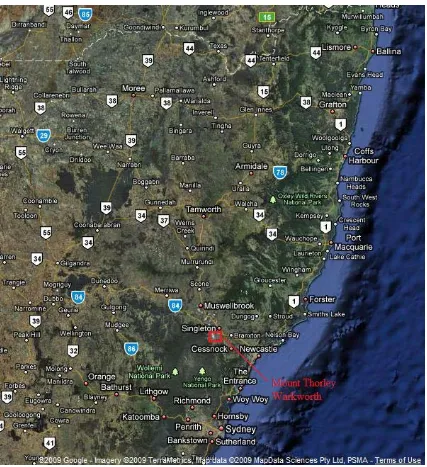
(17) The project will also examine whether a TLS complies with the NSW Coal Mine and Survey drafting directions for order of accuracy for mining surveys and provide a cost benefit analysis over traditional survey practices currently undertaken at the mine.. 1.3 Study Area. Mount Thorley Warkworth mine is situated 2.5 hours north of Sydney and 1 hour west of the port of Newcastle.. Figure 1.1 Aerial Photo – Site Location (Courtesy of Google Maps).. 2.
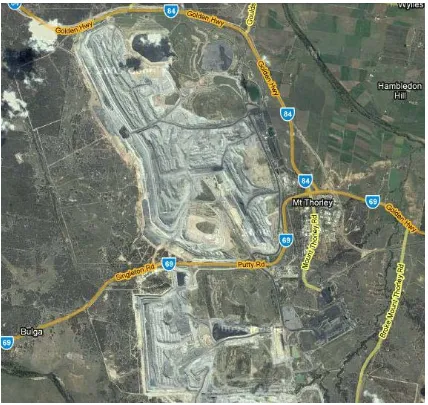
(18) The current mine operations cover an area of approximately 48 km² and employs in excess of 1000 people. The mine produces 9.2 million tonne of saleable coal per annum and has an overburden operation of 92 million tonne per annum making it the largest multi-seam coal mine in the hunter valley and one of the largest in Australia. The mining fleet consists of three electric draglines, three electric face shovels, four hydraulic excavators, fifty six haul trucks, as well as other auxiliary loading units and earthmoving equipment. Dragline and face shovels are due to complete 24 and 28 passes respectively, which as well as exposing coal, involve the construction of complex ramping and rehabilitation systems that require strict survey control to avoid costly mistakes.. Figure 1.2 Aerial Photo – Site Location (Courtesy of Google Maps).. 3.
(19) In comparison the MTW survey team is relatively small, with only three permanent surveyors, plus a rotational graduate who is present for only six months of the year. A strong case currently exists for an additional surveyor to achieve the appropriate level of service required to sustain the current needs of the operation let alone any future increases in productivity. This project highlights the benefits which a TLS can make in the open cut mining environment with respect to employment of another full time surveyor, as well as the cost benefits a TLS can provide to the company.. 1.4 Dissertation Structure. The aim of this project is to examine the use of a TLS in an open cut mining environment. This was achieved by performing the following: • Identifying mine surveys suitable for using a TLS. • Identify which areas of government legislation apply to the use of coal mining surveys and equipment. • Undertake and compare surveys utilising the TLS and current mining survey methods. • Compare time taken to undertake surveys using a TLS and current mining survey methods. • Analyses cost savings with regards to payback time for the acquisition of a TLS.. 1.5 Conclusions: Chapter 1. This research aims to identify the uses of a terrestrial laser scanner in an open cut mining environment and cost savings associated with its use. The results of this project will form the basis for the justification of the purchase of a TLS for Mount Thorley Warkworth mine and other Rio Tinto operations.. 4.
(20) CHAPTER 2 LITERATURE REVIEW 2.1 Introduction. In the introduction chapter of this dissertation, we were introduced to the research objectives along with the area of study and the structure in which the dissertation will be written. The purpose of this chapter is to give a definition of what is a laser scanner, along with the principles of how a TLS works and the application of TLS’s in general surveying and more specifically, mining surveying. This chapter will examine the government legislation governing the use of TLS’s for mining and look at some traditional survey techniques versus scanning.. 2.2 What is a Terrestrial Laser Scanner? As defined by BÖhler and Marbs (2002), a laser scanner uses laser light to measure distances from the sensor to the object in a systematic pattern. Laser scanning uses a reflectorless electronic distance measuring device (EDM) coupled with automatic rotation of a range finder to measure individual points in an arbitrary Cartesian coordinate system. The two main types of laser scanning include terrestrial and airborne. As the names suggest, airborne laser scanning is conducted from an aircraft usually for the purposes of mapping large scale areas of land. Terrestrial laser scanning is conducted from the land surface to measure objects of a smaller scale, to a higher accuracy. There are a range of commercially available terrestrial laser scanners on the market each with their own specifications and accuracies. As a general rule their acquisition speeds are incredibly rapid, 4000-500,000 points per second, not necessarily sacrificing accuracy for speed. However the higher scan rates are often clarified as a maximum instantaneous boost, of up to ten times the nominal speed. Likewise the capable range also varies greatly between models, from 80m – 700m but, unlike the speed, there seems to be a clear degradation in accuracies when range capabilities are increased. (Leica 2007, iSite 2007, Riegl 2007) 5.
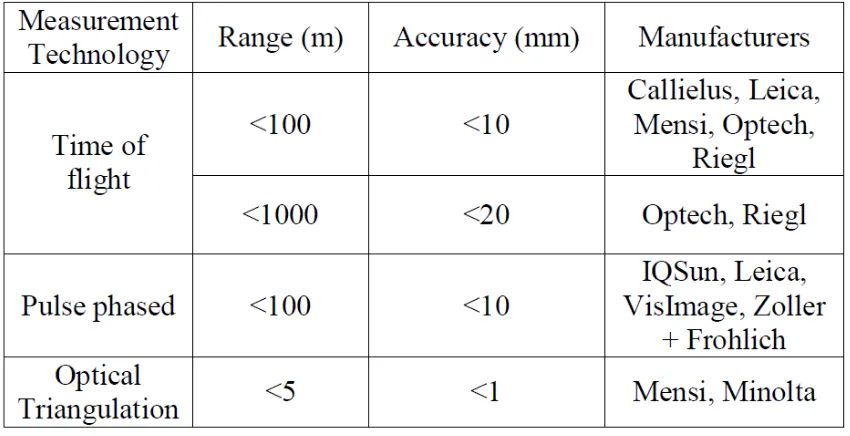
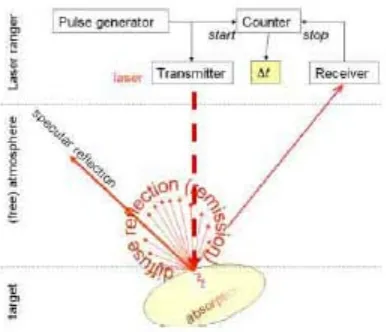
(21) 2.3 Principles of a Laser Scanner. Laser scanners fall into one of three categories with respect to their ability to measure distance between the sensor system and target. Fröhlich, (2004) summarises laser scanner classification, based measurement technology, range, accuracy and manufacture, as can be seen below in table 2.1.. Table 2.1 Classification of Laser Scanners. Source: Fröhlich, C.; Mettenleiter, M. (2004). 2.3.1 Time of Flight Scanners. For large ranges, the time of flight (TOF) method of measurement is used to calculate the distance from the sensor to the object. As with reflectorless EDM, it is a simple calculation based on the following formula.. Where D is the distance, t is time and c is the speed of light. Figure 2.1 displays the principles of a pulse laser range, using the TOF method of calculation.. 6.
(22) Figure 2.1 Principle of Pulse Laser Ranging. Source: Norbert Pfeifer, Christian Briese (2007). TOF accuracy depends on the ability to accurately measure time, and the accuracy of the system to detect “backscatter”, Norbert and Briese (2007). Jutzi and Stilla (2005) have devised echo detection algorithms for post processing which allows for the phenomenon of backscattering to be reduced from TOF calculations. The I-Site LR4400 laser scanner which was used in the evaluation for this project is an example of a TOF scanner, as shown in Figure 2.2.. Figure 2.2 I-Site LR4400 TOF Scanner. Source: http://www.maptek.com/. 7.
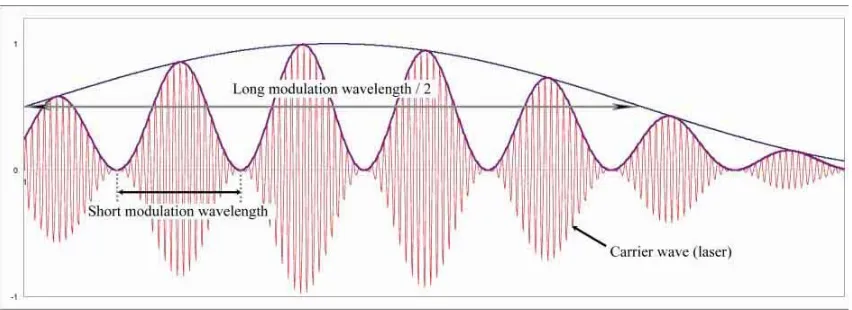
(23) 2.3.2 Phase Based Scanners. In order to obtain higher precision and higher measurement rates, Phase Based measurement technology has been applied to terrestrial laser scanners. This consists of using a continuous wave laser to carry an amplitude modulated signal. The phases of the emitted and received signals are compared and the number of full wavelengths between the sensor and reflecting object counted. Given the known wavelength, point distance can be derived using the following formula:. r = Ϫφ/(2λ) λ/2 + λ/2n, Where Ϫφ is given in radians, λ is the known wavelength and n is the number of whole wavelengths. Norbert and Briese (2007) provide an example of modulated wavelengths and carrier wave for pulse phase based laser ranging.. Figure 2.3 Schematic Drawing of two Modulated Wavelengths and Carrier Wave for Phase Based Laser Ranging. Source: Norbert Pfeifer, Christian Briese (2007).. Figure 2.4 Leica HDS6100 Phase Based Scanner. Source: http://www.leica-geosystems.us. 8.
(24) 2.3.3 Triangulation Scanners. Triangulation scanning determines range via angular measurement as opposed to distance measuring, and as a result has the highest precision of all the measurement technologies found in laser scanners. They were among the first scanners to be developed by the National Research Council of Canada in 1978 and use a laser plane as opposed to a laser beam to interrogate surface features. The principles involved in triangulation scanning are similar to the principles found in photogrametry, where matching point pairs form intersecting planes are triangulated to give a unique position of any one surface feature. A more in depth explanation of the triangulation method can be found with Beraldin (2000), but the below Figure 3.5 shows the basic principle of the triangulation measurement technology.. Figure 2.5 3D Laser Triangulation. Source: http://wwwinition.co.uk.. 9.
(25) 2.4 Application of the Laser Scanner. 2.4.1 Application – General. Applications for the use of TLS systems in the surveying arena are wide and varied. There application in day to day surveying is only limited by the users confidence and understanding of its principles and achievable accuracy of the TLS system and software. Spatial Resources (2009), lists just some of the areas in which TLS’s are making inroads in the world of spatial measurement. These include: •. Civil engineering, Transportation and Surveying.. •. Construction.. •. Forensics.. •. As-builts.. 2.4.2 Application – Mining. This dissertation is based on the application of the TLS in an open cut mining environment and there have been many case studies undertaken of its use and achievable accuracies therein. Maptek (2009) lists several case studies for the use of terrestrial laser scanner in: •. Open cut mining.. •. Underground mining.. •. Stockpile and geological mapping.. •. Stockpile and volumetric surveys.. The underlying theme in these case studies is that the use of a TLS system provides a fast and economical way of capturing vast quantities of spatial data. The TLS survey can be undertaken from a location outside any existing hazards due to its range and speed of capture, which increases the factor of safety for its users. Specific examples of the use of a TLS system in the mining environment can be found further on in this dissertation.. 10.
(26) 2.5 Legislation governing the use of Laser Scanners for Mining. The use of TLS systems in the mining environment fall under three pieces of government legislation for use in NSW when being used for the purposes for locating mine workings which will be shown on the mine workings plan. The first piece of legislation is the Survey and Drafting Directions for Mine Surveyors 2007, (NSW – Coal). This document sets out the accuracies that must be obtained to show mine workings on the mine workings plan. Clause 3.33 states: 3.3.3 Secondary surveys shall be employed by the Mining Surveyor where necessary to accurately locate all of the Mine workings on the Mine Workings Plan to within 1mm at 1:2000 Scale. Such surveys shall be completed to the highest appropriate standards of accuracy. The above accuracy equates to a spatial position of ±2m. Today’s TLS systems easily achieve the accuracies set out in S&DD 2007 and as such would make a prime candidate for their application in the open cut mining environment. The second piece of government regulation governing the use of TLS systems in open cut coal mining in NSW is the Coal Mine Health and Safety Regulation 2006. Division 1, Controlled Materials, Plant and Practices, Subdivision 1, Note 71 makes reference to Australian Standard 2397 – 1993. Standard 2397-1993 refers to the safe use of lasers in the building and construction industry and sets out the safety requirements for the use of lasers for alignment, levelling, control and survey tasks, (AS2397-1993). This standard also set out the procedures of use pertaining to each laser class. As the majority of TLS systems available today use Class 1 to Class 3A lasers, no special operational procedures need to be followed for there use. The third piece of government regulation governing the use of TLS systems in open cut coal mining in NSW is the Surveying Regulation 2006. This document does not regulate the use of a TLS in mining, but sets out the conditions to which a TLS’s electronic measurement device must adhere to in order to have legal traceability of measurement for a given survey. Division 3, clause 14 states: Equipment for measurement of surveys (1). A survey must be made using appropriate equipment. 11.
(27) (2). A surveyor must not use any equipment in making a survey unless the. surveyor knows the accuracy obtained by its use. That accuracy must be determined by reference to: (a). the Australian primary standard of measurement of length, within the. meaning of the National Measurement Act 1960 of the Commonwealth, or (b) the State primary standard of measurement of length, within the meaning of that Act, that is under the control of the Surveyor-General, (4) A surveyor must not use any electronic distance measuring equipment in making a survey unless it is verified against the State primary standard of measurement of length (as referred to above), by using pillared testlines, at least once every year and immediately after any service or repair. (6) The accuracy and method of any verification under this clause must be as approved. A TLS system differs in the way they measure point data, i.e. they cannot be pointed directly at a target. A TLS’s range is also less than that of a surveying total station which when combined makes them unsuitable for use on the state pillared base line as required for measurement validation by the Surveying Regulation 2006.. 2.6 Conclusions: Chapter 2. This chapter looked at the different types of TLS measurement technology available in the market place. From the literature review, it would show that a TOF TLS would be most suited for the mining environment as range is preferred over accuracy. The application of the TLS is becoming increasingly vast as surveyors expand their knowledge of the technology and apply these systems outside the bounds of traditional surveying techniques. An issue arises once we apply the regulations governing their use for certain mining applications, and as such will need to be limited in use to areas that don’t require legal traceability of measurement.. 12.
(28) CHAPTER 3 RESEARCH, DESIGN AND METHODOLOGY 3.1 Introduction. In the literature review chapter of this dissertation, the principles behind the TLS system where discussed, along with the application of TLS’s in the day to day surveying environment, then focusing more specifically on the application of the TLS in the mining environment and how the use of a TLS system interacts with current government and mining legislation regulating its use. The purpose of this chapter is to give an overview of three types of TLS systems that are under consideration for purchase, and examine the different mining surveys suitable for its use. As the mining environment for testing and subsequent use is a large scale open cut coal operation, preference was given to scanners with long range capabilities, along with functionality to include geo-referenced imagery. Accuracy could be in the order of 1 – 5cm as this would be deemed suitable for the majority of mining applications. This chapter also looks at the survey processors involved with data capture and the problems encountered both in the field and office. As with any new technology, the surveyor must have confidence that the data being collected complies with the stated instrument accuracy, and that the data allows for sufficient redundancy against gross errors.. 13.
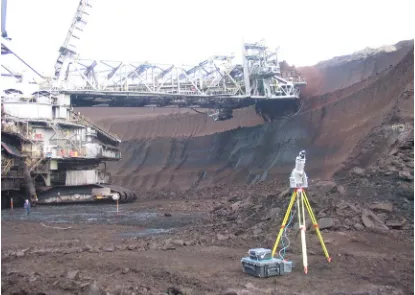
(29) 3.2 Equipment. 3.2.1 Product comparison. The three brands of instruments evaluated as part of the TLS validation are the I-Site 4400LR, the Riegl and Laser Ace. The I-Site LR4400 TLS is a TOF, pulsed rangefinder scanner, as shown in Figure 3.1. It is able to acquire data at a rate of 4400 points per second and has a range up to 700m depending on surface reflectivity. The stated single point accuracy in ideal operation is ±20mm and a repeatability of ±10mm. The manufacture however states that its range under normal field use is ±50mm for single point accuracy and an increase of accuracy of repeatability of 50mm / √the number of scans taken. The accuracy and range of this TLS is adequate for mining operations at MTW as an increase in accuracy does not lead to any appreciable increase in material volume and any extension in range would lead to a decrease in the angle of incidence of the laser, and as a result would reduce the accuracy of the data captured. The I-Site LR4400 has an in-built 37 megapixel digital camera for photo georeferencing and post processing software called “I-Site Studio”, which allows for quick and easy data registration and manipulation. The technical specification can be found in Appendix B.. Figure 3.1 Image showing the setup of the I-Site LR4400 scanner. 14.
(30) The Riegl TLS is a TOF scanner as show in Figure 3.2. It is able to capture data at a rate of 11000 points per second and has a stated range up to 1000m depending on surface reflectivity. The extended range of this scanner over the I-Site LR4400 is of no real benefit to the MTW operations, due to the reasons cited above in the I-Site LR4400. The Riegl has a stated accuracy of ±8mm with a repeatability of ±4mm and comes with an ad-on 12.3 megapixel digital camera for photo geo-referencing. The Riegl system also came with “I-Site Studio” post processing software for data registration and processing. The technical specification can be found in Appendix B.. Figure 3.2 Image showing the setup of the Riegl scanner. Source: http://www.riegl.com/. The Laser Ace TLS is a TOF scanner as shown in figure 3.3. It is able to capture data at a rate of 250 points per second and has a range up to 700m depending on surface reflectivity. The Laser Ace TLS does not have the facility to geo-reference images like the Riegl and I-Site.. 15.
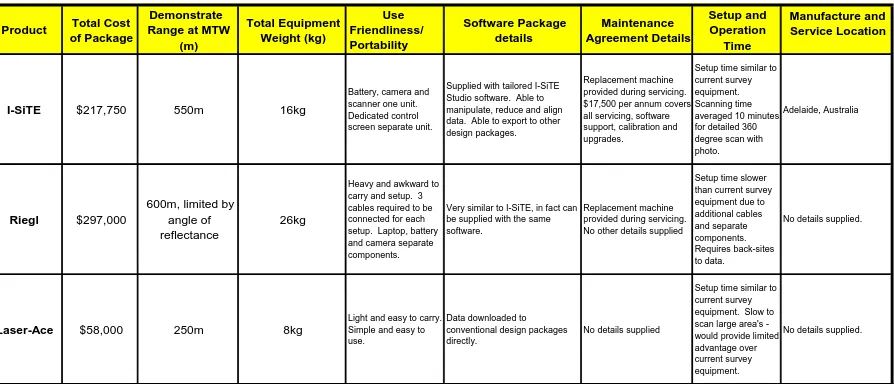
(31) The Laser Ace system comes with “Laser Cloud Viewer” and “Laser Cloud Modeller” software for registration and processing of captured data. The technical specification can be found in Appendix B.. Figure 3.3 Image showing the setup of the Laser Ace scanner and triangulation. Source: http://www.mdlaustralia.com.au Table 3.1, summarizes the main comparisons between the three TLS systems which were evaluated as part of this dissertation. All instruments located the same data source and range was based on measuring to a combination of black coal and grey sandstone surfaces.. Product. I-SiTE. Riegl. Laser-Ace. Total Cost of Package. $217,750. $297,000. $58,000. Demonstrate Range at MTW (m). 550m. 600m, limited by angle of reflectance. 250m. Use Total Equipment Friendliness/ Weight (kg) Portability. Software Package details. Supplied with tailored I-SiTE Studio software. Able to manipulate, reduce and align data. Able to export to other design packages.. Maintenance Agreement Details. Replacement machine provided during servicing. $17,500 per annum covers all servicing, software support, calibration and upgrades.. Setup and Operation Time. Manufacture and Service Location. Setup time similar to current survey equipment. Scanning time Adelaide, Australia averaged 10 minutes for detailed 360 degree scan with photo.. 16kg. Battery, camera and scanner one unit. Dedicated control screen separate unit.. 26kg. Heavy and awkward to carry and setup. 3 cables required to be Very similar to I-SiTE, in fact can Replacement machine connected for each be supplied with the same provided during servicing. setup. Laptop, battery software. No other details supplied and camera separate components.. Setup time slower than current survey equipment due to additional cables No details supplied. and separate components. Requires back-sites to data.. Light and easy to carry. Data downloaded to Simple and easy to conventional design packages use. directly.. Setup time similar to current survey equipment. Slow to scan large area's No details supplied. would provide limited advantage over current survey equipment.. 8kg. Table 3.1 Comparison results of the three tested TLS’s.. 16. No details supplied.
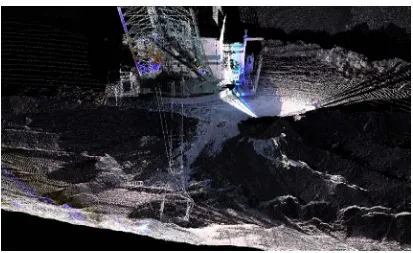
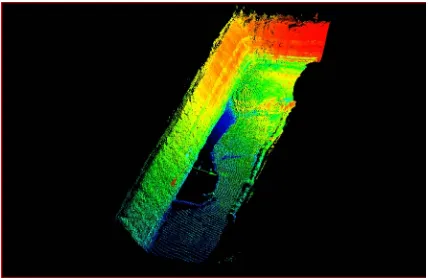
(32) 3.3 Survey Examples. 3.3.1 Survey Types. The typical types of surveys undertaken with the TLS include the following:. • Accident surveys.. Figure 3.4 Geo-referenced image of a dragline/ dozer interaction.. Figure 3.5 Point cloud data of Figure 3.4. 17.
(33) • End of month volume surveys.. Figure 3.6 Point cloud data of an End of Month shovel dig.. • As mined coal floor pickups.. Figure 3.7 Survey of Coal floor extraction areas for Digital Record Tracings. 18.
(34) • Coal stockpile surveys.. Figure 3.8 Point cloud data of MTW north clean coal Stockpiles.. • Coal seam mapping.. Figure 3.9 Survey of Coal Seam Mapping from TLS data and geo-referenced photo. 19.
(35) • Stability monitoring.. Figure 3.10 Survey of lowwall stability monitoring.. • Tailings dam surveys.. Figure 3.11 Geo-referenced image of tailings dam survey.. 20.
(36) • Truck factor studies. • DTM updates. • Pre and post blast surveys.. Figure 3.12 Point cloud data of post blast survey. Figure 3.4 to 3.12 illustrates the type of data collected by the I-Site terrestrial laser scanner of the above surveys. The ability to be able to quickly and efficiently capture mass amount of spatial data over a large area with the I-Site system allows for greater accuracy in volume calculation and complex modelling of wall structure which can be hard if not impossible to obtain with traditional survey techniques.. 21.
(37) 3.3.2 Survey Process. The below Figure 3.13 is a flow chart of the processor involved for undertaking a scan with the I-Site TLS.. Figure 3.13 Flow chart of the survey process. 22.
(38) 3.3.3 Raw Data Processing. In order for the user to be able to get useful information from the vast amount of point cloud data obtained by the TLS system, a successful registration must be performed on the data to firstly align the scans with each other, then secondly to orientate and translate the scans to a coordinate system for correct spatial orientation. There are several ways in which this can be achieved through I-Site Studio. These include:. • Matching Point Pairs. This option is used to position any type of data using the best fit between groups of local and reference points and where there are common features visible. Figure 3.14 shows how Matching Point Pairs is achieved.. Figure 3.14 Image showing matching point pairs. Source: Maptek I-Site Studio reference manual. 23.
(39) The final RMS of 0.133m after registration is an indication of how well all of the scan data matched, not an indication of the spatial precision of the data. The Final RMS could be reduced by selecting more point pairs for surface matching.. • Matching Surface Features. Matching Surface features is used once scans have been registered close together using scanner position or matching point pairs. There must be sufficient data overlap for this function to operate. Whereas matching point pairs referenced scans through pairs of corresponding points, matching surface features allows for scans with an overlap area of data to be referenced together. The software essentially finds mass amounts of common points in the overlap areas to perform the registration.. • Matching to Survey Datum. This function is used where there is a coordinated station and backsight. As with traditional survey data reduction, the scan data is registered simply by translation and rotation commonly found in all survey software. It should be noted that the above two registration techniques allow for only one position scanning position to be known, and all subsequent scans, providing there is sufficient data overlap, can be translated and rotated to for one unique data set. The comparison of matching point pairs and matching surface features to traditional survey techniques is outside the scope of this dissertation, but would provide an area of further study.. 24.
(40) 3.4 Problems. 3.4.1 Field Issues. Using any new or unfamiliar technology can pose problems to the user if not thoroughly trained in its operational principles. The I-Site LR4400 although easy to use, displayed unreliable characteristics when used under certain situations. These included:. • Dust. Measuring in light to medium dust, which is a common environment in mining applications, causes the laser to measure the dust particles as well as measuring the desired object. The dust particles show’s up as “noise” on the scan when processed, but can easily be removed in the editing stage. Heavy dust should be avoided as this will provide no return of the laser signal. See figure 3.15. Dust “noise” can be minimised through scanning up-wind of the subject site, or through planning of the data acquisition for a suitable time.. Figure 3.14 Survey showing dust noise.. • Rain. Measuring in rain has similar results to measuring in dust. Light to medium rain causes “noise” to appear on the scan when processed. As is the case with dust, rain “noise” is easily removed by the I-Site Studio software and heavy rain should be avoided.. • Water. Measuring through a water body other then rain, has mixed effects on the data capture. Measuring through clear water causes the laser to distort when travelling through the water medium, thus returning points lower then what they 25.
(41) would be if no water is present. Turbid water causes the laser to reflect off the surface, thus creating a flat area and misrepresenting what is actually under the surface. Although no in depth analysis was undertaken in this area, these findings were observed from several different scans and water body types. See Figure 3.16.. Figure 3.16 Survey showing effects of water. Other field issues that arose from using the scanner, but not associated with operational principles included:. • Weight. The I-Site scanner weighs 16 kilograms with the battery, so careful setup selection is needed to avoid carrying the heavy weight to far over uneven ground.. • Batteries. The onboard battery is capable of only 12 hi resolution scans. • Camera. Light intensity settings need to be manually inputted before scan is started, if you wish to digitise data off the geo-referenced image. The light intensity can be changed after the preview scan has been taken and before the scan starts, if the wrong light intensity has been selected.. • Setup. Careful selection of the setup site must be made, as losing a $227,000 scanner over a highwall or lowwall is costly.. 26.
(42) • Availability. Due to the high workload of the survey team at MTW and the readily availability of survey data through the use of the TLS, time management of the use I-Site TLS was necessary.. 3.4.2 Office Issues. As with the issues encountered with the use of the TLS in field operation, similarly, office issues were encountered which were mainly due to the inability of other mine packages to handle the vast amount of survey data captured during the scanning session. These issues included:. • Data Filtering. Due to the large amount of survey points collected in the survey, data needed to be filtered so as it could be used in other mining packages. It was found that data had to be filtered down by a scale of 1.5 times to be able to be efficiently used in Minescape, and filtered down by a factor of 0.5 to be able to be used in Minex, without sacrificing software performance in the two packages.. • Data Structure. Since an increase in workflow can be achieved through the use of a TLS system, thought must be given to the efficient storage structure of raw and processed data. The collected data needs to be able to be archived and located to be used by the surveyor and other third parties. A disorganised data structure would lead to data being lost or not used, and this would result in wasted survey hours.. 3.5 Conclusions: Chapter 3. A comprehensive market assessment of laser scanning products was undertaken in preparation for this dissertation. As a result, three products were chosen for demonstration on site. The results are summarised in Table 3.1. The Laser Ace scanner, although by far the cheapest, did not have the required range or ability to collect and process large amounts of data of the other two scanners. It did not represent a significant time saving or advantage over current survey equipment at MTW. Its application is more suited to small quarries or civil applications.. 27.
(43) The Riegl scanner had the largest range of the three scanners and had similar capture and processing ability of the I-Site laser. Scanning range though is limited by the angle of reflectivity and therefore the additional range would not translate to a tangible saving in time. The unit was heavier and cumbersome in comparison to the I-Site scanner. The accuracy achieved by both the Laser Ace and Riegl scanners out performed that of the I-Site scanner, but for the majority of mining applications, the accuracy of the I-Site laser was more than sufficient. For these reasons and others outlined in Table 3.1, the ISite LR4400 laser scanner was deemed to be the most suited to MTW of the three products reviewed. The issues experience both in the field and in the office would be similar to all of the TLS systems trialled at MTW, due to similar operation of all three systems, and the large amount of spatial data being collected. Further study however should be undertaken using different laser types to see their effect on water and dust.. 28.
(44) CHAPTER 4 DATA ANALYSIS 4.1 Introduction. In the research, design and methodology chapter of this dissertation, examples of work undertaken by a TLS were examined, as well as the issues arisen from data collection and manipulation. An evaluation was undertaken of three TLS systems deemed suitable for use in a large open cut environment with the I-Site LR4400 being the preferred TLS system The purpose of this chapter is to examine the cost and physical benefits achieved through the use of an I-Site system, and provide analysis of the pay back time for the purchase of a TLS over employing another full-time surveyor.. 4.2 Cost Analysis. 4.2.1 Increase in Cast to Final. Information collected through the TLS will increase overburden material cast to a final position during blasting operations. In order to comply with environmental license conditions a generally conservative approach is adopted when designing face holes in blasts. Currently face hole are positioned in relation to the designed location of the presplit. Highwall faces are represented by crest and toe surveys and only major anomalies in the face are surveyed using traditional reflectorless theodilites. The improvement in fragmentation and percentage throw would be realised if face holes were designed based on detailed face profiles. This involves positioning individual holes based on the required burden at that location. On board drill GPS allows holes to be drilled accurately as designed. Detailed profiling using the TLS allows optimised face hole locations. This translates into a 2% improvement in throw quantities, based on removing burdens of 0.5m above design on 30% of face holes. A corresponding reduction of 87,000 bcm of dragline volume enables a cost saving of $48,000 per annum 29.
(45) Figure 4.1 Example of GPS data of highwall survey.. Figure 4.2 Example of I-Site data of highwall survey. 30.
(46) Figure 4.3 Histogram showing distance between I-site survey & GPS survey.. Figure 4.4 Areas where distance between I-site survey & GPS survey vary by >0.5m. Figure 4.3 is a histogram depicting the areas between the GPS survey and I-Site survey where the difference in face burden is greater than 0.5m. Refer to Appendix D. The face burden in these areas would be reduced to provide maximum throw blast.. 31.
(47) 4.2.2 End of Month Stockpile Surveys. At the end of each month and where directed, coal stockpile surveys are currently performed by a field party of two contract surveyors. With the increase efficiencies through the use of a TLS and the ability to quickly survey large stockpiles, this process can be performed by the site surveyors resulting in a direct saving of $48,000 per annum. Refer to figure 3.8. 4.2.3 Additional Surveyor. As outlined in sectioned 4.3.1, a strong case exists for the addition of one more surveyor to the survey team, along with additional survey equipment, the purchase of TLS technology will allow the appropriate level of survey service to be reached with the current survey team numbers. On personnel alone disregarding new equipment purchase, this will avoid an additional cost of $119,000 per annum.. 4.3 Benefit Analysis. 4.3.1 Survey Team Benefits. MTW is a relatively large scale, complex and high output mine. Its three draglines and three rope shovels are due to complete 24 and 28 passes respectively in 2009. Dragline passes are relatively complex with lowwall ramps, centre ramps, Jensen and Curtis, extended keys large changes in elevation, 35m wide coal trenches, 50m high lowwalls and spoil dumps common place. Its three shovels also report to a large number of dumps that tie into a complex rehabilitation system. The processes require strict survey support include drilling, blast profiling, rehabilitation, coal and parting and statutory requirements. In comparison the MTW survey team is relatively small, with only three permanent surveyors, plus a rotational graduate surveyor for only six months of the year. As supported in appendix 3, a strong case currently exists for an additional surveyor to achieve the appropriate level of service required. The total additional work hours calculated to achieve the required output is 1,612hours per annum. A full time surveyor is able to complete 1,800 hrs per annum.. 32.
(48) TLS technology has enabled the appropriate level of service to be achieved with the current size of the survey team. As shown in Appendix C, the total additional time to achieve the same required output with TLS technology is only 397 hours. This additional time can be achieved through the application of TLS technology to existing services supplied by the surveying team. This is due to the large area of data that can be collected and processed quickly using TLS technology. Figure 4.5 is an example of information that was collected from two survey points at MTW. This data was collected and processed in 2 hours. In comparison with traditional survey techniques at MTW, it would take around 8 hours, multiple setup locations and traversing on foot to collect and process only a fraction of the amount of information gathered by the TLS.. Figure 4.5 Example of TLS data located from 2 survey stations.. 33.
(49) 4.3.2 Mine Design Improvements. TLS technology has enabled more accurate, more detailed and timely acquisition of “as dug” surfaces, allowing surveyors to maintain an up to date topographic model. This has a significant flow-on benefit to design engineers, who currently construct their own ‘as dug’ surfaces prior to beginning a design. More time is available for option analysis to reach an optimised final design. As entire mine surfaces are now routinely surveyed, as opposed to crests and toes only, designs will become more accurate. A greater understanding of spoil characteristics will enable more accurate dragline designs, potentially increasing coal recovery and decreasing re-handled material.. 4.3.3 Geotechnical and Geological Understanding. TLS technology enables geological and geotechnical data to be routinely collected simultaneously with regular survey data. This consists of 3-Dimensional data with a photographic image geo-referenced. This can be processed in a significantly reduced timeframe compared to using the current sirovision technology. The flow-on benefits would be; •. A comprehensive geotechnical survey of each Highwall.. •. A more accurate geological model as more seam horizons will be mapped and data processed faster.. •. The geological team will have more time for other tasks, as they no longer need to collect the information TLS technology can collect as part of routine surveys.. Refer to Figure 3.9. 34.
(50) 4.3.4 Other Potential Benefits. Other additional benefits for the utilisation of a TLS system include; •. A reduction in oversize material in the free face area of face shovels blasts by placing the front row of holes closer to the free face.. •. Reduced risk of face burst and consequential environmental harm or equipment damage via an improved understanding of face profiles.. •. Reduced chances of surveyor re-work by not retrieving the right field data.. •. An improved understanding of cast blast performance and profile characteristics for input into mine designs.. •. Payload analysis can be performed in both rear dump trucks and buckets.. •. Reduced reliance on contract surveyors for coverage during annual leave periods.. 4.4 NPV Results and Sensitivity Analysis As outlined in section 4.2, there are three tangible financial benefits realised through the purchase of TLS technology: 1. Increased cast to final volume, annual saving of $60,900. 2. EOM coal stockpile surveys performed in-house, annual saving $48,000. 3. Negate the need for an additional surveyor, annual saving of $119,000. Two scenarios were analysed, firstly with all three benefits realised and then secondly if only benefits 1) and 2) were realised. See Appendix E for a full analysis. The outcomes are outlined in the table below. Scenario Benefits Realised 1 Cast to final increase. In-house EOM coal stockpile surveys. No additional surveyor. 2 Cast to final increase. In-house EOM coal stockpile surveys.. Total Annual Savings $227,900. NPV (8%) $466,564. Payback Period 1 year. $108,900. $121,179. 2.1 year. Table 4.1 Results of NPV (8%) and sensitivity analysis. 35.
(51) 4.5 Conclusions: Chapter 4. The purpose of this chapter is to examine the cost and physical benefits achieved through the use of a TLS, and provide analysis of the pay back time for the purchase of a TLS over employing another full-time surveyor. The purchase of a TLS in particular the I-Site laser scanner and software will provide annual savings of $227,900, with an NPV (8%) of $466,000 and payback period of 1 year. The savings occur in increased cast to final, in-house end of month stockpile surveys and the saving of an additional surveyor. This is primarily achieved through the ability of TLS technology to collect and process vast amounts of data, including photographic images, in a fraction of the time of conventional survey methods. The photographic ability of the TLS technology makes it a very cost effective geology/ Geotechnical instrument as well, enabling wall scans with joint and boundary mapping information. If the saving of an additional surveyor is not included in the financial calculations, the annual cost savings are reduced to $108,900, with an NPV (8%) of $121,800 and payback period of 2.1 years. 36.
(52) CHAPTER 5 CONCLUSIONS, DISCUSSION AND IMPLICATIONS 5.1 Introduction. The aim of this project arose from the need to develop new ways of incorporating survey technology into the open cut mining environment which not only increased surveyor safety, but enabled the current survey team at MTW to meet the current mining operation demands with less reliance on increasing survey staff numbers. This dissertation was therefore designed to evaluate the use of a terrestrial laser scanner in an open cut mining environment, and to assess its value within the MTW survey team, along with determining whether or not use of a TLS would meet current government legislation governing its use in an open cut coal environment.. 5.2 Discussion. Mining survey tasks fall into two main categories; the practical control of material movement and the collection of spatial data of physical surfaces. The collection of spatial information has been the basis of surveying for near its inception. Being able to quickly and accurately determine the position of an object relative to another, or being able to reference the object to a common coordinate system is what we as mining surveyors try to achieve on a daily basis. Through the advancement in measurement technology, TLS systems are taking common place in the surveyors arsenal of measuring equipment, and as such, need to be evaluated for not only there cost saving benefits, but also how they can reduce surveyor workload. This dissertation identifies both of the above benefits which leads the writer to conclude that the acquisition of a TLS system for the surveyors at MTW is a viable and valuable purchase. All of the survey types identified in Chapter 3 can be competently undertaking with the use of a TLS system with the exception of surveys used for the preparation of statutory mine working plans. It should be noted that a TLS system meets the accuracies set down by the relevant 37.
(53) government legislation with respect to surveys undertaken to prepare statutory mine working plans, but lacks official traceability in measurement as there is no calibration test site to verify a TLS system against the “state primary standard of measurement of length”.. 5.3 Further Research and Recommendations. This dissertation examined the practical application of a TLS system for the open cut mining operations at MTW, and the costs benefits applicable to its use. The dissertation however did not directly compare tried and tested traditional survey results against the results obtained through the use of a TLS system. Large amounts of data exists which confirms manufactures claims of the TLS system, but as yet, there is no formal government documentation for a calibration technique that allows a surveyor using a TLS system to meet the guidelines set down by the Surveying Regulation 2006 in NSW which state that “A surveyor must not use any equipment in making a survey unless the surveyor knows the accuracy obtained by its use. That accuracy must be determined by reference to: (a) the Australian primary standard of measurement of length, within the meaning of the National Measurement Act 1960 of the Commonwealth, or (b) the State primary standard of measurement of length, within the meaning of that Act, that is under the control of the Surveyor-General”. Further research in this area would be beneficial to all surveyors working in NSW so as surveyors can continue to keep pace with technology and ultimately reduce the surveyor’s physical workload in certain environments.. 38.
(54) Appendix A PROJECT SPECIFICATION. 39.
(55) University of Southern Queensland FACULTY OF ENGINEERING AND SURVEYING ENG 4111/4112 Research Project PROJECT SPECIFICATION FOR:. ADRIAN WALL. TOPIC:. THE USE OF A TERRESTRIAL LASER SCANNER IN THE MINING ENVIRONMENT. SUPERVISOR:. Zhenyu Zhang. PROJECT AIM:. This project will look at the use of a terrestrial laser scanner in an open cut coal mining environment and examine whether it complies with the NSW Coal Mine and Survey Drafting Directions for order of accuracy of mining surveys.. PROGRAMME:. Issue A, 24th March 2009. 1.. Give an overview of the use of the terrestrial laser scanner in the open cut coal mine operation.. 2.. Identify which section of legislation deals with survey accuracy and instrument verification for mining surveys.. 3.. Analyse results obtained and determine if results comply with survey accuracies.. 4.. Develop a calibration procedure for compliance with relevant survey legislation if time permits.. 5.. Submit an academic dissertation on the research.. AGREED: _______________ (student) _____/_____/_____. _______________ (supervisor) _____/_____/_____. Examiner: ___________________________________________________. 40.
(56) Appendix B PRODUCT SPECIFICATION DATASHEET. 41.
(57) 42.
(58) 43.
(59) 44.
(60) 45.
(61) 46.
(62) Appendix C SURVEYOR WORKLOAD. 47.
(63) Design Implementation Action / Control Matrix - Actual Vs Design (Production and Planning) Currently Not Performed due to lack of resources Only partially completed or performed infrequently Should be performed by Surveying Team. Accountable Person. Tasks Operator Frequency. Action / Control. Supervisor Frequency. Action / Control. Surveyor Frequency. Action / Control. Additional Surveying time to fulfil requirement per annum Without I-SiTE. With I-SiTE. Engineer Frequency. Action / Control. Superintendent Production Frequency. Action / Control. Superintendent Planning Frequency. Action / Control. Manager Production. Manager Planning. Frequency. Action / Control. Frequency. Action / Control. major exceptions. consulted during analysis / actions. major exceptions. provide direction for analysis / actions. Dragline Dragline Key Dig Check block progression. dig block. Check Key width on coal. dig block. Check Key crest vs. design / pegs. dig block. Check batter angle. dig block. block markers. 2 days. measure with disto, record onto checklist dig to pegs / clay targets measure with smart tool, record onto checklist. 2 days. block markers. Shiftly. 2 days. 2 days. inspect area. 3 x per week. View checklist, quiz operators inspect area View checklist, quiz operators. weekly survey or on request. inspect area. As D/L advances. view progress vs. block markers, use information in weekly weekly plan update weekly. GPS, summary email to supv, supt and engineer. 156. 19.5. On exception. Assess impacts on design weekly weekly. inspect area View checklist, discuss with supv and engineer inspect area View checklist, discuss with supv and engineer. weekly. On exception. review in weekly planning meetings - compare progression to month plan discuss as needed and review corrective actions. Dragline Low Wall Check block progression. dig block. Check LW crest vs. design / pegs. dig block. clay targets / ripper mark line up with survey pegs. Shiftly. inspect area. Weekly. Check batter angle. dig block. measure with smart tool, record onto checklist. Shiftly. View checklist, quiz operators. Weekly. Check coal edge to LW Toe - width on TOC. dig block. measure with disto, record onto checklist. Shiftly. View checklist, quiz operators. Weekly. Check LW pad RL. dig block. check pegs and design, record actual level onto checklist. Shiftly. view pegs and checklist. Daily (when advancing). Check crest. dig block. pegs. Shiftly. inspect area. 2 days. Check toe. dig block. pegs. Shiftly. inspect area. 2 days. Check ramp width. dig block. measure with disto, record onto checklist. Shiftly. View checklist, quiz operators. Check Levels on ramp vs. design / pegs. dig block. pegs. Shiftly. inspect area. Ensure block markers in inplace and visible to dragline operators GPS, verbal advice to operator, e-mail report to superintendent and engineer. Tie in with bucket service GPS, verbal advice to operator, e-mail report to superintendent and engineer. Tie in with bucket service GPS, verbal advice to operator, e-mail report to superintendent and engineer. Tie in with bucket service. 156. 78. 104. 26. 104. 26. 104. 26. 3 x per week. On exception. block markers. weekly. review in weekly planning meetings - compare progression to month plan. weekly. inspect area. review in weekly planning meetings - compare progression to month plan. Assess impacts on design On exception. discuss as needed and review corrective actions. major exceptions. consulted during analysis / actions. major exceptions. provide direction for analysis / actions. On exception. discuss as needed and review corrective actions. major exceptions. consulted during analysis / actions. major exceptions. provide direction for analysis / actions. discuss upcoming designs with surveyors - identify requirements. 2 monthly. Discuss with surveyor / engineer. on going. construct topo model using survey data to use in designs. on exception. on exception. discuss with planning supt, make allowances for error. on exception. Each design. Provide string files to surveyor to allow block markers to be placed. weekly. GPS. Provide pegs as required. weekly. 3 x per week. View checklist, discuss with supv and engineer. Read pegs, compare to design, discuss variances with production. Dragline Ramp Dig. Survey for input into Designs Top of coal within a coal/ptg sequence (eg WWE seam roof) Highwall toe of basal coal seam "post coal extraction" Final pit floor surface pickup Lowwall toe pickup "post coal extraction" Current survey file updated with pickups used in designs (this differs from the current DT as it will still show structure that is beneath. 2 days. as exposed. GPS, verbal notification to operator, supervisor and engineer. GPS, verbal notification to operator, supervisor and engineer.. On exception. Assess impacts on design. GPS. Pegs placed as required. shot with theodolite 10m offset, GPS pickup GPS shot with theodolite. monthly. weekly. inspect area. weekly. inspect area. weekly. View checklist, discuss with supv and engineer. weekly. inspect area. shot with theodolite. Survey data used to maintain topography model. on going. Survey data not available in time for design. on exception. Continuously update topo model with latest survey pick-ups discuss with planning engineer, make allowances for error. 104. 78. Discuss with engineer, provide direction on assumptions if necessary Discuss with engineer, provide direction on assumptions if necessary. Highwall Markers. Chain Highwall as Keys are being dug. <300m highwall exposed without chaining. assess progress of dragline when on keys and plan for dozer to be assigned to keep highwall chaining up to dragline. Activates to provide access to highwall crests when chaining and Keys completed. Access to Assign work to dozers to within 300m of ensure access to high wall current DL crest it established as soon face after chaining as possible. Block markers placed on highwall. 2 days. Alternative markers / pegs placed when highwall unaccessable (eg on LW Pad). as required. weekly. Block markers inform surveyor of when to in place expect access to highwall in beyond 300m order for surveyor to plan from DL on for this job to be done keys when blockmarkers not Maximum placed, discuss with period for D/L surveyor and agree on without blk alternative solution to be markers / used pegs=7days. Geology and Geotech Geologists. Surveyor. Engineer. Reconciliation Liaise with Surveyors to advise of availability of coal seams Liaise with Surveyors to advise of availability of coal seams Liaise with Surveyors to advise of availability of parting seams. Top of Coal Pick-up (Top Seam). As Required. Process Data and update model. as required. Scan top of coal with laser. As Required. Floor of Pit Pick-up (Bottom Seam). As Required. Process Data and update model. as required. Scan bottom of coal with laser. As Required. Boundaries of Significant Partings. As Required. Process Data and update model. as required. Scan (with Photo) all walls as they become available. As Required. Pick ups of Seam floor and roof boundaries as per geological requirements. As Required. Process Data and update model. as required. Scan (with Photo) all walls as they become available. as required. Liaise with Surveyors to advise of availability of parting seams. Pick ups of Geological Structures. As Required. Process data and update geotechnical model. as required. Scan (with Photo) all walls as they become available. As Required. Liaise with Surveyors to advise of availability of parting seams. 182. 45.5. 182. 45.5. 208. 52. 156. 0*. Done as part of previous scans with ISiTE. 156. 0*. Done as part of previous scans with ISiTE. Without I-SiTE. With I-SiTE. Geological Model. Total Additional Work Time Surveyors. 1612. 397. 48. inspect area, assign actions to supervisor when markers not in place. on exception. become involved in working through issues with prod supt if they are ongoing for a long period.
(64) Appendix D SURFACE HISTOGRAM DATA. 49.
(65) Easting 318415.700 318413.200 318410.800 318406.700 318388.200 318303.100 318405.800 318401.300 318400.500 318398.300 318394.800 318394.400 318392.400 318388.600 318387.600 318382.800 318380.400 318379.300 318379.000 318377.600 318376.600 318310.300 318305.300 318281.300 318279.200 318383.500 318389.300 318390.700 318391.400 318394.600 318396.300 318397.000 318400.100 318404.500 318413.900 318385.300 318383.500 318305.100 318308.300 318290.400 318292.200 318291.000 318292.500 318313.600 318314.400 318299.500 318294.100. Northing Rl 6390119.000 -58.535 6390135.000 -58.172 6390152.000 -57.844 6390169.000 -57.561 6390257.000 -54.977 6390402.000 -55.533 6390095.000 -20.172 6390113.000 -19.544 6390117.000 -19.352 6390127.000 -18.892 6390144.000 -18.127 6390146.000 -18.041 6390157.000 -17.613 6390175.000 -16.887 6390183.000 -16.503 6390203.000 -15.678 6390216.000 -14.988 6390221.000 -14.722 6390222.000 -14.664 6390230.000 -14.326 6390234.000 -14.124 6390362.000 -12.472 6390367.000 -12.630 6390407.000 -12.635 6390410.000 -12.647 6390269.000 -43.270 6390241.000 -44.413 6390228.000 -44.690 6390221.000 -45.167 6390209.000 -45.688 6390200.000 -45.923 6390193.000 -45.680 6390182.000 -46.174 6390157.000 -46.784 6390108.000 -47.169 6390182.000 -16.657 6390191.000 -16.313 6390366.000 -12.665 6390362.000 -12.611 6390388.000 -12.706 6390386.000 -12.704 6390387.000 -12.697 6390427.000 -56.644 6390396.000 -55.388 6390395.000 -55.369 6390416.000 -56.179 6390424.000 -56.632. Distance between I-Site survey & GPS survey 0.497 1.706 3.352 2.338 1.122 1.156 0.936 2.245 2.262 3.027 2.952 3.037 2.732 3.028 2.732 3.259 3.545 3.240 3.247 2.689 3.299 6.774 1.785 1.005 -4.747 1.530 1.568 0.726 0.514 1.049 1.328 0.881 1.643 0.521 0.989 3.507 3.970 2.095 6.045 2.086 2.098 2.006 9.774 6.113 6.181 5.909 7.847. 50.
(66) 318307.500 318318.900 318386.700 318389.400 318390.200 318387.800 318395.200 318396.200 318393.200 318391.900 318404.600 318405.600 318403.300 318402.100 318398.100 318400.000 318409.600 318409.900 318406.600 318407.600 318419.500 318419.900 318412.100 318413.800 318416.200 318413.000 318417.300 318421.700 318287.700 318281.800 318287.900 318291.100 318309.100 318301.700 318300.600 318299.100 318292.700 318291.800 318294.400 318375.700 318374.700 318373.500 318374.000 318382.900 318385.500 318390.600 318388.900 318388.100 318386.300 318380.900 318381.300. 6390405.000 6390388.000 6390277.000 6390269.000 6390266.000 6390274.000 6390241.000 6390236.000 6390251.000 6390258.000 6390197.000 6390193.000 6390203.000 6390209.000 6390227.000 6390218.000 6390169.000 6390168.000 6390187.000 6390181.000 6390119.000 6390117.000 6390156.000 6390148.000 6390135.000 6390152.000 6390130.000 6390107.000 6390396.000 6390406.000 6390421.000 6390423.000 6390363.000 6390374.000 6390376.000 6390379.000 6390390.000 6390391.000 6390388.000 6390239.000 6390247.000 6390253.000 6390251.000 6390203.000 6390191.000 6390164.000 6390173.000 6390180.000 6390253.000 6390213.000 6390274.000. -55.533 -55.259 -54.229 -54.623 -54.708 -54.463 -55.393 -55.509 -55.140 -54.977 -56.574 -56.741 -56.351 -56.200 -55.733 -55.955 -57.561 -57.585 -56.939 -57.156 -58.535 -58.558 -57.775 -57.926 -58.172 -57.844 -58.294 -58.662 -12.625 -12.633 -45.811 -56.632 -12.510 -12.626 -12.599 -12.568 -12.519 -12.538 -12.501 -13.951 -13.683 -13.435 -13.574 -15.691 -16.198 -17.384 -16.960 -16.611 -44.070 -15.125 -43.313. 5.900 6.087 7.157 5.396 5.898 5.198 4.601 4.525 4.752 4.633 5.320 5.270 5.459 5.411 4.745 4.816 4.858 4.891 5.036 4.867 4.301 4.312 5.219 4.970 4.496 5.124 4.430 5.324 1.790 0.929 6.178 6.234 5.335 1.063 0.961 1.432 1.366 1.524 1.405 2.747 1.947 1.723 1.741 3.295 3.225 3.227 3.215 2.578 1.332 3.012 6.318. 51.
(67) 318385.500 318385.000 318402.900 318399.300 318397.800 318407.400 318396.600 318406.800 318406.700 318402.300 318393.300 318390.800 318396.000 318401.800 318402.900 318399.700 318396.200. 6390273.000 6390261.000 6390105.000 6390123.000 6390129.000 6390147.000 6390136.000 6390087.000 6390088.000 6390166.000 6390151.000 6390163.000 6390138.000 6390171.000 6390186.000 6390203.000 6390218.000. -54.463 -43.748 -19.864 -19.099 -18.798 -47.047 -18.501 -20.536 -20.515 -46.680 -17.854 -17.429 -18.382 -46.171 -56.939 -56.351 -55.955. 3.824 1.052 2.186 3.444 3.067 1.096 2.691 5.627 5.131 0.812 3.341 3.372 2.753 1.155 1.333 2.525 -1.012. 52.
(68) Appendix E NPV SCENARIO 1 & SCENARIO 2. 55.
(69) Scenario 1 Purchase I-site Laser. 2009. 2010. 2011. 2012. 2013. 2014. 2015. 2016. 2017. 2018. 1. 2. 3. 4. 5. 6. 7. 8. 9. 10. 20.0% 0.0% 100.0% 30%. 20.0% 2.7% 102.7% 30%. 20.0% 2.9% 105.7% 30%. 20.0% 2.9% 108.7% 30%. 20.0% 2.9% 111.9% 30%. 20.0% 2.9% 115.1% 30%. 20.0% 2.9% 118.5% 30%. 20.0% 2.9% 121.9% 30%. 20.0% 2.9% 125.5% 30%. 20.0% 2.9% 129.1% 30%. ASSUMPTIONS/RATES Life of Asset Depreciation Inflation Factor Inflation Multiplier Tax Rates:. 5.0 yrs. CAPITAL EXPENDITURE Purchase I-site Laser TOTAL CAPITAL EXPENDITURE. Real A$,000. $. (215,000). Nominal $,000. $. (215,000) $. -. $. -. $. -. $. -. $. -. $. -. $. -. $. -. $. -. $. -. $. -. $. -. $. -. $. -. $. -. $. -. $. -. $ $ $. -. $ $ $. -. $ $ $. -. $ $ $. -. CASH OUTFLOWS Maintenance & warranty costs TOTAL CASH OUTFLOWS. Real A$,000 -. $. (17,500) $. (17,500) $. (17,500) $. (17,500). $. (17,973) $. (18,494) $. (19,030) $. (19,582) $. $ $ $. 48,000 119,000 60,900. 48,000 119,000 60,900. 48,000 119,000 60,900. 48,000 119,000 60,900. Nominal $,000. $. -. Real A$,000 Real A$,000 Real A$,000 Real A$,001 Real A$,000. $ $ $. 48,000 119,000 60,900. $. -. $. -. $. -. $. -. $. -. Nominal $,000. $. 227,900. $. 234,053. $. 240,841. $. 247,825. $. 255,012. $. -. $. -. $. -. $. -. $. -. $ $ $ $ $. 43,000 172,000 12,900 (68,370). $ $ $ $ $. 43,000 129,000 12,900 5,392 (70,216). $ $ $ $ $. 43,000 86,000 12,900 5,548 (72,252). $ $ $ $ $. 43,000 43,000 12,900 5,709 (74,348). $ $ $ $ $. 43,000 12,900 5,875 (76,504). $ $ $ $ $. -. $ $ $ $ $. -. $ $ $ $ $. -. $ $ $ $ $. -. $ $ $ $ $. -. CASH INFLOWS Third party monthend survey savings Additional surveyor not required Additional cast assist. TOTAL CASH INFLOWS. $. -. $ $ $ $. -. $ $ $ $. -. $ $ $ $. -. TAX EFFECTS Depreciation Written Down Value Tax Effects of Capital Expenditure Tax Effects of Cash Outflows Tax Effects of Cash Inflows NET CASH FLOW. Nominal $,000. $. (42,570) $. 164,157. $. 168,543. $. 173,057. $. 177,701. $. -. $. -. $. -. $. -. $. NET CASH FLOW. Real A$,000. $. (42,570) $. 159,841. $. 159,487. $. 159,143. $. 158,809. $. -. $. -. $. -. $. -. $. Discount Factor Discounted Cash Flow @ 8.0%. 8.0%. 0.96. Real A$,000. Cumulative DCF. NPV, 8%. 0.82. 0.76. 0.71. 0.65. $. (40,933) $. 142,308. $. 131,475. $. 121,474. $. 112,239. $. $. (40,933) $. 101,376. $. 232,851. $. 354,325. $. 466,564. $. $. Real A$,000. 0.89. 466,564. 0.61 $ $. 466,564. 0.56 $ $. 466,564. 0.52 $ $. 466,564. 0.48. $ $. 466,564. 466,564. IRR. 375%. Payback. 1.0 yrs. Pre Tax Operating Profit. $. 184,900. $. 173,081. $. 179,347. $. 185,795. $. 192,430. $. -. $. -. $. -. $. -. $. -. After Tax Cash Flow. $. (42,570) $. 164,157. $. 168,543. $. 173,057. $. 177,701. $. -. $. -. $. -. $. -. $. -. 56.
Figure
+7
Related documents
In this cross-sectional analysis of participants from the Brazilian Longitudinal Study of Adult Health (ELSA- Brasil) [ 14 ], we hypothesized that NC could identify an
Tracings of electrocardiograms (lead V4) in patients with hyperkalemic familial periodic paralysis before and during spontaneous attacks of paralysis and after disappearance of
SIBL scored the lowest position due to its poor performance in Debt-Equity, Advances to Assets and Government Securities to Total Investments ratios.. Bank CAR
The degree of resistance exhibited after 1, 10 and 20 subcultures in broth in the absence of strepto- mycin was tested by comparing the number of colonies which grew from the
Discard,as not Salmonella Cultures that give positive KCN and VP test and negative methyl red cultures give negative test (green or unchanged colour) in this broth... After
Here data will be converted into binary which will be plain text and converted into cipher text to hide data. Here steganography is used to encrypt so as to hide
As a result of the calibration, the mean relative indication deviation q ¯ between the reference torque, which was measured by the TTS, and the torque recorded by the torque
RAG-1 0/0 mice inoculated with infected total mononu- clear spleen cells, reconstitution of lymphoid archi- tecture allows accumulation of scrapie agent in the spleen and
