Issues in the Economic Evaluation of Improved Water
Quality Objectives
Khorshed Alam
a, John Rolfe
band Peter Donaghy
ca
Department of Economics & Resources Management, Faculty of Business, University of Southern Queensland, Toowoomba, Queensland 4350, Australia
b
Faculty of Business and Informatics, Central Queensland University, Rockhampton, Queensland 4702, Australia
c
Queensland Department of Primary Industries and Fisheries, Rockhampton, Queensland 4702, Australia.
Abstract
Formulating plans and strategies to protect environmental assets of fresh, estuarine and
marine waters require setting of appropriate water quality objectives. Each environmental
asset requires a certain level of water quality to be maintained. The focus of water quality
objectives recently adopted in Australia has been shifted from maintaining drinking water
quality to ecosystem protection. Based on environmental assets identified in the Douglas
Shire waters and their associated water quality objectives, this paper reviews the process
and information needed to evaluate the potential impacts of improved water quality
objectives.
Keywords: catchment modelling, Douglas Shire, environmental asset, non-market benefit,
water quality improvement
Introduction
Water quality issues have received substantial attention in Australia over the last decade.
guidelines pertaining to safe and clean water at all levels. A national guideline titled the
Australian and New Zealand Guidelines for Fresh and Marine Water Quality (ANZECC,
2000) was formulated within the framework of the National Water Quality Management
Strategy (NWQMS). The ANZECC (2000) provides, inter alia, a framework for
developing water quality objectives (WQOs) following two steps, namely identifying the
environmental values (EVs) of water bodies to be protected, and then establishing a range
of water quality levels to maintain or protect each of the nominated values. The term
‘environmental value’ is often taken to mean the categories and aspects of water use that
communities think are important (EPA, 2004a). In addition to these national guidelines,
state level guidelines have been prepared in the 1990s. In Queensland, the Environmental
Protection (Water) Policy 1997 (EPP 1997) was formulated to provide a framework for
identifying environmental values and associated water quality objectives. Both national and
state guidelines and policies are applicable at the regional level.
Despite these developments in establishing a legislative and regulatory system to
address water quality issues, significant issues remain. These can be grouped into three
main areas. First, there are concerns that water quality objectives may be too low in some
regions, or that some types of emissions (particularly diffuse sources) are not being
considered. Second, there are problems with the current guidelines being too broad to be
very useful at a regional level. ANZECC (2000) put strong emphasis on the need to develop
more locally relevant guidelines. According to the EPA (2005), the essence of a locally
specific water quality indicator is due to the fact that each waterway poses specific
environmental values depending on its physical, biological, social, economic and historical
rainfall and runoff pattern, river discharge, landuse, geology and soil type, topography
(slope length and gradient) and land cover conditions.
The third area of interest relates to the potential to trial more institutional and
market-based instruments (MBIs) instead of a traditional regulatory approach to address water
quality issues. MBIs are increasingly being recognised as cost effective policy mechanisms
to deliver environmental outcomes such as water quality targets in Australia and elsewhere.
A range of pilot MBI projects have recently been trialled in Australia to examine their
applicability in order to address water quality problems. An evaluation of this first round of
MBI pilot programs revealed that auctions, cap and trade, and offsets could be successfully
used to address a range of water quality issues in Australia (Grafton, 2005). The trials have
shown that it is not only important to have a regulatory base for quantity-control
mechanisms, but that is also important to understand the relationship between
environmental outcomes and various levels of intervention.
There is current interest from the Queensland Environmental Protection Agency (EPA)
to set higher standards for water quality as well as to formulate locally specific water
quality objectives. Setting environmental values and water quality objectives for receiving
waters in Queensland is expected to provide long term management goals for both statutory
and non-statutory planning. Once finalized, environmental values and their supporting
water quality objectives will be considered for scheduling under the EPP 1997. State
agencies, local government and other stakeholders would be required to consider scheduled
environmental values and water quality objectives when deciding development applications
for activities that require approvals under the Environmental Protection Act 1994 (EPA,
To meet new water quality objectives, a number of new initiatives may be required in
addition to current mitigation strategies. While improved water quality measures are likely
to generate a range of benefits to society, their introduction will not be costless. A key
question is whether there are net benefits of improved water quality measures, particularly
at the regional level. For example, it may be unclear whether the upgrade of a sewage
treatment plant or restoration of riparian buffers generates sufficient benefits to justify the
cost of these intervention strategies.
The purpose of this paper is to review the process and information needed to evaluate
the potential impacts of stringent water quality objectives in regional areas of Queensland.
The remainder of this paper is set as follows. Methodological issues of measurement are
covered in section two, the link between intervention strategies and load reductions is
reviewed in section three, and the link between water quality changes and environmental
outcomes is reviewed in section four. Measurement issues of environmental outcomes
follow in section five, with concluding comments presented in section six.
2. Methodological Framework for Measuring the Net Benefits of Water
Quality Improvements
Assessing the desirability of potential water quality mitigation actions is complex. The
measurement challenge can be illustrated with the aid of Figure 1. The figure illustrates
how various options to improve water quality successively impact on parameters through to
human value systems. However, impacts at each step in the process can be difficult to
predict because of inadequate scientific knowledge and modelling, variability in systems,
diversity of impacts across a large number of waterways in Queensland, where there are
large variations in the condition of waterways and the different impacts occurring.
There are three links that need to be established and quantified in order to measure the
benefits of water quality improvement flowing to the community and other stakeholders as
a result of the intervention actions being undertaken. These links are:
• First, modelling the load reduction outcomes of intervention strategies to measure the
impact on water quality;
• Secondly, measuring the impact of water quality changes (e.g. load reduction) on the
environmental outcome; and
• Finally, estimating the economic impact on society using a common measure (both
[image:5.612.102.528.428.701.2]tangible and intangible benefits).
Figure 1: Measuring water quality impact on society
Water quality objectives Desired environmental standards Interventions (e.g. urban point source, urban & rural diffuse sources)
It is evident that proper quantification is required between all the three links to measure the
water quality impacts on society. Furthermore, there is a feedback loop between
improvements in environmental outcomes and subsequent impacts on water quality. The
extent to which a particular intervention strategy promotes this type of feedback will impact
on its overall desirability and value. Policy makers in the area of water resources
management quite often face a challenge: how to ensure the best use of scarce resources,
which can be defined as the allocation which maximises the net benefits to society. From an
economic perspective, resources can be allocated efficiently whenever the marginal benefit
of an intervention is greater than or equal to its marginal cost. Thus an economic evaluation
helps to answer the question: which allocation of resources will maximize the net benefit to
society?
In an economic framework, the evaluation of net benefits is done by comparing the cost
of intervention strategies with the value of net benefits achieved. The most common
economic evaluation process is the cost-benefit analysis (CBA)1. This approach assigns a
monetary value to outcomes, which is then directly compared with a mitigation action’s
associated costs2. The application of this approach becomes difficult because of the
uncertainty inherent in dealing with the intervention, due to lack of data (e.g. economic
value of the resulting benefits from an improvement in water quality) and the intertemporal
1
In many instances, the interest is to find the option that meets a pre-defined objective at a minimum cost. In such a situation, a Cost-effectiveness Analysis (CEA) is an appropriate technique to use. Costs are measured in monetary terms such as dollars and effectiveness can be measured in a single common effect specific to the water quality issue being studied (e.g. pollution load reduction). The evaluation would then give a comparison of the cost per unit of pollutant load reduction across the various interventions (Alam et al., 2006a).
2
comparisons of costs and benefits. While the costs of intervention strategies can often be
measured from market data, predicting the impacts of those strategies and evaluating the
benefits in monetary terms is more challenging. The issues involved can be illustrated with
the aid of a Queensland case study.
3. Modelling the Load Reduction Outcomes of Intervention Strategies
The EPA has been undertaking studies about water quality in three regions of
Queensland, namely Moreton Bay/South-east Queensland, Mary River Basin/Great Sandy
Region and Douglas Shire waters (EPA, 2004b). For illustrative purposes, the case of the
Douglas Shire in Far North Queensland is used here. The Douglas Shire waters include the
freshwaters, estuaries and coastal waters of the Daintree, Saltwater, Mossman and
Mowbray catchments, with a total catchment area of about 1,850 km2. The development
pressures facing the Shire are particularly challenging given the region’s high ecological
values. In particular 78 percent of the Shire is World Heritage listed under two World
Heritage Areas – the Great Barrier Reef (GBR) and the Wet Tropics of Tropical North
Queensland. The Shire directly drains into the GBR
Major land uses include rainforest and sclerophyll forest (~87%), mixed agriculture
such as sugar cane, grazing, horticulture and aquaculture (~9%) and urban and rural
residential uses (Rolfe et al., 2005). The region itself is a high tourism growth area,
attracting large numbers of tourists every year. Land use activities in the catchments are
generally contributing to a decline in water quality. High concentrations of total suspended
resources, but the Great Barrier Reef (GBR) lagoon. The control and reduction of sediment
and nutrient movement is considered an essential mechanism to reduce pollutant loads
within the GBR.
Unsustainable levels of nutrients, sediments and toxicants in aquatic ecosystems have
been identified as key water quality issues for each of the major catchments in the Douglas
Shire. The EPA (2004c) has considered interventions as surrogates for a wide range of
possible management actions to reduce the amount of suspended sediment (SS), nitrogen
(N) and phosphorous (P) in the Douglas Shire waterways by 2026, based on the research
undertaken by Bartley et al. (2004a; 2004b). These objectives of pollutant load reduction
may include a range of physical, chemical and biological parameters, all of which provide a
detailed description of catchment and overall water quality condition.
The effect of land-use change or management interventions on pollutant loads can be
measured with the recent advancement of catchment modelling in Australia such as SedNet
(Sediment River Network Model) and EMSS (Environmental Management Support
System). Catchment modelling is a predictive support tool used to provide information
about the impact of management interventions on pollutant loads. Using catchment
modeling such as SedNet, estimates have been made of total point and diffuse source loads
for each of the major catchments in the Douglas Shire.
Indicators of the key water quality issues that are the subject of SedNet model
predictions are TN, TP and TSS, expressed as annual loads to waterways. Intervention
scenarios include a range of planned and possible future actions by both government and
the community (including industry), targeting the reduction of urban and rural point source
aquatic ecosystems decline and, over time, achieving sustainable management of the water
environment. Possible interventions include both existing programs, such as the upgrades
of sewerage treatment plants, and projected activities such as the restoration of riparian
areas and management of cane drains.
To judge the efficiency of potential mitigation actions, the SedNet model can be used to
predict likely changes in pollution loads. However, to make the modelling task more
manageable in this case study, the scenarios for the catchment have been simplified in three
important ways. First, only a select number of potential mitigation actions have been
nominated in each of the three broad categories of point, diffuse urban and diffuse rural
sources. The actions selected are assumed to be broadly representative of the wider range of
actions available within each category. Second, the impacts for only one level of each
action have been modelled. There is a significant lack of scientific data available in the case
study region that links reductions in TSS, TN and TP to more complicated biological
improvements in water quality. Third, impacts have only been assessed in terms of three
indicators of water quality, namely TSS, TP and TN. This has the potential of understating
impacts because it excludes impacts of pathogens, toxicants, acid sulphate soils and other
issues from the analysis, which will not be reflected in measures of TSS, TP and TN.
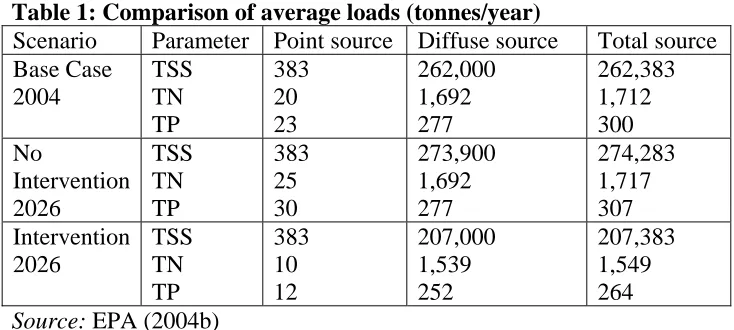
Once these catchment scenarios were modelled, the range of expected impacts could
then be predicted. Table 1 presents the modelled TSS, TN, and TP loads for the case study
area for the base case (i.e. 2004), No Intervention and Intervention scenarios. The No
Intervention scenario represents a business-as-usual case where water quality levels are
projected to decline in line with current trends and increasing populations up to 2026. It is
community initiatives. The second scenario is the Intervention scenario where management
intervention strategies are introduced that enhance or protect water quality in spite of
population increases, economic development and land use change up to 2026. Under the
Intervention Scenario, a number of key load reducing best management strategies were
modelled to protect the environmental values. These included investing significantly in new
and retrofitting existing waste water treatment plants, reducing rural diffuse loads by
introducing vegetated riparian buffer strips and riparian rehabilitation and investing in a
number of structural and non-structural urban diffuse management actions. With the
introduction of these intervention strategies load reductions were modelled for the
[image:10.612.102.469.376.541.2]waterways within the case study area.
Table 1: Comparison of average loads (tonnes/year)
Scenario Parameter Point source Diffuse source Total source Base Case 2004 TSS TN TP 383 20 23 262,000 1,692 277 262,383 1,712 300 No Intervention 2026 TSS TN TP 383 25 30 273,900 1,692 277 274,283 1,717 307 Intervention 2026 TSS TN TP 383 10 12 207,000 1,539 252 207,383 1,549 264 Source: EPA (2004b)
In order to estimate the benefit of introducing load reducing best practice management
strategies at societal level in the Douglas Shire, annual net benefits need to be compared for
the No Intervention and Intervention scenarios. The basis for this comparison is the annual
difference between TSS, TN and TP loads for the two scenarios starting in 2004 and
strategies will have reduced TSS, TN and TP loads from the Base Case levels by the
following amounts:
• Reduction in total sediment of 55,000 t/yr;
• Reduction in total nitrogen of 163 t/yr; and
• Reduction in total phosphorous of 36 t/yr.
Rolfe et al. (2005) estimated that an additional amount of $18.91 million in present
value terms would be required to achieve these load reductions in the Douglas Shire waters
outlined under the Intervention scenario. The present value represents a stream of costs
arising from different intervention scenarios, after taking into account the ‘time value of
money’ (i.e. discounting). Now, at this stage, it can be argued that in a general sense, policy
makers could weigh up the social benefits of various mitigation activities and compare
them to the costs of achieving them, to identify the activities that provide net social
benefits. This process would take into account a wider range of impacts, not only tangible
or market-related, but also non-market social and environmental consequences. In the same
way, policy makers can identify the appropriate level and magnitude of mitigation
strategies; for instance, whether it is worthwhile to reduce water quality impacts by
targeting reductions at the source, treating water in some way to improve quality, or
banning certain activities at particular sites.
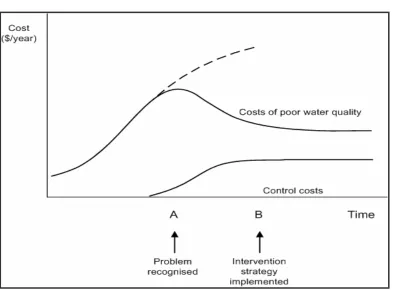
The problem can also be framed in terms of deciding which standard of water quality
generates the lowest net cost to society. Figure 2 demonstrates the general policy situation
facing decision makers. Water quality problems emerge, with costs trending upwards over
blow out (dotted line) to have significant impacts. Alternatively, governments recognise the
problem and begin intervention and education strategies. These controls have costs, but
help to minimise or reduce the costs of adverse water quality (the cost curve trends lower
than its initial path). A program is worthwhile when the present value of the control costs
are lower than the present value of the savings in impact costs achieved as a result of the
controls. The use of the discounting process helps to account for variations in costs that fall
[image:12.612.111.505.306.596.2]in different time periods.
Figure 2: Minimising the costs of poor water quality
Source:Adapted from Agtech Group (1999)
In reality, it is relatively straightforward to generate cost estimates for different
the other hand, a wide variety of potential benefits (reductions in social costs) are expected
to accrue from water quality improvements. The value of these potential benefits will
depend on the specific uses of water. While in many cases the understanding of how a
particular use will benefit from an improvement in water quality is reasonably well
understood, this is not so easy for other uses. Therefore, estimating benefits of water quality
improvement, particularly those involving non-use values, is often problematic. The
relevant issues are discussed in the sections below.
4. Linking Water Quality Changes with the Environmental Outcomes
Based on the projected reduction of pollutant loads, the next step is to identify the physical
linkage between the projected changes and the benefit activities. For example, a
relationship needs to be established and quantified between the projected changes under the
different scenarios and human use activities such as fishing and recreation at the
community level. However, this information is difficult to assess for a number of reasons:
• Impacts often depend on a number of factors;
• There are a number of time lags involved;
• Scientific data and modelling is limited; and
• There is little data available about how human use varies with ecosystem health.
It is likely that a further deterioration in ecosystem health will have a larger impact on
human interactions than will further improvements. This is because further deteriorations
might mean that critical thresholds are reached, so that fish catches plummet, or swimming
water quality are unlikely to directly correspond with increased levels of usage. For
example, if water quality parameters improve by 50%, it is very unlikely that the number of
people swimming (or the number of swimming events) in the Douglas Shire waters
increases by 50% as well.
Furthermore, there still remains considerable uncertainty about how a reduction in
loads entering into the Shire waterways may translate through to community benefits in
terms of environmental outcomes. Load reductions have been used in this study as a way of
summarising the policy changes needed. However, it is not fully accurate to focus on load
reductions, as the key focus here is on setting water quality guidelines. These relate to
ambient water quality rather total loads, so any policy outcomes are likely to involve
consideration of the timing and intensity of emissions into waterways as well as other
factors.
A review of the literature was unable to identify a plausible scientific approach to
estimate marginal changes in the value of water use resulting from the intervention
measures assessed. For example, if intervention measures were introduced in the Douglas
Shire that improved water quality parameters by 33%, it is unlikely that the value of
recreational fishing, waterside properties and tourism would also increase by 33%.
Unfortunately there is a lack of modelling data to indicate how human use of water
resources varies with ecosystem health. The difficulty of estimating marginal impacts
resulting from changes in water quality is a key reason why it is difficult to measure the
impact of an intervention action on the environmental outcome. The modelling feature that
can establish linkages between changes in water quality and the impacts on human
5. Estimating Environmental Outcomes into a Common Measure
The next link in the framework would be the conversion of many physical, chemical and
biological effects of water quality into a common measuring yardstick that can be
compared with costs if required. Due to its varying nature, enhancing or protecting water
quality in the Douglas Shire catchments can generate a wide range of goods and services
for the community, most of which are external to the actual water market. For example,
water bodies provide recreation and aesthetic benefits to communities, as well as being a
basis for a number of ecosystem services that communities rely on.
Changes in water quality can be expected to have impacts on the community in a
number of ways. Some of those changes can relate to the direct use of water systems, e.g.
for recreation or agricultural production. Other changes may indirectly impact the
community, e.g. by changing the aesthetics of waterfront properties. In some cases, such as
where there are impacts on biodiversity protection, people may have strong preferences
about the changes without necessarily having any contact with the environmental assets.
For a rational decision making it is therefore important to include all relevant categories
of impacts, whether or not they can be easily assessed and measured. There are three broad
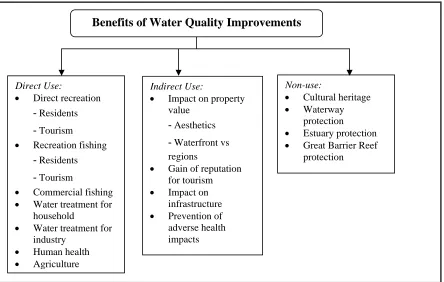
categories of benefits that a water quality improvement can generate, being:
• Direct use benefits: values derived from goods and services that can be consumed,
traded or enjoyed on-site, e.g. fishing and recreation. Direct use may include both
• Indirect use benefits: relating values derived from ecosystem services of improved
water quality that support and protect off-site activities, e.g. reputation for tourism
and impact on property values.
• Non-use benefit: values derived neither from current direct nor indirect use of
improved water quality, rather from altruistic or intrinsic motives in that a resource
(e.g. cultural heritage) is being protected and/or restored for others’ use.
A summary of the impacts that might be expected from improvements in water quality
in the Douglas Shire is shown in Figure 3. A detailed discussion on the categories of these
[image:16.612.88.532.359.641.2]water quality benefits in the Douglas Shire is described in Alam et al. (2006b)
Figure 3: Expected Benefits of Water Quality Improvements
Direct Use:
• Direct recreation - Residents - Tourism
• Recreation fishing - Residents - Tourism
• Commercial fishing • Water treatment for
household
• Water treatment for industry
• Human health • Agriculture
Indirect Use:
• Impact on property value
- Aesthetics - Waterfront vs regions
• Gain of reputation for tourism • Impact on
infrastructure • Prevention of adverse health impacts
Non-use:
• Cultural heritage • Waterway
protection • Estuary protection • Great Barrier Reef
Although many of the impacts reported in Figure 3 are comparatively easy to identify, it
is rather difficult to monetize these impacts as the benefits do not typically accrue in the
form of readily measurable financial flows. For example, major impacts of reduced water
quality may reduce recreation activities (i.e. beaches closed to swimming and boating) and
put more biodiversity at risk in the region, neither of which are priced in markets. Many of
the most significant impacts of reduced water quality are for items that are not directly
priced in markets. If these impacts are ignored, it may lead to very misleading information
to society and policy-making bodies. Where impacts are not directly priced in markets,
specialised valuation techniques are currently available to assign monetary values on such
goods and services. There are two main groups of these techniques: revealed preference
methods and stated preference methods. Techniques for measuring benefits of non-market
natural resource and environmental goods are now well-known and documented in
numerous books and articles (e.g. Champ et al., 2003). An overview of economic valuation
techniques is provided by Queensland EPA (EPA, 2003).
To fully account for all the impacts it is important to be able to assess most impacts in
monetary values to ensure each strategy is compared in a consistent manner. Some of the
benefit estimates of intervention strategies can be taken from market information. In the
Douglas Shire region, this might include impacts on tourism, commercial fishing,
agriculture, infrastructure and saved water treatment costs. In many cases production or
other models are used to identify how changes in environmental conditions impact on
economic values. For example, a dose-response model might be used to assess impacts of
model might assess the additional cost of replacing damaged environmental assets due to
poor water quality (EPA, 2003).
A review of the literature on non-market valuation studies undertaken in the area of
water quality improvement has identified a number of examples where stated and revealed
preference techniques have been applied to estimate the non-market benefits of water
quality improvement in Australia and overseas. Whilst there is a limited pool of studies
relevant to water quality issues in Queensland and Australia, across the world, quite a large
number of studies have been conducted to capture the non-market aspects of water quality
improvement (for a detailed description, see Rolfe et al., 2005).
However, these valuation studies grossly differ in terms of scope of the water quality
issues considered for the Douglas Shire waters which necessitate the need for further
research and empirical/valuation studies both at the study area and specific to the scope of
water quality objectives to protect the environmental assets. This also makes it hard to use
benefit transfer approach to ‘borrow’ values of original estimates to the study of interest
(i.e. Douglas Shire).
6. Conclusion
Different land uses and human activities have different impacts on water quality in
waterways at local and regional level. A considerable amount of research has been directed
to quantifying the physical magnitude of these impacts under varying circumstances,
although considerable information gaps still remain. The focus of this paper is to find a link
on how setting of water quality objectives can enhance or protect environmental assets in a
management intervention to impacts at the community level. Due to the advancement of
scientific knowledge and the availability of data and the introduction of catchment
modelling, it is now easier to predict the pollutant load reduction from management actions.
The development of economic valuation techniques means that where pollutant load
reductions benefit society, it is possible to assign a monetary value to the many non-market
benefits of water quality improvement.
Despite these advances, it is often not possible to evaluate the net benefits of water
quality improvement in economic terms. There are two key reasons for this. The first is that
the physical linkages between mitigation strategies and impacts on society remain poorly
understood. While there is better understanding of the linkages between mitigation
strategies and pollutant levels, information about the subsequent impacts on environmental
conditions and human direct, indirect and non-use values remains poorly understood.
The second key reason is that very few economic valuation studies have been
conducted, so that there is little knowledge about the size or extent of economic benefits
that might be involved. To provide a better framework for evaluating planned mitigation
strategies, both issues will need to be addressed. Therefore, there is a role for scientists to
provide information about the linkages between mitigation strategies and human systems,
and a role for economists to assess those impacts with the aid of non-market valuation
techniques.
The research reported in this paper was funded by the Queensland Department of
Environmental and Heritage through the Institute for Sustainable Regional Development at
Central Queensland University.
References
Alam, K., Rolfe, J. and Donaghy, P. (2006a) An economic analysis of improved water quality. Paper presented to the 50th Annual Conference of the Australian Agricultural and Resource Economics Society (AARES), February 8-10, Manly, NSW.
Alam, K., Rolfe, J. and Donaghy, P. (2006b) Economic and social impact assessment of water quality improvement. Australasian Journal of Regional Studies, 12(1): 85-102.
Atech Group (1999) Cost of Algal Blooms, Occasional paper 26/99, Land and water Resources Research and Development Corporation, Canberra.
Australian and New Zealand Environment and Conservation Council (ANZECC) (2000) Australian and New Zealand Guidelines for Fresh and Marine Water Quality. Australian and New Zealand Environment and Conservation Council and Agriculture and Resource Management Council of Australia and New Zealand, Canberra.
Bartley, R., Henderson, A., Baker, G., Bormans M. and Wilkinson, S. (2004a) Patterns of erosion and sediment and nutrient transport in the Douglas Shire catchments (Daintree, Saltwater, Mossman and Mowbray), Queensland. A Report to Douglas Shire Council and the Department of the Environment and Heritage, CSIRO Land and Water Client Report.
Bartley, R., Henderson, A., Hotham, H., Hartcher, M. and Wilkinson S. (2004b) Using the SedNet model for scenario analysis within the Douglas Shire Catchment: Final results and evaluation of the model. A report to the Douglas Shire Council and the Department of Environment and Heritage, CSIRO Land and Water Client Report.
Champ, P.A., Boyle, K.J. and Brown, T.C. (eds) (2003) A Primer on Nonmarket Valuation, Kluwer Academic Publishers, Boston.
Campbell, H.E. and Brown, R.P.C. (2003) Benefit-cost Analysis: Financial and Economic Appraisal Using Spreadsheets, Cambridge University Press, New York.
Environmental Protection Agency (EPA) (2003) Environmental Economic Valuation: An Introductory Guide to Policy-makers and Practitioners, Queensland Government, Brisbane.
Environmental Protection Agency (EPA) (2004a) Queensland water quality guidelines 2004. Draft, Queensland Government, Brisbane. Available at:
http://www.epa.qld.gov.au/environmental_management/water/water_quality_guidelines, Accessed 18 May 2005.
Environmental Protection Agency (EPA) (2004b) Information report: Environmental values projects. Queensland Government, Brisbane.
Environmental Protection Agency (EPA) (2004c) Explanations and interpretations of diffuse and point source modelling and cost estimates for SEQ, Mary and Great Sandy Straits and the Douglas Shire. Queensland Government, Brisbane.
Environmental Protection Agency (EPA) (2005) Information available at: http://www.epa.qld.gov.au, Accessed 18 May 2005.
Grafton, R.Q. (2005) Evaluation of round one of the market-based instrument pilot program. National Action Plan for Salinity and Water Quality, Australian Government, Canberra, pp. 5-31. Available at: http://www.napswq.gov.au/mbi/round1-evaluation.html, Accessed: 9 September 2006.
Pearce, D., Atkinson, G. and Mourato, S. (2006) Cost-Benefit Analysis and the Environment: Recent Development, Organisation for Economic Co-operation and Development (OECD).