METHOD DEVOLOPMENT AND VALIDATION OF
ANTINEOPLASTIC DRUG IN SOLID DOSAGE FORM
USING HPLC METHOD
A dissertation submitted to
THE TAMILNADU Dr.M.G.R MEDICAL UNIVERSITY
CHENNAI- 600 032.
In partial fulfillment of the requirements for the award of Degree of
MASTER OF PHARMACY
IN
PHARMACEUTICAL ANALYSIS
Submitted
BY
ALI EBRAHEEM FADLALLAH EBRAHEEM
Reg.No.261330951
Under the guidance of
Prof.Dr.D.Babu Ananth, M.Pharm,Ph.D.,
DEPARTMENT OF PHARMACEUTICAL ANALYSIS,
EDAYATHANGUDY.G.S PILLAY COLLEGE OF PHARMACY
NAGAPATTINAM-611002
METHOD DEVOLOPMENT AND VALIDATION OF
ANTINEOPLASTIC DRUG IN SOLID DOSAGE FORM
USING HPLC METHOD
A dissertation submitted to
THE TAMILNADU Dr.M.G.R MEDICAL UNIVERSITY
CHENNAI- 600 032.
In partial fulfillment of the requirements for the award of Degree of
MASTER OF PHARMACY
IN
PHARMACEUTICAL ANALYSIS
Submitted
By
Reg.No.
261330951DEPARTMENT OF PHARMACEUTICAL ANALYSIS,
EDAYATHANGUDY.G.S PILLAY COLLEGE OF PHARMACY
NAGAPATTINAM-611002
Prof.Dr.D.BabuAnanth,
M.Pharm., Ph.D.,Principal,
Edayathangudy.G.S.Pillay College of Pharmacy,
Nagapattinam – 611 002.
CERTIFICATE
This is to certify that the dissertation entitled
“
METHOD
DEVOLOPMENT AND VALIDATION OF ANTINEOPLASTIC
DRUG IN SOLID DOSAGE FORM USING HPLC METHOD
”
submitted by
Ali Ebraheem Fadlallah Ebraheem
(Reg No:
261330951
)in partial fulfillment for the award of degree of Master of
Pharmacy to the Tamilnadu Dr. M.G.R Medical University, Chennai is an
independent bonafide work of the candidate carried out under my
guidance
in
Department
of
Pharmaceutical
Analysis,
Edayathangudy.G.S.Pillay
College
of
Pharmacy,
Nagapattinam.
during the academic year 2014-2015.
Place: Nagapattinam
Prof.Dr.D.BabuAnanth,
M.Pharm., Ph.D.,ACKNOWLEDGEMENT
I would like to express profound gratitude to Jothimani Chevalier
Thiru.G.S.Pillay,
Chairman, E.G.S.Pillay College of Pharmacy, and
Thiru.S.Paramesvaran,
M.Com., FCCA.,Secretary, E.G.S.Pillay College
of Pharmacy.
I express my sincere and deep sense of gratitude to my guide
Prof.Dr.D.BabuAnanth,
M.Pharm, Ph.D., Principal, Department of
Pharmaceutical
Analysis,
Edayathangudy.G.S.Pillay
College
of
Pharmacy, for his invaluable and extreme support, encouragement, and
co-operation throughout the course of my work.
I express my sincere gratitude to
Prof. Dr.M.Murugan,
M.Pharm.,Ph.D
.,Director cum Professor, Head, Department of Pharmaceutics.
E.G.S.Pillay College of Pharmacy, for his encouragement throughout the
course of my work.
I wish to express my great thanks to Prof.K.Shahul Hameed
Maraicar ,
M.Pharm., (Ph.D),Director cum Professor , Department of
Pharmaceutics, E.G.S.Pillay College of Pharmacy, for his support and
valuable guidance during my project work.
I would like to extend my thanks to all the
Teaching Staff
and
Non Teaching Staff, who are all supported me for the successful
completion of my project work.
Last but not least, I express my deep sense of gratitude to my
parents, family members and friends for their constant valuable blessings
INDEX
S.NO
CONTENTS
PAGE NO
1
INTRODUCTION
1
2
LITERATURE REVIEW
9
3
DRUG PROFILE
12
4
AIM & OBJECTIVE
19
5
PLAN OF WORK
20
6
MATERIALS & METHODS
22
7
RESULTS & DISCUSSION
39
8
SUMMARY
76
9
CONCLUSION
78
10
BIBLIOGRAPHY
79
1
1.0. INTRODUCTION
1.1. The Importance Of Newer Analytical Method1
Drug analysis entails identification, characterization and determination of
drugs in mixtures such as dosage forms and biological fluids. The number of drugs
acquainted into the market has been increasing at an alarming rate. These drugs
may be either new entity in the market or partial structural modifications of the
existing drug. Newer analytical methods are developed for these drugs or drug
combinations of the following reasons:
The drug or drug combinations mayn‟t be official in any pharmacopoeia.
Exploring literature may not reveal an analytical method for the drug or its combinations.
Analytical methods may not be available for the drug combination due to the interference caused by excipients.
Analytical methods for the quantification of drug or drug combination from biological fluid may not be available or usable.
Analytical methods for a drug in combination with other drugs may not be available.
On the other hand, the existing procedure may,
2
Involve any tedious extraction or separation steps, which may be quite time consuming.
Not be rapid, reliable or sensitive.
The newly developed analytical methods2 find their importance in various fields
like
Research institutions,
Quality control department in industries,
Approved testing laboratories,
Bio-pharmaceutics and Bio-equivalence studies,
Clinical pharmacokinetic studies,
Drug-drug interaction studies and
Toxicology studies.
1.2. Estimation of drugs in dosage forms3
The methods of estimation of drugs are divided into physical, chemical, and
physico-chemical and biological ones. Among these physico-chemical and
physical methods are widely used. Physical methods of analysis involve the study
of the physical properties of a substance. They include determination of the
solubility, transparency or degree of turbidity, color, density or specific gravity
(for liquids), moisture content and melting, freezing and boiling points. Physico
chemical methods are employed to study the physical phenomenon that occurs as a
result of chemical reactions.
Among the physicochemical methods the most important are optical
3
photometry including photo colorimetry and spectrofluorimetry covering
UV-Visible and I.R. regions, Nephelometry and turbidimetry), Electro chemical
(potentiometry, colorimetry, amperometry, and polarography) and
chromatographic methods like
(column, paper, thin layer, gas liquid, high performance liquid) etc.
Method involving nuclear reactions such as nuclear magnetic resonance
(N.M.R) and paramagnetic resonance (P.M.R) are becoming more and more
popular. The combination of liquid chromatography with mass spectroscopy is one
of the most powerful tools available.
The chemical methods include the gravimetric and volumetric procedures,
which are based on complex formation, acid-base reactions, precipitations and
red-ox reactions, titration in non-aqueous media and complexometric titrations are
various types which are widely used in pharmaceutical analysis.
Analytical methods for the drugs in individual or combined dosage forms includes
a. Classical separation or wet analysis (Non-instrumental)
b. Instrumental method of analysis
Spectral methods
Electro analytical methods
4
Classical separation or wet analysis (Non-instrumental)
These processes subject the component of interest to classical separation
techniques like extraction or isolation, then with a suitable estimation procedure
namely gravimetry and volumetry etc.
Instrumental method of analysis
By this process, the component of interest is separated and or analysed by
using the following techniques
i. Spectral Methods
The spectral techniques are used to measure electromagnetic radiation,
which is either absorbed or emitted by the sample. E.g. UV-Visible spectroscopy,
IR-spectroscopy, NMR & ESR-spectroscopy, flame photometry, flourimetry,
atomic absorption spectroscopy and etc.
ii. Electro Analytical Methods
Electro analytical methods involve the measurement of current voltage or
resistance as a property of concentration of the component in
5 iii. Chromatographic Methods
Chromatography is a separation technique that is based on differing
affinities of a mixture of solutes between at least two phases. The result is a
physical separation of the mixture into its various components. The affinities or
interactions can be classified in terms of a solute adhering to the surface of a polar
solid (adsorption), a solute dissolving in a liquid (partition), and a solute passing
through or impeded by a porous substance based on its molecular size (exclusion).
1.3. HPLC
The High Pressure or Performance Liquid Chromatography (HPLC) is a
type of chromatography in which separation occurs between a pressurised liquid
as mobile phase and a stationary phase contained in a column, one end of which is
attached to source of pressure.5,6
The technique of High Performance Liquid Chromatography is so called
because of its improvement performance when compared to classical column
chromatography. It is also called as High pressure liquid chromatography since
high pressure is used when compared to classical column chromatography.
te of distribution of drugs between stationary and mobile phase is
controlled by diffusion process, if diffusion is minimized, a faster and effective
separation can be achieved.
With HPLC, a pump (rather than gravity) provides the higher pressure
required to propel the mobile phase and analyte through the densely packed
column. The increased density arises from smaller particle sizes. This allows for a
better separation on columns of shorter length when compared to ordinary column
6
A liquid chromatography7 consists of a reservoir containing the mobile
phase, a pump to force the mobile phase through the system at high pressure, an
injector to introduce the sample in to mobile phase, a chromatographic column, a
detector, and a data collection device such as computer, integrator or recorder.
Short, small-bore columns containing densely packed particles of stationary phase
provide for rapid exchange of compounds between the mobile phase and
stationary phases. In addition to receiving and reporting detector output,
computers are used to control chromatographic settings and operations.
1.4. Principle of separation8
The principle of separation in normal phase mode and reverse phase mode
is adsorption. When a mixture of components are introduced into a HPLC
column, they travel according to their relative affinities towards the stationary
phase. The component which has more affinity towards the stationary phase
travels slower. The component which has less affinity towards the stationary phase
travels faster. Since no two components have the same affinity towards the
stationary phase,the components are separated.
1.5. Types of HPLC techniques
i) Based on modes of chromatography
(a)Normal Phase chromatography
7 ii) Based on principle of separation
(a)Adsorption chromatography
(b)Ion exchange chromatography
(c)Ion pair chromatography
(d)Size exclusion chromatography
(e)Affinity chromatography
(f) Chiral phase chromatography
iii) Based on elution technique
(a)Isocratic separation
(b)Gradient separation
iv)Based on the scale of operation
(a)Analytical HPLC
(b)Preparative HPLC
v) Based on the type of analysis
(a)Qualitative analysis
8 i) Based on Mode of Chromatography
a) Normal phase mode chromatography
In normal phase mode, the stationary phase (e.g. silica gel) is polar in
nature and the mobile phase is non-polar. In this technique, non-polar compounds
travel faster and are eluted first. This is because less affinity between solute and
stationary phase. Polar compounds are retained for longer time in the column
because more affinity towards stationary phase and takes more time to be eluted
from the column.
This is not advantageous in pharmaceutical applications since most of the
drug molecules are polar in nature and takes longer time to be eluted and detected.
Hence this technique is not widely used in pharmacy.
b) Reverse phase mode chromatography
In reverse phase technique, a non-polar stationary phase is used. The
mobile phase is polar in nature. Hence polar components get eluted first and
non-polar compounds are retained for a longer time. Since most of the drugs and
pharmaceuticals are polar in nature, they are not retained for a longer time and
eluted faster, which is advantageous. Different columns are used are ODS
9
1.2. LITERATURE REVIEW
1.3. Literature review of drug
Literature survey was carried out to enumerate the reported analytical
methods for the selected drugs in individually or combination with other drugs.
Mahmood Ahmad et al.,12validated and reported a rapid, sensitive and reproducible high performance liquid
chromatographic (HPLC) method in plasma for simultaneous
quantification of 5-fluorouracil, Adriamycin and
Cyclophosphamide (FAC) using C18 column with mobile phase
consisting of 0.05 M disodium hydrogen phosphate and acetonitrile
(65:35 v/v) containing 0.5 mL/L triethylamine (pH 3.7).The flow rate
was 0.650 mL/min. UV detection of FAC was set at 266, 254 and 198
nm respectively. Total run time was 15 min and retention times for
5-fluorouracil, cyclophosphamide and adriamycin were 4.1, 7.7 and 10.9
min respectively.
Isarita Martins et al.,13 reported Simultaneous determination of
Cyclophosphamide and Ifosfamide in Plasma using SPE-
HPLC-UV method. The assay was performed by HPLC-UV, with a C18
column (5μm, 150 x 4 mm) and detection in 195 nm. The mobile phase
was constituted by phosphate buffer 10 mM pH 6.0 : acetonitrile (77.25 :
10
Rodney R. Larson et al.,14 reported HPLC Method development for simultaneous analysis of five antineoplastic agents using
Waters Symmetry C8 column with mobile phase consisting of
22.75 percent acetonitrile in water buffered to a pH of 6.0. The detection
was performed by UV detector at 195nm.
Abu M. Rustum et al.,15 had developed a RP-HPLC method for the
determination of Cyclophosphamide in blood and plasma
using a short column packed with 5-μm reversed-phase octadecylsilane
(ODS) with an isocratic elution of 5 mM potassium phosphate (pH 6.80)
& acetonitrile in the ratio 80:20 v/v at a flow-rate of 1.0 ml/min. The
detection was performedby UV detector at 195nm.
Terry T. Kensler et al.,16 reported High-performance liquid
chromatographic analysis of cyclophosphamide in the presence
of its hydrolysis products. The drug was quantified using a UV detector
at a low wavelength. A single band was observed for the intact drug,
which was well separated from its hydrolysis product(s).
Nagulu Malothu et al.,17 developed and reported a rapid and simple
HPLC method for the determination of cyclophosphamide
in human serum using 250×4.6 mm ODS column with mobile phase
consisting of water and acetonitrile (70:30) at a flow rate of 1.2ml/min.
11
standard. The detection was performed by UV detector at
197nm.
LI Su-hua et al.,18reported HPLC method development fordetermining
the concentration of Cyclophosphamide in the
plasma of mice using diamonsil C18 column, with the detective UV
wavelength of 200nm.Acetonitrile and water with the ratio of 18 : 82
(V/V) was used as mobile phase at a flow rate of 0.5ml/min.
Respaud.R et al.,19reported Fast Analysis of ChemotherapyDrugs with
the Agilent Pursuit XRs Ultra Diphenyl Column.
Using an HPLC system with Agilent Polaris and Agilent Pursuit
columns, researchers at the Hôpital Européen Georges
Pompidou validated a method that differentiated cancer drugs in less
than three minutes. This is a major step in developing an analytical
verification procedure to improve the quality of drug delivery for cancer
patients, without compromising patient experience.
Zhuorong Li et al.,20 reported Nitrobenzo-cyclophosphamides
As potential prodrugs for bioreductive activation using
Eschericia coli nitroreductase. Series of four benzo
cyclophosphamide analogues were designed and
synthesized incorporating a strategically placed nitro group in a position
12 2.2. DRUG PROFILE
2.2.1. CYCLOPHOSPHAMIDE (CP)46
Description
Cyclophosphamide is a synthetic alkylating agent chemically related to
the nitrogen mustards with antineoplastic and immunosuppressive
activities. It is a prodrug that requires activation by the cytochrome
P450 enzyme system to form its pharmacologically active metabolite
4-hydroxyl cyclo-phosphamide. The metabolites are genotoxic due to their
ability to cross-link DNA and thereby cause DNA damages.
Chemical structure
13 Generic name: Cyclophosphamide 50mg
Brand name: Cytoxan 50mg
Preparations: Powder for intravenous injection: 100, 200, 500, 1000,
and 2000 mg. Tablets: 25, 50 mg.
Physical and chemical properties
Basic physical and chemical properties of CP are summarized below
Molecular formula: C7H15Cl2N2O2P
Molecular weight: 261.09
Physical properties: Odourless, fine white crystalline powder
Melting point: 49.5 – 53 ° C
Boiling Point: 336° C
Density: 1.479 g/cm3
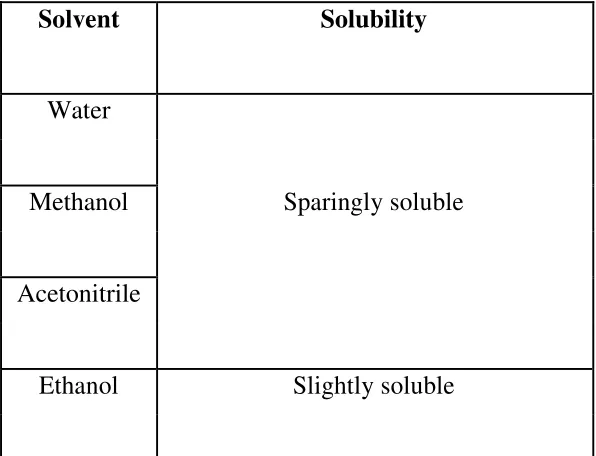
Solubility: sparingly soluble in water, methanol,
Acetonitrile and slightly soluble in ethanol
14
pKa: 4.5-6.5
Stability: Hydrolysis occurs at temperatures above 30
°C, with removal of chlorine atoms. Sensitive
to oxidation, moisture and light.
Mechanism of action of CP
First CP is converted by the liver into two chemicals acrolein and
phosphoramide. Acrolein and phosphoramides are the active
compounds that prevent cell division by cross linking DNA strands and
decreasing DNA synthesis.
Pharmacokinetics
Absorption, distribution and elimination of CP
CP is well absorbed orally, with peak concentrations occurring
after 1-3 hours and has bioavailability of 85-100%. The drug is rapidly
absorbed from the blood after IV injection.
CP is distributed with a volume of distribution of 30-50 L, which
approximates to the total body water. Penetration of CP and its
metabolites into body fluids is limited. Metabolites like
CarboxyCP and DicarboxyCP were not found in cerebrospinal fluid
15
CP and its metabolites are eliminated by urine in 24 hours after
the start of treatment. The major function of CP in the body is
eliminated by hepatic metabolism, but small fraction is eliminated by
renal excretion of unchanged drug in urine.
Small fraction of CP dose is eliminated via faeces and expired air. The
elimination half-life of CP ranges between 5-9 hours over a large
concentration range. The plasma half-life of CP is approximately 5 h in
human during the first day after the dose.
Cyclophosphamide use
CP has been widely in different disease treatments
) Breast cancer
a) Ovarian cancer
b) Prostate cancer
c) Lung cancer
Lupus erythematosus
Rheumatoid arthritis
Multiple Sclerosis
Idiopathic pulmonary fibrosis
16
Hodgkin’s Lymphoma
Thrombocytopenic purpura
Polyarteritisnodosa
Anaemia
Side effects of Cyclophosphamide47
It includes-
Hair loss
Vomiting
Diarrhoea
Mouth sores
Weight loss
Sterility
17 Adverse Effects48
1.9.1. black, tarry stools
1.9.2. red urine
1.9.3. unusual bruising or bleeding
1.9.4. unusual tiredness or weakness
1.9.5. sore throat, cough, fever, or other signs of infection
swelling in the legs, ankles, or feet
chest pain
Drug Interactions48
The rate of metabolism and the leukopenic activity of
cyclophosphamide reportedly are increased by chronic administration of
high doses of phenobarbital.
Cyclophosphamide treatment causes a marked and persistent inhibition
of cholinesterase activity and potentiates the effect of succinylcholine
chloride.
Allopurinol (Zyloprim) enhances the ability of cyclophosphamide to
reduce production of blood cells from the bone marrow.
Increases the occurrence of heart failure that is caused by doxorubicin
18
Increases the action of blood thinners such as warfarin
(Coumadin), and decreases the effectiveness of quinolone
antibiotics (Cipro).
Dosage48
The usual initial dose of cytoxan for adults and children is
40-50 mg/kg administered intravenously over 2-5 days in divided
doses. This dose may repeated at 2-4 week intervals.
19 3.0. AIM AND OBJECTIVE
The number of drugs and drug formulations introduced into the market
has been increasing at an alarming rate. These drugs or formulations may be
either new entities in the market or partial structural modifications of the
existing drug or novel dosage forms.
Most of the pharmaceutical industries rely upon quantitative chemical
analysis to ensure that the raw material used and the final product thus obtained
meets certain specifications and to determine how much of each component
present in the final product.
Standard analytical procedures for these drugs or formulations may not
be available to develop newer analytical methods which are accurate, precise,
specific, linear, simple and rapid.
Moreover in the early part of the century only colorimetric and
spectrophotometric methods were used for drug analysis due to reasons of
economy and easy availability. These methods, however, are used to lesser
extent today because they lack specificity, sensitivity and accuracy. The
modern method of choice of assays is
High – Pressure Liquid Chromatography (HPLC) which is a powerful and
rugged method. It is also extremely precise, accurate, sensitive, specific, linear
and rapid.
The objective of the present research is to develop and validate a
precise, accurate and robust method for the estimation of
Cyclophosphamide from tablet dosage form and the extensive literature survey
20
estimation of Cyclophosphamide i.e., in combination with other drugs.
However, there is no method reported for individual estimation in solid dosage
form.
3.0. PLAN OF WORK
The plan of the work for the aimed study was designed as follows:
1.4. Method development and optimization of chromatographic
conditions
Selection of wavelength
Selection of initial separation conditions
Nature of the stationary phase
Nature of the mobile phase (pH, peak modifier, solvent strength,
ratio and flow rate)
Sensitivity
1.5. Validation of developed HPLC method (Acc. to ICH guidelines)
The method developed were also proposed to validate using the
various validation performance parameters such as,
Selectivity/specificity
21
Accuracy
Precision (repeatability and reproducibility)
Limit of detection (LOD)/ Limit of quantification (LOQ)
Robustness
22
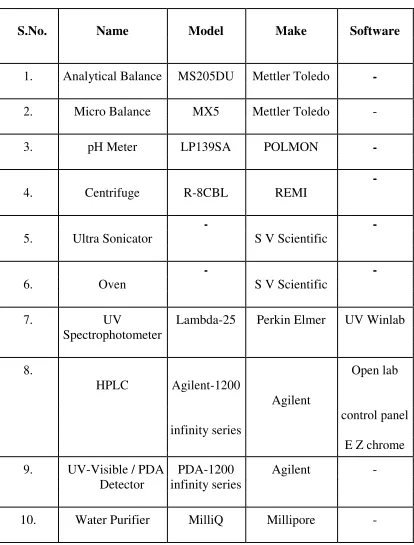
1.0. MATERIALS REQUIRED
[image:27.595.110.524.162.707.2]1.1. Instruments used
Table 1: Instruments Used During the Method Development
S.No. Name Model Make Software
1. Analytical Balance MS205DU Mettler Toledo
-2. Micro Balance MX5 Mettler Toledo -
3. pH Meter LP139SA POLMON
-4. Centrifuge R-8CBL REMI
-5. Ultra Sonicator
-S V -Scientific
-6. Oven
-S V -Scientific
-7. UV Lambda-25 Perkin Elmer UV Winlab
Spectrophotometer
8.
HPLC Agilent-1200
Agilent
Open lab
control panel infinity series
E Z chrome
9. UV-Visible / PDA PDA-1200 Agilent -
Detector infinity series
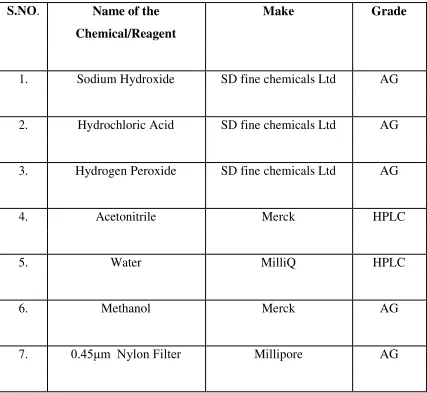
23 5.2. Chemicals used
Table 2: Chemicals/Reagents Used During the Method Development
S.NO. Name of the Make Grade
Chemical/Reagent
1. Sodium Hydroxide SD fine chemicals Ltd AG
2. Hydrochloric Acid SD fine chemicals Ltd AG
3. Hydrogen Peroxide SD fine chemicals Ltd AG
4. Acetonitrile Merck HPLC
5. Water MilliQ HPLC
6. Methanol Merck AG
24
For the determination of Cyclophosphamide in tablet dosage form by
RP-HPLC method the following Standard drug was used as a reference standard.
S. No. Name Specification purity % Gift sample
1 Cyclophosphamide 99.7 Celon Labs.
For the determination of Cyclophosphamide in tablet dosage form by RP-
HPLC method the following marketed formulation was used.
Brand name Content Manufacturing company
25
1.6. EXPERIMENTAL INVESTIGATION
1.7. Method development of cyclophosphamide
A new RP-HPLC method was developed for the determination of
Cyclophosphamide. The HPLC method was then validated to indicate that the
analytical procedure used is suitable for intended use by using various
parameters like specificity, linearity, accuracy, precision, robustness, and
system suitability.
6.1.1. Selection of Initial Conditions for Method Development
[image:30.595.168.466.461.689.2]a. Determination of Solubility of Drug
Table 3: Solubility Analysis of drug.
Solvent Solubility
Water
Methanol Sparingly soluble
Acetonitrile
26
b. Determination of Absorption Maxima by PDA detector
Preparation of Diluent
Water: Acetonitrile (50:50)
Procedure
Accurately weighed and transferred about 50 mg of
Cyclophosphamide into a 50 ml volumetric flask, added to it about 75 ml of
diluent and sonicated to dissolve and diluted up to the mark with diluent and
mixed well. Further diluted 5 ml of the above solution to 50 ml with diluent
and mixed. (Concentration of Cyclophosphamide is about 0.1mg/ml). The PDA
spectrum was shown in figure 2.
c. Choice of instrument: High performance liquid chromatography.
Preparation of Cyclophosphamide stock solution
50mg of Cyclophosphamide was weighed and taken into clean 50mL
dry volumetric flask and added small quantity of diluent for solubilising the
drug and sonicated for about 10min and finally make up the solution with
diluent.
Preparation of working solution
Form the stock solution transferred 5 ml of the solution into a clean and
dry 50mL volumetric flask and added small quantity of diluent and sonicated
27 6.1.2 Method development trials
Trail-1
Mobile phase preparation
The mobile phase was prepared by mixing water and acetonitrile in the
ratio of 50:50. Then it was filtered and degassed.
Chromatographic conditions
Standard solution of Cyclophosphamide was loaded in the vial, injected
and run for 15min. The HPLC parameters were set in the
method as follows. The trial plot was shown in figure 3.
Column : C18 100×4.6mm; 3.5µm
Column temperature : 250C
Flow rate : 0.5mL/min
Injection volume : 20µL
28 Trail-2
Mobile phase preparation
The mobile phase was prepared by mixing water and acetonitrile in the
ratio of 60:40. Then it was filtered and degassed. The trial plot was shown in
figure 4.
Chromatographic conditions
: C18 100×4.6mm; 3.5µm
Column temperature : 250C
Flow rate : 0.5mL/min
Injection volume : 20µL
29 Trail-3\\\
Mobile phase preparation
The mobile phase was prepared by mixing water and acetonitrile in the ratio of
75:35. Then it was filtered and degassed. The trial plot was shown in figure 5.
Chromatographic conditions
: C18 100×4.6mm; 3.5µm
Column temperature : 250C
Flow rate : 0.5mL/min
Injection volume : 20µL
Wave length : 195nm
Conclusion: After trails it was concluded that the mobile phase whichis
30 Trail-4 (Optimized)
Preparation of mobile phase
Mix water and Acetonitrile in ratio of 70:30 (v/v) and degas and filter
through 0.45 micron membrane filter.
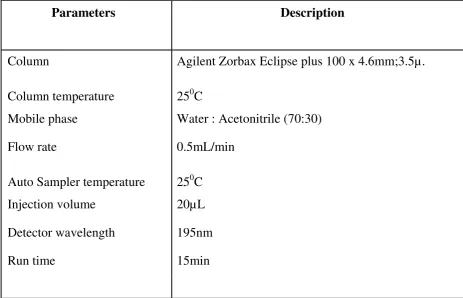
31 Chromatographic conditions
The HPLC parameters were set in the method as per table 4.The
[image:36.595.84.548.305.603.2]optimized plot was shown in figure 6
Table 4: Chromatographic conditions
Parameters Description
Column Agilent Zorbax Eclipse plus 100 x 4.6mm;3.5µ.
Column temperature 250C
Mobile phase Water : Acetonitrile (70:30)
Flow rate 0.5mL/min
Auto Sampler temperature 250C
Injection volume 20µL
Detector wavelength 195nm
32 6.2 Analytical method validation
Validation of an analytical method is a process to establish by laboratory
studies that the performance characteristic of the method meets the requirements
for the intended analytical application. Performance characteristics are
expressed in terms of analytical parameters. The proposed method was validated
according to ICH guidelines.6.2.1 Validation parameters
i. Specificity/forced degradation studies
Specificity is the ability to assess unequivocally the analyte in the presence of
components which may be expected to be present.
Lack of specificity of an individual analytical procedure may be compensated by other
supporting analytical procedures.
Cyclophosphamide Identification: Solutions of standard and Sample were prepared as
per test method and injected into the chromatographic system. The specificity plots were
shown in figure 7 and 8.
Acceptance criteria: Chromatogram of Standard and sample should be identical with
near/same Retention time.
Blank interference: A study to establish the interference, blank detection was
conducted. Mobile phase was injected as per the test method. . The specificity plot was
shown in figure 7.
Acceptance criteria: Chromatogram of blank did not show any peak at the retention
33 Forced degradation studies
Degradation studies were carried out as per ICH guidelines. The objective of the
study was to find out the degradation products, which in turn help in the establishment of
degradation pathways and the intrinsic stability of drug molecule. In order to check the
selectivity
the proposed method, degradation studies were carried out by using acidic, basic,
oxidative, photo and thermal conditions.
Intentional degradation was attempted to stress conditions of acidic (0.1N HCl),
basic/alkali (0.1N NaOH), oxidative degradation
(5%H2O2) and thermal treatment (heated at 800c) to evaluate the ability of the proposed
method to separate cyclophosphamide from its degradation products.
A. Acidic degradation
Forced degradation in acidic media was performed by taking weighed powdered
sample equivalent to 50mg, in to 50mL volumetric flask. 10mL of 0.1N Hcl was added
and refluxed at 700C/30min. Then 10mL of 0.1N NaOH was added and volume was
made up to mark with diluent. 5 to 50mL of further dilution was made to get 0.1mg/mL
34 B. Alkali degradation
Forced degradation in alkali media was performed by taking weighed powdered
sample equivalent to 50mg, in to 50mL volumetric flask. 10mL of 0.1N NaOH was
added and refluxed at 700C/30min. Then 10mL of 0.1N Hcl was added and volume was
made up to mark with diluent. 5 to 50mL of further dilution was made to get 0.1mg/mL
of cyclophosphamide and inject the sample.
C. Oxidative degradation
Forced oxidative degradation was performed by taking weighed powdered sample
equivalent to 50mg, in to 50mL volumetric flask. 10mL of 5% H2O2 was added and
refluxed at 700C/30min. Then volume was made up to mark with diluent. 5 to 50mL of
further dilution was made to get 0.1mg/mL of cyclophosphamide and inject the sample.
D. Thermal Degradation
Cyclophosphamide pure drug was exposed to a controlled temperature oven NMT
80ºc for half an hr. At sampling time accurately weighed powdered sample equivalent to
50mg, in to 50mL volumetric flask. Then volume was made up to mark with diluent. 5 to
50mL of further dilution was made to get 0.1mg/mL of cyclophosphamide and inject the
sample.
35 Preparation of solutions for linearity
From the stock solution transferred 3.5ml, 4.0 ml, 4.5 ml, 5.0 ml, 5.5 ml, 6.0 ml,
of Cyclophosphamide each into a series of 50 ml volumetric flasks and add a few ml of
diluent and sonicated for 15 min and later volume was made up with diluent. The final
concentrations for linearity of Cyclophosphamide were 70-120µg/mL.
The obtained value is y= 20405x - 244.681, R2 =0.999. The results were shown in figures
14-19 and tabulated in the table no: 7.
iii. Accuracy
Preparation of solutions for Accuracy
From the stock solution transferred 4.0, 5.0 and 6.0 ml of solutions into 3 separate
50 ml volumetric flasks and dilute each of the flasks to 50 ml with mobile phase to get the
desired concentrations of 80, 100 &120 mcg/mL respectively.These solutions were
injected in 3 replicates. The percentage recovery was calculated from the data obtained
and the results were shown in figures 20-28 and tabulated in the table no: 8.
iv. Precision
The precision studies were studied using six replicate measurements at
0.1mg/mL. Statistical evaluation revealed that relative standard deviation of drug at
different concentration for six injections was less than 2.0. The results were mentioned in
the table no-9.Intermediate precision was established for the same analytical samples of
concentration 0.1mg/mL. The typical variation was included like interday analysis.
Statistical evaluation revealed that relative standard deviation of drug at different
concentration for six injections was less than 2.0. The results were mentioned in the table
36 v. Limit of detection
50mg of cyclophosphamide was weighed and make up to 50mL with mobile
phase. From the above solution different concentrations of solutions were prepared as
stated above i.e like linearity and the solutions were run as per chromatographic
conditions. Based on the standard deviation of response and slope the LOD value of drug
was calculated.
vi. Limit of quantification
50mg of cyclophosphamide was weighed and make up to 50mL with mobile
phase. From the above solution different concentrations of solutions were prepared as
stated above i.e like linearity and the solutions were run as per chromatographic
conditions. Based on the standard deviation of response and slope the LOQ value of drug
was calculated.
vii. Robustness
The robustness of an analytical procedure was tested by measuring its capacity to
remain unaffected by small, but deliberate variations in the method parameters and
provides an indication of its reliability during the normal use. For this study flow,
mobile-phase composition, column parameters were changed. The results were shown in figures
41-45 and tabulated in the table.no:11-13.
viii. System Suitability
50mg of cyclophosphamide was weighed and taken into clean volumetric flask
and added small quantity of mobile phase for solubilising the drug and sonicated for
about 10min and finally make up the solution with mobile phase Pipette out 5ml of
37
mobile phase to obtain concentration of 0.1mg/mL. This Standard solution was injected
and the system suitability parameters are calculated and tabulated in the table no: 14.
6.3 Assay for Marketed formulation
Preparation of standard solution
50mg of cyclophosphamide was weighed and taken into clean volumetric flask
and added small quantity of mobile phase for solubilising the drug and sonicated for
about 10min and finally make up the solution with mobile phase Pipette out 5ml of above
solution was transferred into 50ml volumetric flask and make up the volume with mobile
phase to obtain concentration of 0.1mg/mL.
Preparation of sample solution
Cytoxan tablets; claimed to contain 50mg of Cyclophosphamide was used in
analysis. A total of 5 tablets were accurately weighed and powdered in a mortar. An
amount equivalent to 50mg of Cyclophosphamide was taken and dissolved in some
amount of diluent and sonicated for 20mins and made upto 50ml in
50ml volumetric flask. The solution was transferred through a Whatmann No.1 filter
paper. Further 5ml of the above solution was pipetted out into a 50ml volumetric flask
and the volume was made up to 50ml with diluent(mobile phase) to obtain a
concentration of 0.1mg/mL.
38
The prepared standard and sample solutions were injected in the HPLC by setting
the optimized chromatographic conditions. The peak areas of standard and sample were
determined. These values are
substituted in the following formula to get the percentage purity of the marketed
39
7.0. RESULTS AND DISCUSSION
7.1. Results for method development trials
Absorption maxima
Figure 2:PDA spectrumof Cyclophosphamide
Trial no. 1
40 Discussion
Peak was eluted early & Some Placebo peaks were appeared. so the
mobile phase has been changed for next trail.
Trial no.2
Figure 4:HPLC chromatogramof trial2
Discussion
Placebo peaks were still appeared & Base line was not proper. so
41
Trial no. 3
Figure 5:HPLC chromatogramof trial3
Discussion
Placebo peaks were reduced but base line was not proper. so again
gone for changing of mobile phase composition.
Trial no.4 (Optimized)
42 Peak
Cyclophosphami
de
Retention
Time
5.600
Area
Area
%
2050439
100.00
Theoretica
l
plates(USP
)
10385
Asymmetr
y
1.11
Discussion
The separation of analyte peak was achieved with good system
suitability parameters. So these conditions are optimized for
43
7.2. Results for method development
The optimized chromatographic conditions for the method
development and validation of Cyclophosphamide is as follows
Optimizedchromatographic conditions ofCyclophosphamide
Parameters Description
Column
Column temperature
Mobile phase
Flow rate
Sample temperature
Agilent Zorbax Eclipse plus 100 x 4.6mm;3.5µ.
250C
Water : Acetonitrile (70:30)
0.5mL/min
25ºC
Discussion
The RP-HPLC method for Cyclophosphamide was optimized with the
mobile phase consisting of Water & Acetonitrile (70:30). The detection
was carried out at wavelength 195nm with a retention time of 5.6 min
44
7.3. Results for Analytical method validation
Validation of an analytical method is process to establish that
the performance characteristics of the developed method meet the
requirements of the intended analytical application. Typical analytical
parameters used in assay validation are:
a) Specificity
b) Linearity and Range
c) Accuracy
d) Precision
Repeatability
Intermediate precision
e) Limit of Detection (LOD)
f) Limit of Quantification (LOQ)
g) Robustness
45
a) SPECIFICITY
Figure 7:HPLC Chromatogramof blank
46
Peak results
Peak Cyclophosphamide
RetentionTime 5.587
Area 2039272
Area% 100.00
Theoreticalplates
(USP)
10383
Asymmetry 1.12
Degradation Studies
Figure 9: HPLC chromatogramof aciddegradation
47
Figure 11: HPLCchromatogramof heatdegradation
Figure 12: HPLC chromatogramof peroxidedegradation
Table6:Forced degradationresultsforCyclophosphamide
Mechanismof degradation Observation
Acid(0.1NHCl 30min reflux) No interference at analyte peak
Base(1M NaOH 30 min reflux) No interference at analyte peak
Heat at 500C for 1hr No interference at analyte peak
Peroxide(5% H2O2 30 min reflux)
48 Discussion
The HPLC chromatogram of blank does not contain any peaks,
HPLC chromatogram of standard and sample containing
Cyclophosphamide shows peaks at the same retention times. The HPLC
chromatograms of degraded products show no interference at the analyte
peaks.
b) LINEARITY & RANGE
The linearity of a method is its ability to obtain test results that
are directly proportional to the sample concentration over a given range.
The peak area and concentration were plotted to get a standard
calibration curve. The correlation co-efficient and regression co-efficient
49
Table7:Linearityresults of Cyclophosphamide
Sl no
Concentration
mcg/ml.
Area
1 70 1427291
2 80 1627283
3 90 1840368
4 100 2048163
5 110 2239534
6 120 2447824
Slope 20407.33
y-intercept -244.681
R2 value 0.999
Linearity of Cyclophosphamide
50
2500000
2000000
1500000
1000000
500000
y = 20405x R² = 0.999
Area
Linear (Area)
0 50 100 150
Concentration in µg/ml
Figure 13: Linearity plotof Cyclophosphamide
Figure14: HPLCchromatogram of Cyclophosphamidelinearity70%
Peak results
Peak Retention Time Area Theoretical
plates
Asymmetry
51
Figure15: HPLCChromatogram of Cyclophosphamide linearity80%
Peak results
Peak Retention Time Area Theoretical
plates
Asymmetry
Cyclophosphamide 5.580 1427283 10311 1.16
Figure16: HPLCchromatogram of Cyclophosphamide linearity 90%
Peak results
Peak Retention Time Area Theoretical
plates
Asymmetry
52
Figure 17: HPLC chromatogram of Cyclophosphamidelinearity 100%
Peak results
Peak Retention Time Area Theoretical
plates
Asymmetry
Cyclophosphamide 5.587 2048163 10349 1.13
Figure 18: HPLC chromatogram of Cyclophosphamidelinearity 110%
Peak results
Peak Retention Time Area Theoretical
plates (USP)
Asymmetry
53
Figure 19: HPLC chromatogram of Cyclophosphamidelinearity 120%
Peak results
Peak Retention Time Area Theoretical
plates (USP)
Asymmetry
Cyclophosphamide 5.592 2647825 8982 1.11
Discussion
Cyclophosphamide was found to be linear over the range of 70 to
120µg/mL. R2 value for calibration plot of Cyclophosphamide was found
to be 0.999
c) ACCURACY
The accuracy of a method is the closeness of the measured
value to the true value for the sample. Accuracy is usually determined
54
Table 8: Accuracyresults forCyclophosphamide
Spiked Level Peak Area Amount added (mcg/ml) Amountfound (mcg/ml) % Mean recovery
80% Prep-1 1457483 80.4 79.5 98.88
80% Prep-2 1469380 80.6 79.3 98.38
80% Prep-3 1465411 80.2 79.4 99.00
100% Prep-1 2035189 99.6 99.2 99.68
100% Prep-2 2045174 99.8 99.2 99.39
100% Prep-3 2053232 99.6 99.3 99.69
120% Prep-1 2654239 120 119.7 99.75
120% Prep-2 2665314 119.8 119.2 99.49
120% Prep-3 2674119 120 119.3 99.41
Mean 99.30
Standard deviation 0.46
%RSD 0.46
55
Peak results
Peak Retention Time Area Theoretical
plates
Asymmetry
Cyclophosphamide 5.580 1457483 9730 1.15
Figure 21: HPLC chromatogramof Cyclophosphamide foraccuracy 80%
Peak results
Peak Retention Time Area Theoretical
plates
Asymmetry
Cyclophosphamide 5.573 1469380 9782 1.16
Figure 22:HPLC chromatogramof Cyclophosphamidefor accuracy80%
Peak results
Peak Retention Time Area Theoretical
plates
Asymmetry
56
Figure 23: HPLCchromatogramof Cyclophosphamide foraccuracy100%
Peak results
Peak Retention Time Area Theoretical
plates
Asymmetry
Cyclophosphamid 5.585 2035189 9761 1.17
Figure 24: HPLCchromatogramof Cyclophosphamide foraccuracy100%
Peak results
Peak Retention Time Area Theoretical
plates
Asymmetry
57
Figure 25: HPLC chromatogramof Cyclophosphamide foraccuracy 100%
Peak results
Peak Retention Time Area Theoretical
plates
Asymmetry
Cyclophosphamide 5.587 2053232 9950 1.14
Figure 26: HPLCchromatogramof Cyclophosphamide foraccuracy120%
Peak results
Peak Retention Time Area Theoretical
plates
Asymmetry
58
Figure 27: HPLCchromatogramof Cyclophosphamide foraccuracy120%
Peak results
Peak Retention Time Area Theoretical
plates
Asymmetry
Cyclophosphamide 5.600 2665314 9604 1.16
Figure 28: HPLCchromatogramof Cyclophosphamide foraccuracy120%
Peak results
Peak Retention Time Area Theoretical
plates
Asymmetry
Cyclophosphamide 5.607 2674119 9542 1.15
Discussion
The percentage recovery of Cyclophosphamide was found to be
98.75%, 99.58% and 99.55% for accuracy 80%, 100% and 120%
samples respectively. The %RSD of the samples was found to be less
59
d) PRECISION
Repeatability
The Repeatability studies were studied by six replicate
measurements at 0.1mg/mL for Cyclophosphamide
Table 9:Precisionresultsof Cyclophosphamide
Drug Conc. S.No Area
0.1mg/mL
Inj-1 2045164
Inj-2 2044425
Inj-3 2042132
Inj-4 2053214
Inj-5 2048155
Inj-6 2051452
Average 2047424
STDEV 4298.60
RSD 0.21
Discussion: The % RSD value indicates a good degree of precision
60
Figure 29: HPLC chromatogramof Cyclophosphamide forrepeatability
(inj-1)
Peak results
Peak Retention Time Area Theoretical
plates
Asymmetry
Cyclophosphamide 5.587 2045164 9975 1.18
Figure30: HPLC chromatogramof Cyclophosphamidefor
61
Peak results
Peak Retention Time Area Theoretical
plates
Asymmetry
Cyclophosphamide 5.585 2044425 9866 1.16
Figure31: HPLC chromatogramof Cyclophosphamidefor
repeatability(inj-3)
Peak results
Peak Retention Time Area Theoretical
plates
Asymmetry
Cyclophosphamide 5.584 2042132 9829 1.12
Figure32: HPLC chromatogramofCyclophosphamide for
62
Peak results
Peak Retention Time Area Theoretical
plates
Asymmetry
Cyclophosphamide 5.580 2053214 9587 1.13
Figure33: HPLCchromatogramof Cyclophosphamide for
repeatability(inj-5)
Peak results
Peak Retention Time Area Theoretical
plates
Asymmetry
Cyclophosphamide 5.583 2048155 9615 1.18
Figure34: HPLCchromatogramof Cyclophosphamide for
63
Peak results
Peak Retention Time Area Theoretical
plates
Asymmetry
Cyclophosphamide 5.585 2051452 9645 1.17
termediate precision
The Intermediate precision studies were studied by six replicate
measurements at 0.1mg/mL for Cyclophosphamide.
Table 10: IntermediatePrecision resultsof Cyclophosphamide.
Drug Conc. S.No Area
0.1mg/mL
Inj-1 2056122
Inj-2 2048131
Inj-3 2045148
Inj-4 2055172
Inj-5 2058188
Inj-6 2061102
Average 2053977
STDEV 6109.89
RSD 0.29
Discussion: The % RSD value indicates a good degree of precision
64
Figure 35: HPLCchromatogramof Cyclophosphamide forintermediate
precision (inj-1)
Peak results
Peak Retention Time Area Theoretical
plates
Asymmetry
Cyclophosphamide 5.601 2056122 9029 1.15
Figure 36: HPLCchromatogramof Cyclophosphamide forintermediate
precision (inj-2)
Peak results
Peak Retention Time Area Theoretical
plates
Asymmetry
65
Figure 37: HPLCchromatogramof Cyclophosphamide forintermediate
precision (inj-3)
Peak results
Peak Retention Time Area Theoretical
plates
Asymmetry
Cyclophosphamide 5.598 2045148 9437 1.14
Figure 38: HPLCchromatogramof Cyclophosphamide forintermediate
precision (inj-4)
Peak results
Peak
Cyclophosphamide
Retention Time
5.593
Area
2055172
Theoretical plates (USP)
9520
Asymmetry
66
Figure 39: HPLC chromatogramofCyclophosphamide forintermediate
precision (inj-5)
Peak results
Peak Retention Time Area Theoretical
plates
Asymmetry
Cyclophosphamide 5.595 2058188 9643 1.16
Figure 40: HPLCchromatogram ofCyclophosphamide forintermediate
precision (inj-6)
Peak results
Peak Retention Time Area Theoretical
plates
Asymmetry
67 Discussion
The %relative standard deviation of Cyclophosphamide for
repeatability was found to be 0.21.
The %relative standard deviation of Cyclophosphamide for
intermediate precision was found to be 0.29.
Hence the % RSD values indicate a good degree of precision
within the specified range.
e) LIMIT OF DETECTION
LOD was calculated by using standard deviation and slope values
obtained from calibration curve.
Discussion
The LOD value of Cyclophosphamide was found to be 0.131µg/mL.
f) LIMIT OF QUANTIFICATION
LOQ was calculated by using standard deviation and slope values
obtained from calibration curve.
Discussion
68
g) ROBUSTNESS
To establish the robustness of the HPLC method employed for
analysis of assay of Cyclophosphamide, the method was
challenged for various parameters like effect of mobile phase flow,
changes in mobile phase composition and change in column. The
observations in different conditions are tabulated below:
Table-11: Effect of mobile phase flow ( 20% of Actual flow)
Actual flow
(0.5 ml/min)
20% Less flow
(0.4 ml/min)
20% Excess flow
(0.6 ml/min)
Retention time (min) 5.587 5.610 5.577
Theoretical Plates 10383 9075 8878
Tailing Factor 1.12 1.09 1.08
Table-12: Effect of changes in mobile phase composition
( 1% Organic solvent)
Actual MP 1% Excess Organic solvent 1% Less Organicsolvent
Retention time (min) 5.587 5.450 5.610
Theoretical Plates 10383 8917 6398
69
Table-13: Column to column variation
LCC11-003 LCC11-002
Retention time (min) 5.587 5.595
Theoretical Plates 10383 9523
Tailing Factor 1.12 1.05
Figure 41: HPLC chromatogramof Cyclophosphamide forrobustness(flow
1)
Peak results
Peak Retention Time Area Theoretical
plates
Asymmetry
70
Figure 42: HPLC chromatogramof Cyclophosphamideforrobustness(flow
2)
Peak results
Peak Retention Time Area Theoretical
plates
Asymmetry
Cyclophosphamide 5.577 2066717 8878 1.08
Figure 43: HPLC chromatogramof Cyclophosphamide forrobustness
(1%excessorganicsolvent)
71
Peak Retention Time Area Theoretical
plates
Asymmetry
Cyclophosphamid 5.450 2076737 8917 1.14
Figure 44: HPLC chromatogramof Cyclophosphamideforrobustness
(1%less organicsolvent)
Peak results
Peak Retention Time Area Theoretical
plates
Asymmetry
Cyclophosphamide 5.610 2008119 6398 1.15
Figure 45: HPLC chromatogramof Cyclophosphamideforrobustness
72
Peak results
Peak Retention Time Area Theoretical
plates
Asymmetry
Cyclophosphamide 5.595 2055288 9523 1.05
Discussion:
The robustness was tested by changing the flow rate, Mobile
phase composition and column. And it was found that the system
suitability parameters were within the acceptance criteria.
h) SYSTEMSUITABILITY
Table14: systemsuitability data of Cyclophosphamide
S.no. System Suitability
Parameter
Observations Proposed Acceptance
Criteria
1. % RSD for Five
replicate injections of
analyte peak in 0.2
Should be not more
than 2.0%
2. Tailing factor for
analyte peak in
standard solution
1.11 Should be not more
than 2.0
3. Plate count for analyte
peak in standard
solution
9176 Should be not less than
73
Figure 46: HPLCchromatogramsof Cyclophosphamide
74
PeakResults of Cyclophosphamide Standard
S.NO
Cyclophosphamide
Area Asymmetry Plate
Count
1 2050439 1.11 10383
2 2051086 1.14 10210
3 2051529 1.17 9848
4 2051650 1.14 9788
5 2051710 1.15 9785
Mean 2051283
%RSD 0.2
Discussion
The all system suitability parameters are within the acceptance
criteria
7.4. Assay for marketed formulation
PeakresultsforStandard Solutionof Cyclophosphamide
(Assay-Development)
Cyclophosphamide
S.No RT (min) Area Plate
Count
Tailing
1 5.600 2050439 10383 1.11
2 5.595 2051086 10210 1.14
3 5.593 2051529 9848 1.17
4 5.595 2051650 9788 1.14
75
Table15: Peakresults forSample Solutionof CP (AssayDevelopment)
S.no Tablet weight in mg 105.5
1 Area(injection-1) 2047489
2 Area(injection-2) 2048570
Average area 2048029
Assay 99.5
Figure 47: HPLC Chromatogramsforsample solutions
(Assay-Development)
Peak results
Peak Retention Time Area Theoretical
plates
Asymmetry
Cyclophosphamide 5.590 2047489 10264 1.14
Discussion
The percentage purity of Cyclophosphamide was found to be
99.5. So this method was suitable for analysing the marketed
76
8.0.
SUMMARY
AND
CONCLUSION
8.1. SUMMARY
Chapter 1 Opens with introduction giving a brief account of various
aspects like chromatography, analytical method development
and validation,
Chapter 2 Explains about the drug profile of drug and literature review
of various papers regarding about the drug. The
chromatographic conditions from the papers were considered
for developing new analytical method for
Cyclophosphamideby RP-HPLC.
Chapter 3 Explains the aim & objective of present investigation adopted
for selected drugs.
Chapter 4 Explains about the plan of the work.
Chapter 5 Contains the materials used for the study
Chapter6 Containsexperimental investigation regarding theinformation
about the chromatographic conditions of various method development trials and procedures for analytical method
77
Chapter7 Consists of results obtained and the discussions about the results indicating the acceptance of the results. Tables of the results obtained for validation have been included below
Chapter 8 Contains the summary of the research and conclusion.
Chapter 9 Contains the references form which information of the titled
78
CONCLUSION
The present research is to developed and validated a precise, accurate and
robust method for the estimation of Cyclophosphamide from tablet dosage form and
the extensive literature survey carried out revealed that several methods have been
reported for simultaneous estimation of Cyclophosphamide i.e., in combination with
other drugs. However, there is no method reported for individual estimation in solid
79 9.0. Bibliography
1. Dougles Skoog. Analytical Chemistry, 8th edition, Saunders College
Publishers, Philadelphia, 1996, pp.1-15.
2. Brain WW and Derek Cooper. Samples and Standards, Analytical
Chemistry by Open learning. John Wiley and Sons, London, 1991, pp2-5.
3. Jeffery and Basselt GH. Vogel’s Text Book of Quantitative Chemical
Analysis, 5th edition, 1991, pp.217-235.
4. Robert Braun D. Introduction to Instrumental Analysis, 1st edition,
McGraw Hill Book Company, 1987, pp.1-13.
5. Snyder L R, Joseph Kirkland J and Joseph Glajch L. Practical HPLC
method development, 1997, 2nd edition, pp.1-14.
6. James Robinson W, Marcel Dekker. Undergraduate Instrumental
Analysis. 5thedition., 1997, pp.584-589.
7. Corners K. A., Textbook of Pharmaceutical Analysis, A Wiley Interscience
80
8. Yuri Kazakevich, Rosario Lobrutto, editors. HPLC for pharmaceutical
Scientist: Wiley-interscienceJohn Wiley & Sons Inc,2007, pp.10-14.
9. Wagrowski-Diehl D.M, Grumbach E.S, Iraneta P.C, “Development of New
HPLC Columns for the Retention and Separation of Highly Polar
Compounds”, presentation at Pittsburgh Conference 2002.
10.Snyder L.R., Kirkland J.J. and Glajch L.J., Practical HPLC Method
Development, John Wiley and Sons, INC.,1997, 2ndEdn. pp.98-102
11.ICH-Guidelines Q2A, Validation of Analytical Procedures: Definition and
terminology Geneva, Switzerland ,1995,pp.68-76.
12.Mahamood Ahmad, Muhammad Usman & Arshad Mahmood. A fast and
simple HPLC-UV method for simultaneous determination of three
anticancer agents in plasma of breast cancer patients and ts application
to clinical pharmacokinetics from African journal of pharmacy and
81
13.Isarita Martins, JefersonO.Souza, Alexandre Giusti-Paiua. Simultaneous
determination of Cyclophosphamide and Ifosfamide in plasma using SPE-
HPLC-UV method. Lat. Am. J.Pharm.2009, Vol-28, Issue-1; pp.41-46.
14.Rodney.R, Larson.M, Khazaeliand.B, Kenneth Dillon.H., Development of
an HPLC Method for Simultaneous Analysis of Five Antineoplastic Agents.
Applied Occupational and Environmental Hygiene, 2003, Vol-18, Issue-2,
pp.109-119.
15.Abu Rustum.M, Norman Hoffman.E. Determination of cyclophosphamide
in whole blood and plasma by reversed-phase high-performance liquid
chromatography. Journal of chromatography, 1987, Vol-422, pp.125-134.
16.Kensler T. T, Behme R. J and Brooke D. High-performance liquid
chromatographic analysis of Cyclophosphamide, Journal of
Pharmaceutical Sciences, 1979, Vol-68, Issue-2, pp.172–174.
17.Nagulu malothu, Udaykiran veldandi, Ramakrishna devarakonda.
Development of rapid and simple HPLC method for the determination of
cyclophospamide in human serum. Asian Journal of Pharmaceutical and
82
18.LI Su-hua, YIN Hong-bin. The development of HPLC method for
determining the concentration of Cyclophosphamide in the plasma of
mice. Laboratory of Forest Disas