DIRECT SHARE OWNERSHIP AS A
DIFFUSION PHENOMENON
Lujer Santacruz
School of Accounting, Economics and Finance Faculty of Business
University of Southern Queensland1
Abstract
In this paper, the incidence of share ownership in terms of percentage of the Australian adult population holding direct shares are analysed through the lens of the theory of diffusion of innovations. A mixed influence diffusion model is proposed having predictive variables namely IPO activity and recent returns that are posited to affect the extent of external and internal influences on the rate of adoption of the practice of direct share ownership. Limitations of the research data as well as inherent weaknesses of the diffusion model due to its simplifying assumptions are discussed along with future opportunities for research on the subject area.
Fields of research: finance, investments, diffusion of innovation
Introduction
The objective of this paper is to characterise direct share ownership in Australia through the lens of the theory of diffusion of innovations2.
The incidence of direct share ownership in Australia has grown dramatically since the amalgamation of the six State stock exchanges into the Australian Stock Exchange (ASX) in April 1987. In recent years, Australia has recorded one of the highest penetration rates of share ownership among its population when compared to other nations as shown in Table 1. Understanding the factors that may have contributed to this high rate of direct share ownership would have applications (e.g. marketing of IPOs) not only for the Australian context but for other country contexts as well.
1
Corresponding author: Lujer Santacruz, School of Accounting Economics and Finance, Faculty of Business, University of Southern Queensland, Toowoomba QLD 4350, Australia.
Table 1: International comparison of share ownership, adapted (ASX 2004).
The present paper utilised the data gathered through the comprehensive surveys that ASX has been commissioning since 1988. The observed incidences of direct share ownership from these surveys are related to possible contributing factors, both qualitatively and quantitatively using the principles of innovation diffusion. The results of this paper have implications for understanding the spread of direct share ownership among the population and the derived model could possibly be applied to other financial products and services as well.
Literature Review and Research Theoretical Framework
The present paper aims to characterise direct share ownership as an innovation diffusion phenomenon. It taps into the wealth of knowledge on the theory of diffusion of innovations which is a well researched area.
through a social system. Share ownership falls under the category of an innovation as it presents itself as a new idea or practice for those who have not experienced it previously.
The following characteristics of an innovation have been defined (Rogers 1995): (1) relative advantage or the degree to which an innovation is perceived as better than what it is superseding, (2) compatibility or the degree to which an innovation is perceived as being consistent with the needs of potential adopters, (3) non-complexity or the degree to which an innovation is perceived as easy to understand, (4) trialability or the degree to which an innovation may be experimented with on a limited basis and (5) observability or the degree to which the positive results of an innovation are visible to others. The presence of these characteristics positively influences the rate of adoption of an innovation.
Adopters can be placed under several categories on the basis of innovativeness (Rogers 1995) but there are basically two main groups: the innovators or those who adopt an idea independently of others and the imitators who are largely influenced by others. This grouping also serves as the premise for the main categories of quantitative models of innovation of diffusion namely the external influence model, the internal influence model and the mixed influence model (Mahajan & Peterson 1985).
The external influence model is represented by the following equation defining the rate of diffusion at time : t
[
( )]
(Equation 1)) (
t N N p dt
t
dN = −
where N(t) is the cumulative number of adopters at time t, N is the total number of potential adopters and is the coefficient of innovation. This model posits that the rate of diffusion at any time is a function of the difference between the total number of potential adopters and the number of previous adopters at that time, or in other words the potential new adopters. The coefficient of innovation can be interpreted as an index of an external influence that applies on the potential adopters, which means the external influence is anything other than a prior adoption. Conceptually, it can be considered as representing the effect of a vertical channel of communication as the model does not attribute the diffusion to horizontal interaction between prior and potential adopters.
The internal influence model is represented by the following equation defining the rate of diffusion at time : t
[
( )]
) ( ) (
t N N t qN dt
t dN
−
= (Equation 2)
where is the coefficient of imitation. In the internal influence model, the rate of diffusion is expressed as a function of horizontal interaction between prior and potential adopters. The coefficient of imitation can be interpreted as an index of the internal interaction within the social system.
q
The mixed influence model is represented by the following equation defining the rate of diffusion at time : t
[
( )]
( )[
( )]
) (
t N N t qN t N N p dt
t
dN = − + −
(Equation 3)
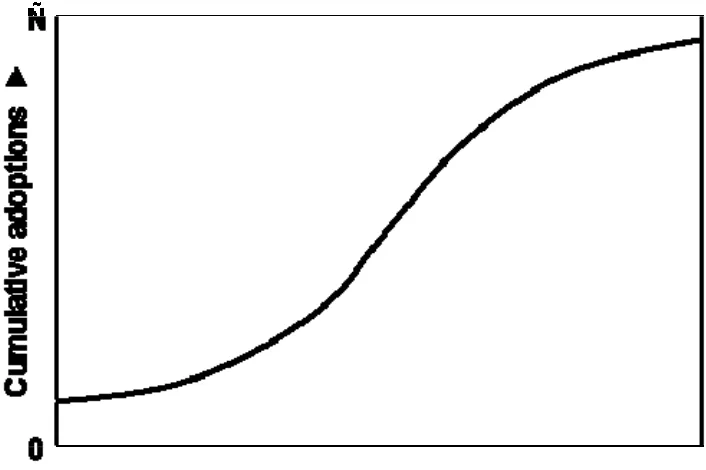
[image:4.595.124.477.498.733.2]The mixed influence model represents the rate of diffusion as a function of both external and internal influences and as such it is the most widely used among the three models. It is generally represented as an S-shaped curve as shown in Figure 1 below (Mahajan & Peterson 1985). It is in fact the new-product growth model (Bass 1969) that has found wide application in the analysis and forecasting of sales for consumer durables as well as service products. The present paper also utilised the mixed influence model.
Several review articles (Meade & Islam 2006; Sultan, Farley & Lehmann 1990) have demonstrated the wide applicability of these diffusion models. However, a recent review article pointed out that there is a relative dearth of research providing a quantitative analysis of financial innovation (Frame & White 2004). The present paper contributes to the body of literature on the application of innovation diffusion theory to financial products and services by analysing share ownership as a diffusion phenomenon.
Data and Methodology
As mentioned earlier, the present paper utilised the mixed influence diffusion model represented in Equation 3, with being expressed as the percentage of the
Australian adult population who own shares directly as at a certain year and
) (t N
N
therefore being 100%. The total number of potential adopters can be assumed to be very close to 100% or the entire Australian adult population as survey findings summarised in the Appendix showed that direct share ownership in Australia cuts across all demographic segments (ASX 2004). This is a departure from the common formulation of the diffusion model which expresses N as a function of time also, greatly simplifying the calculations involved. In using Equation 3 however, instead of treating the coefficients p and q as constants, they were both expressed as functions of variables that are posited to influence diffusion of the innovation which in this case is direct share ownership.
Following on from an early paper that represented the coefficient of innovation as a function of advertising expense for the given period (Horsky & Simon 1983) as well as succeeding papers that adopted this track, the present paper expressed the coefficient of innovation as follows:
) ( )
(t a bI t
p = + (Equation 4)
where and b are constants and is the total amount of Initial Public Offer (IPO) capital raisings for a certain year. The rationale for this is that IPOs are usually accompanied by information campaigns through vertical channels of communication that can be taken as an external influence on non direct share owners. Furthermore, it is posited that non direct share owners would react to the offer of IPO’s largely on their own and without much influence from direct share owners.
Following on from an early paper that represented the coefficient of imitation as a function of profitability of the innovation for the given period (Mansfield 1961) as well as succeeding papers that adopted this track, the present paper expressed the coefficient of imitation as follows:
) ( )
(t c dR t
q = + (Equation 5)
where and are constants and is the return from share investments represented by the change in the ASX All Ordinaries Total Return Index over a certain year. The rationale for this is that recent profitability of shares is communicated horizontally and serves to enhance the extent to which direct share owners are able to influence non direct share owners to join the bandwagon. The plausibility of imitation is also supported by survey findings where family, friends, associates and advisers were cited by 53% of respondents as sources that most influence their direct investment decisions (ASX 2004).
c d R(t)
The two variables identified above can be related back to the characteristics of innovation that were discussed earlier. The information campaign that accompanies IPOs enhances the perception of compatibility, non-complexity and trialability of direct share ownership. Recent share return performance would enhance the perception of relative advantage and observability of direct share ownership.
Having explained the rationale for the proposed models, the present paper does not claim that and are the only variables that affect the coefficients but only posits that they are the principal variables influencing them. The present paper also does not discount the possibility that there could be crossover effects (e.g. IPO activity affecting the coefficient or recent returns affecting the coefficient ). These could be the subject of further investigation in this area.
) (t
I R(t)
q p
In summary, the model utilised by the present paper is represented by the following equation defining the rate of diffusion of direct share ownership at year t:
[
( )][
100% ( )] [
( )]
( )[
100% ( )) ( t N t N t dR c t N t bI a dt t dN − + + − +
=
]
(Equation 6)Table 2: Data used in analysis
Financial year t
Total IPO capital raisings, $billion
I(t)
ASX All-ordinaries total return, %
R(t)
Direct share ownership among adult Australians, %
N(t)
1990-1991 0.112 5.86 9.7*
1991-1992 3.756 13.04 10.0
1992-1993 2.160 8.66 12.0*
1993-1994 8.130 15.52 14.0*
1994-1995 2.081 6.44 16.0
1995-1996 4.960 14.32 17.3*
1996-1997 4.377 26.84 18.7*
1997-1998 15.157 0.96 20.0
1998-1999 5.649 14.14 32.0
1999-2000 6.130 16.76 41.0
2000-2001 8.340 8.85 40.0
2001-2002 2.590 -4.50 38.5*
2002-2003 5.990 -1.08 37.0
2003-2004 12.700 22.37 39.0
2004-2005 14.883 24.75 44.0
The total IPO capital raisings for each year were obtained from the ASX Annual Reports. The ASX all-ordinaries total returns were derived from the changes in the total return indices for each year.
The data for direct share ownership were sourced from the comprehensive surveys that ASX has been commissioning starting in 1988 (ASX 1991, 1994, 1997, 2002, 2003, 2004). These telephone surveys are generally done in November of the financial year and involves around 2,400 randomly selected respondents aged 18 years and above from across all states and territories. Stratified random sampling procedures are used, including random selection of households and of individuals in each household. The data from the telephone survey is weighted to represent the Australian adult population in terms of age, gender and location as per ABS figures. At a confidence level of 95%, sampling variability for survey results is estimated at +/-2%. For instance, in the case of the latest figure, in 95 cases out of 100 the result will fall between 42% and 46% and still be a valid and reliable statistic (ASX 2004). As the survey was not conducted every year, some of the share ownership data (indicated by an asterisk) were interpolated linearly.
The first step in estimating the constants a, , and involved re-writing equation 6 in terms of its discrete analogue (Mahajan & Peterson 1985), as follows:
b c d
[
( )][
100% ( )] [
( )]
( )[
100% ( )]
( ) )( ) 1
(t N t a bI t N t c dR t N t N t error t
N + − = + − + + − +
(Equation 7)
The data in Table 2 were substituted into Equation 7 and the constants were estimated by means of ordinary least squares regression analysis. Combinations of various transformations for and were tried to determine the model of best fit on the basis of the resulting
) (t
I R(t)
2
R figures. The transformations tried were none, logarithmic and quadratic.
Results and Discussion
The results of the regression analysis using SPSS are summarised as follows:
Table 3: Results of regression analysis
Transformation used Estimates for constants
for I(t) for R(t) a b C d R
2
None None 0.005 0.009 -0.001 -8.595E-06 0.650
None Logarithmic 0.006 0.009 -0.001 0.000 0.652
Logarithmic None 0.025 0.019 -0.001 -3.72E-06 0.451
Logarithmic Logarithmic 0.026 0.020 0.000 0.000 0.459
None Quadratic 0.005 0.009 -0.001 -5.22E-07 0.651
Quadratic None 0.019 0.001 -0.001 7.37E-06 0.685
Quadratic Quadratic 0.019 0.001 -0.001 3.63E-08 0.684
Logarithmic Quadratic 0.025 0.019 -0.001 -3.35E-07 0.452
Quadratic Logarithmic 0.019 0.001 -0.001 2.56E-05 0.684
Using the parameter estimates with the highest 2
R above, the resulting model is therefore:
[
0.019 0.001 ( )]
[
100% ( )] [
0.001 0.000007 ( )]
( )[
100% ( )]
) ( 2 t N t N t R t N t I dt t
dN = + − + − + −
(Equation 8)
The direct share ownership trend predicted by this model is compared with the actual data in the chart below. Predictions were carried out on a progressive basis (i.e. each was calculated based on a previous which was also calculated) and on a year-by-year basis (i.e. each was calculated based on the actual previous
).
) (t
N N(t)
[image:9.595.75.523.211.495.2]) (t N ) (t N
Figure 2: Test of the best fitting model
0.0 10.0 20.0 30.0 40.0 50.0 60.0 70.0 19 90-1991 19 91-1992 19 92-1993 19 93-1994 19 94-1995 19 95-1996 19 96-1997 19 97-1998 19 98-1999 19 99-2000 20 00-2001 20 01-2002 20 02-2003 20 03-2004 20 04-2005 Financial year D ir ect shar e ow n e rs hi p ( % ) Predicted, progressive Predicted, year by year Actual
The model appears to be able to generate fairly accurate predictions despite the modest R2 value. The main reason for this modest R2 value is the small number of time periods for the given time series data. The rule of thumb for the minimum ratio of observations to variables for multiple regression is 5:1 (Hair et al. 2006) whilst the ratio for this research is 3.75:1. As mentioned earlier, this is constrained by the frequency by which the share ownership surveys are conducted by ASX. In fact, the absence of a survey during certain years has resulted to some of the share ownership data being linearly interpolated.
The present paper also has possible implications for future ASX share ownership surveys. Following on from the observed influence of IPO activity and recent returns on adoption of direct share ownership, the commissioned surveys could further explore the impacts of these variables by adding appropriate questions.
The present paper only considered IPO activity and recent returns as variables that affect the diffusion coefficients. The present paper also did not consider possible crossover effects (e.g. IPO activity affecting the coefficient q or recent returns affecting the coefficient ). These research limitations could explain the modest statistical results for the model and could be the subject of further investigation in this area. For instance, the model can be enhanced to include household wealth as an additional variable affecting the adoption of the practice of direct share ownership. However, it should be noted that even if additional predictive variables are formulated, the insufficiency of share ownership data would still be a constraint in the analysis.
p
The persistent upward trend for the progressive prediction as shown in the above chart also indicates one shortcoming of the mixed influence diffusion model. It has been pointed out (Mahajan & Peterson 1985) that there is no provision in the model for rescinding of adoption. Applied to this present paper, the model could still be improved by accounting for the fact that previous direct share owners can also divest their share holdings in future periods. This also leads on to a suggestion that future ASX share ownership surveys should analyse not only the acquisition of shares but divestment as well.
Another simplifying assumption in the mixed influence diffusion model used in the present paper is that the diffusion process is binary. This implies that the members of the social system either adopt the innovation or they do not and that the adoption process is therefore a discrete rather than a continuous event (Mahajan & Peterson 1985). Future research in the diffusion of share ownership could also take into account the stages in the continuous process of adoption (e.g. awareness, trial, adoption, etc.).
Conclusion
Notwithstanding the research limitations discussed above, the present paper has been successful as an initial attempt at analysing direct share ownership as an innovation diffusion phenomenon. It proposed a mixed-influence diffusion model that has a fair predictive ability for share ownership based on identified variables. Even in its rough form, it has practical implications for instance on IPO timing decisions (e.g. during or after a period of high IPO activity and good returns). A more sophisticated version of the model formulated in this paper, possibly having more predictive variables, would be useful in formulating marketing strategies for IPOs targeting new share investors.
Appendix
References
ASX 1991, Australian Shareownership Survey 1991, Australian Stock Exchange, Sydney.
---- 1994, Australian Shareownership Survey 1994, Australian Stock Exchange, Sydney.
---- 1997, Australian Shareownership Survey 1997, Australian Stock Exchange, Sydney.
---- 2002, 2002 Australian Share Ownership Study, Australian Stock Exchange, Sydney.
---- 2003, 2003 Australian Share Ownership Study, Australian Stock Exchange, Sydney.
---- 2004, Australia's Share Owners: An ASX Study of Share Investors in 2004, Australian Stock Exchange, Sydney.
Bass, FM 1969, 'A new product growth model for consumer durables', Management Science, vol. 15, no. 5, pp. 215-27.
Frame, WS & White, LJ 2004, 'Empirical studies of financial innovation: lots of talk, little action?' Journal of Economic Literature, vol. 42, no. 1, pp. 116-44.
Hair, JF, Black, WC, Babin, BJ, Anderson, RE & Tatham, RL 2006, Multivariate Data Analysis, 6th edn, Pearson Prentice Hall, Upper Saddle River.
Horsky, D & Simon, LS 1983, 'Advertising and the diffusion of new products', Marketing Science, vol. 2, no. 1, p. 1.
Mahajan, V & Peterson, RA 1985, Models for Innovation Diffusion, Sage Pub., Beverley Hills, Calif.
Mansfield, E 1961, 'Technical change and the rate of imitation', Econometrica, no. 29, pp. 741-66.
Meade, N & Islam, T 2006, 'Modelling and forecasting the diffusion of innovation - a 25 year review', International Journal of Forecasting, vol. 22, no. 3, pp. 519-45.
Rogers, EM 1995, Diffusion of Innovations, 4th edn, Free Press, New York.