1
SOCIAL, PSYCHOLOGICAL AND BEHAVIORAL
RISK FACTORS OF OBESITY IN ADOLESCENTS
IN VELLORE
A dissertation submitted in partial fulfillment of the requirement of
The Tamil Nadu Dr. M. G. R. Medical University
For the M. D. Branch XV (Community Medicine)
2
CERTIFICATE
This is to certify that “Social, psychological and behavioral risk factors of obesity in adolescents in Vellore” is a bonafide work of Dr. Divya V S, in partial fulfillment of the requirements for the M.D Community Medicine (Branch XV) of the Tamil Nadu Dr. M.G.R. Medical University to be held in 2015.
Guide Head of the Department
Dr. Jacob John, MD, Dr. Jasmin Helan Prasad, MD, DNB, M.P.H
Professor, Professor and Head,
3
4
Acknowledgements
But He said to me ,”My grace is sufficient for you , for my power is made perfect in weakness”- 2 cor 12:9
There are many people to thank, without whom I would have not been able to complete this thesis. Here are a few to name.
I would like to thank:
God almighty for his endless grace and mercies throughout this thesis My guide Dr. Jacob John for his immense patience towards me
Dr Jasmin, Dr Kuryan, Dr. Venkat for helping me out during this thesis for their motivation and help.
My batch mates Soumyajit, Nancy, Sindu, Sam and Rohan for their love and support and constant motivation without whom I wouldn‟t have come so far And last but not least all the participants and their parents for cooperating and
helping me learn from them all who helped
For Vimala aunty and Manoja chechi for constant support and prayers Father, mother, both my sisters for being there for me always
5
ACRONYMS
BMI Body mass index
NCD Non- communicable disease GDP Gross Domestic Product
CDC Centre for Disease Control & prevention IOTF International obesity task force
WHO World Health Organization CI Confidence Interval
SES Socio Economic Status ATS Active Travel to School PA Physical Activity
TADS Treatment of Adolescent Depression Study
NHANES National Health and Nutrition Examination Survey DEXA Dual-energy X-ray Absorptiometer
MRI Magnetic Resonance Imaging CT Computed Tomography
6
List of Tables
Table 1: BMI for age and percentiles range ... 16
Table 2: Technical data of digital low floor scale ... 42
Table 3: Socio-demographic characteristics of the study population ... 71
Table 4: Occupation, income and socioeconomic status... 74
Table 5: Physical activity among cases and controls ... 76
Table 6: Social Networking ... 77
Table 7: Categorization of Obese Friends ... 78
Table 8: Mental Health Status by DASS-21 among Cases and Controls ... 79
Table 9: Age distribution among cases and controls ... 80
Table 10: Gender distribution among cases and controls ... 81
Table 11: Distribution of Religion among cases and controls ... 81
Table 12: Distribution of type of school among cases and controls ... 82
Table 13: Distribution of mother's education among cases and controls ... 83
Table 14: Distribution mother's occupation among cases and controls ... 84
Table 15 : Income ... 85
Table 16: Socio-economic status ... 87
Table 17: Mode of Transport ... 87
Table 18: Physical activity ... 88
Table 19: Distribution of watching TV among cases and controls ... 89
Table 20: Distribution of leisure time activities among cases and controls ... 90
Table 21: Number of obese friends ... 92
Table 22: Depression among cases and controls ... 93
Table 23: Anxiety among cases and controls ... 94
Table 24: Stress among cases and controls ... 95
Table 25: Summary of Bivariate tables ... 96
7
List of Figures
Figure 1: BMI for age percentiles for Boys ... 17
Figure 2: Seca 803Scale ... 43
Figure 3 : Gender distribution ... 64
Figure 4: Nutritional status of the screened students as per BMI-for-age Z-score ... 65
Figure 5: Nutritional status for different ages as per BMI-for-age (WHO classification) ... 65
Figure 6: Nutritional status for gender as per BMI-for-age (WHO classification) ... 66
Figure 7 : Z-score distribution among females ... 67
Figure 8: Z-score among Males ... 68
Figure 9: Box and Plot graph for BMI Z-score ... 69
Figure 10: Type of roof among controls ... 83
Figure 11: Type of roof among cases ... 83
Figure 12: Monthly income ... 85
Figure 13 : Socio-economic status ... 86
Figure 14: Distribution of watching TV ... 89
Figure 15: distribution of Leisure time activities ... 90
Figure 16: Mode of interaction with friends ... 91
Figure 17: Mode of interaction with friends ... 91
Figure 18: depression among cases and controls ... 93
Figure 19: Anxiety among cases and controls ... 94
8
Table of Contents
1 Introduction ... 10
2 Justification ... 12
3 OBJECTIVE ... 14
4 LITERATURE REVIEW ... 15
4.1 DEFINITION OF OVERWEIGHT AND OBESITY ... 15
4.2 OBESITY – A TICKING TIMEBOMB ... 18
4.3 World scenario ... 19
4.4 indian scenario ... 22
4.5 Tamil Nadu Scenario ... 24
4.6 RISK FACTORS OF OBESITY AMONG ADOLESCENTS ... 25
4.7 INTERNATIONAL OBESITY TASK FORCE (IOTF) ... 32
4.8 WHO CONSULTATION REPORT ON OBESITY ... 32
4.9 Tools used in study ... 34
4.10 MEASURING TOOLS... 37
4.9.1 Treatment of obesity ... 53
5 METHODOLOGY ... 56
5.1 Study Setting ... 56
5.2 Study design ... 57
5.3 Sample size ... 57
5.4 Definition of Cases and Controls ... 59
5.5 Inclusion and Exclusion criteria ... 59
5.6 Study period ... 59
5.6 Selection of cases and controls ... 60
5.7 Data collection ... 62
5.8 Statistical analysis ... 62
6 Results and Analysis ... 64
6.1 Screening Among the total population ... 64
6.2 Socio-demographic characteristics of the study population ... 70
6.3 BIVARIATE ANALYSIS ... 80
6.4 Multivariate Analyses ... 98
7 Discussion... 100
9
9 RECOMMENDATIONS ... 107
10 LIMITATIONS ... 108
11 BIBLIOGRAPHY ... 109
12 Annexures ... 115
Abstract
Title : An assessment of Social, Psychological and Behavioral risk factors of obesity among adolescents who are attending schools Vellore
Department : Community Health Department Name of the candidate : Divya V.S
Degree and Subject : MD community medicine
Name of the Guide : Dr.Jacob John
Objective: To determine the Social ,psychological and behavioral risk factors of obesity in adolescents studying in schools of Vellore
Methods : This community based case-control study . The study was powered to detect three times greater odds of being depressed among those who are obese as compared those who are non obese using a two sided fisher’s exact test .The sample size calculated for case-control study was 63 cases and 123 controls. In order to identify the requisite number of cases assuming 20% refusal to participate in the case control 750 participants were required to be screened . Finally total of 911 participants were screened and 55 cases and 145 controls were recruited for the study The permission to the conduct this study in high schools was obtained from District Educational Officer. Students’ study serial number, age, height (in cms) and weight (in kg) were entered in Epi-data software. Using WHO-Anthroplus, the data was imported and Z-score and percentiles were calculated for BMI (age adjusted). All students who had BMI percentile of 85% and above were considered as eligible to be selected as cases. From the same school, age and gender matched students (1:3) with BMI percentile <85 were selected as eligible controls. Among the eligible cases and controls, those who gave assent and parent’s consent were included in this study. Bivariate analysis was done using Chi square test to know the associations between categorical variables. Independent t test was done to compare means between two groups. After dichotomizing different variables, uni-.variate analysis was done to generate an odds ratio and 95% confidence interval to study the association between overweight and factors related to demographical characters, social networking and psychological factors. Multivariate logistic regression analysis was done to adjust for confounding
with an OR -2.02 95%CI(1.08-3.79) P value of 0.027.The children who used all other ways to keep in touch with friends had two times increased risk of being overweight or obese compared to the children who physically meet up CI(1.03-3.96) and a p value of <0.05.Children who used any mode of transport to school other than walking were at risk for obesity as compared to those who use other modes of transport with an OR of 1.95 95% CI (1.04-3.67)and a p value <0.05.After adjusting for all the risk factors high calorie food was found to be independently associated with overweight and obesity with an adjusted odds ratio of 2.38 , p value of 0.014 and 95% CI (1.189-4.764).
Conclusion: In this study we concluded that taking a high calorie snack was found to be an independent risk factor for obesity in adolescents.
10
1
Introduction
Obesity in childhood has been declared one of the most serious challenges of the 21st century. It is estimated that around 42 million children aged under five are obese worldwide, majority of whom live in the developing countries (1). It is one of the easiest of conditions to diagnose but is difficult to treat (2). In a span of thirty years the prevalence of obesity has doubled among children and quadrupled among adolescents in the United States. Being obese has many ill effects, immediate as well as long term. Immediate effects include hypercholesterolemia, high blood pressure and a condition called pre-diabetes in which the blood levels of glucose indicates a high risk for diabetes. Other effects include- joint pains, obstructive sleep apnea and social problems. When these individuals grow into adulthood they are at high risk of developing coronary artery disease, type 2 diabetes, stroke and many types of cancers including cancers of the endometrium, esophagus, kidney, pancreas, gall bladder, thyroid and ovary. As early onset obesity has significant later life risk of non-communicable diseases, there are likely to be substantial health benefits to the children in identifying those at risk of childhood obesity and intervening early{(2)}. There are many causes attributed to obesity in children including genetic predisposition, familial factors, cultural factors, habitual factors, stress, and poor self-esteem. It is also associated with neurological, endocrinal disorders and depression. Medications like steroids, antipsychotics oral contraceptive pills also cause weight gain (3).
11
present in 18.5% of the population. The results also showed anxiety in 24.4% and stress in 20% of the study population. However clinical depression was found in 12.1% and generalized anxiety disorder in 19% of the study population (5).
A prospective cohort study involving 9374 adolescents in the grades 7 through 12 was done to see if depressed mood predicts onset and persistence of obesity in adolescents. Baseline assessment was done for depression using Centre for Epidemiologic Studies Depression scale and also BMI percentiles were calculated using Centre for Disease Control and Prevention with follow up assessments a year later. Results showed that at baseline 9.7% were obese and 8.8% were depressed. Having depression at baseline was independently associated with being obese in follow up with an odds ratio of 2.06 and confidence interval of 1.18 – 3.56 (6).
Obesity is rapidly increasing in India with health consequences. Very few studies have looked at social, psychological and behavioral risk factors for obesity and its consequences in the Indian setting.
12
2
Justification
Non communicable diseases (NCD) cause more mortality each year more than all other diseases combined. Sixty three percent of deaths each year globally are due to NCDs, most of which occur in middle and low income countries. The share of out of pocket expenditure incurred for treating non communicable diseases in India rose from 31.6% as in 1995-96 to 47.3% in 2004. If NCD s were assumed to be eliminated for the year 2004 India‟s GDP would have been 4 to 10 percent higher that year (7).
More than 10% of world‟s adult population is obese and more than 1.4 billion adults are overweight. Around 3.4 million deaths can be attributed to overweight and each year. Certain proportion of disease burden is also attributed due to overweight and obesity for example, 44% of diabetes, 23% of ischemic heart disease and 7-41% of certain cancers (1).
13
psychological factors socioeconomic status. This study will attempt to study the association between many of these risk factors and adolescent overweight and obesity. Using Body mass index (BMI) instead of weight alone is more advantageous because it accounts for height and tells us whether the weight is ideal for height or not. But in children and adolescents the growth pattern varies with age and gender hence a measure which is more reliable than BMI is needed. BMI for age percentiles is considered the most appropriate measure for identifying obese and overweight individuals (9).
14
3
OBJECTIVE
To determine the social, psychological and behavioral risk factors for obesity among adolescents attending schools in Vellore district in Tamil Nadu
15
4
LITERATURE REVIEW
4.1
DEFINITION OF OVERWEIGHT AND OBESITY
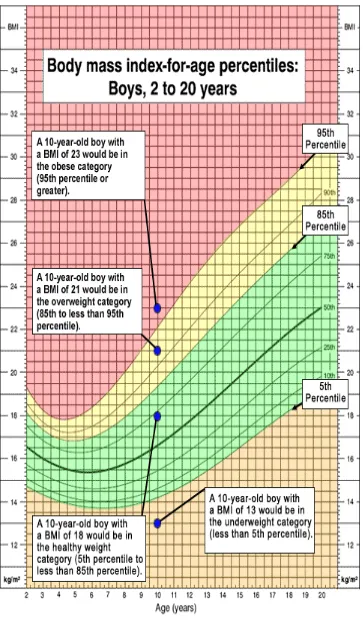
Overweight or obesity is defined as the abnormal or excessive fat accumulation that presents a risk to health (8). It is usually defined by BMI cut offs and calculated by dividing weight in kilograms by square of height in meters (11). Among pediatric obesity researchers, the term obesity is seldom used instead terms like overweight and at risk for overweight is used. Overweight is defined as weighing in excess to standard level for height and age (12). After calculating BMI, the value is plotted in the BMI for age growth charts and percentile ranking is obtained. This can be used to assess the size and growth patterns of individual children. The percentile indicates the relative position of the child‟s BMI number among the children of same age and sex. There are separate BMI growth charts for girls and boys.
The various reasons put forth for this are: a) BMI correlates more with body fat
b) Growth spurt is different in case of boys and girls c) The amount of body fat changes with age
d) The amount of body fat differs between boys and girls
First BMI is calculated and the value is plotted in the BMI for percentiles charts and is available for both girls and boys separately from age groups 2 to 20 years.
The BMI percentiles for age are classified as underweight, healthy weight, overweight and obese
16
times but the children can be under different categories at age. When BMI percentiles are considered the BMI values will have different implications for different age group. For example, a 10 year old with BMI 23 is above 95th percentile and he is obese, whereas a 15 year old with 23 is normal for his age
(8).
T
able 1: BMI for age and percentiles range
Weight status category Percentile range
Underweight Less than the 5th percentile
Healthy weight 5th percentile to less than 85th percentile
Overweight 85th percentile to less than 95th percentile
18
4.2
OBESITY – A TICKING TIMEBOMB
19
4.3
World scenario
Childhood obesity has become one of the most challenging and worrisome health Problem of the 21 century (11). Globally, among preschool children, there is a 60% increase in obesity since 1990. (14).
4.3.1
North America
20
4.3.2
Latin American and the Caribbean
Data from these countries are scarce. However, obesity has become a recognizable problem in the current times. Around 7% of children are obese according to the WHO standards in the year 2010. Though underweight is also a major problem in this region, it has substantially come down from 7% to 3% over a period of 10 years (from the year 1990 – 2010). Among school going children, a survey was conducted in Mexico using adult cut off points of BMI i.e. taking a BMI value of 25 as overweight and 30 as obese. It was found that a 10% of the 15 year old adolescents were obese and 33% were overweight or obese. Since adult cut offs were used, the true rates might be even higher. In Argentina, by screening 1688 children a representative sample between the age groups of 10 and 11 years, 35% of the children were overweight or obese according to the CDC‟s definition and 4% were stunted. It is seen that stunting later on leads to obesity.
4.3.3
Europe
The data from European countries is not complete, but the problem of obesity very much exists here too. It has increased over the years but has also seen plateauing in some countries and certain age groups. In a systematic review of studies conducted in 27 countries in European
21
4.3.4
Africa
Even though stunting underweight and hunger are more common in African countries, obesity is on the rise. The rates have doubled over a period of a 10 years from 4% to 8.5% in the year 1990 to 2000. This rise is centered more around northern part of Africa than rest of the continent. Obesity has tripled since 1990, with one in six preschool children being overweight or obese. In children and adolescents 17% girls and 11. %6 to of boys between the age groups of 6 to 13 were found to be overweight and obese in the year 2000.
4.3.5
Asia
Asia, even though hunger remains a major problem, obesity has also a growing problem in almost all regions except Japan where 5% of preschoolers were estimated to be overweight or obese in 2010. Among the school age children and adolescents, the percentage of overweight and obese children was estimated to be 14% boys and 9% in girls. Another survey done in Kuwait in 2006 showed that between the age groups of 10 to 14 years, 44% and 46% of them were obese among boys and girls respectively.
4.3.6
Oceana
22
estimated to be 21 to 25% and about 5% of them were obese. In New Zealand children between 5 to 14 years 24%.of the children were overweight and obese (10).
4.4
INDIAN SCENARIO
23
those who indulge in less than two hour per week of physical activity, 7.3 times higher risk for people watching television and playing computer games for more than four hours per day and 5.6 times higher risk to those ate chocolate on a daily basis.in this study. The prevalence of overweight and obesity were 9.9% and 4.8% respectively.(20)
North eastern States like Manipur, Meghalaya Assam and Nagaland also have significant number of children with obesity. A cross Sectional study done among 3356 students studying in class eight to twelfth students shows prevalence of overweight as 4.2 % and obesity as 0.8% (21).
24
4.5
Tamil Nadu Scenario
In the state of Tamil Nadu many studies have been done. 18995 children were screened in the age groups 6-11 years and 12 – 17 years done in 51 schools, which included 31 private and 20 government schools. The prevalence of obesity was 21.4% and 3.6% in private and government schools respectively with an odds ratio of 7.4 (95% CI 6.3-8.6 ) Prevalence of hypertension in this study was 20.4% among overweight and obese and 5.2% among non-obese(23).
In a study done in 18 states of India, among 7 to 17 year old students, 19% of the students from Tamil Nadu were overweight or obese (24). A study done in Salem in the age groups 11- 15 years showed overall prevalence was found to be 12.11% among girls was 14.65% and boys 11.95%. Higher prevalence again was seen 14 years among 13.17% and 13 years in girls 18.26% in girls (25).
25
4.6
RISK FACTORS OF OBESITY AMONG ADOLESCENTS
4.6.1
Gender
Various studies showed different results when it comes to prevalence of obesity in girls and boys .Some studies showed higher prevalence in girls and some in boys. A study was done in 15 schools in the age group 11- 16 years shows higher prevalence of obesity among boys than in girls. Another study done in 5 different districts of Tamil Nadu showed higher prevalence of girls than in boys. The prevalence of obesity was 29% among boys and 32% among girls. A study done to see the trend during the years showed there is an increase in prevalence in obesity from 4.94% to 6.57% from the year 2003 to 2005 and this result was found statistically significant (23).
4.6.2
Fathers and mothers education
26
4.6.3
Socioeconomic status
Low income groups are seen to be more obese than children from high income groups. The prevalence of obesity among boys above the poverty level is 11.9%, but the prevalence of obesity below the poverty level 21%.38% of the people live in households between 350% and 130% and another 38% below 130% of the poverty (29). The percentage of obese girls who were living above poverty level was 12% and 19.3% were below poverty level. Among the 12 million children and adolescents who are obese 24% of them live in households with income above 350% the association between socio-economic status and obesity differs by gender, age and country. In developing countries, people from higher socio-economic status who consume calorie rich diet are at risk for obesity. In industrialized countries, low socioeconomic status have more access to energy rich diet and hence at more risk for obesity (31)
4.6.4
Lack of physical activity
27
of travel like walking cycling skate boarding to school which are ways of physical activity in adolescents. Out of the 23 studies 48% of the studies showed ATS were associated with associated with beneficial health status. Four studies found positive association between ATS and health related fitness.(32). A national survey done on children‟s health in 2007 showed that there was statistically significant relationship between neighborhood parks and playgrounds and childhood obesity. The availability of neighborhood playgrounds in the neighborhood decreased the obesity by 1%, 9% and 23% for males and by 2%,17% and 28% in girls.(33).Another study done to assess how healthy weight were children who had access to playgrounds showed that children who had playground within
1 kilometer had five times more healthier weight than those without the facility (29). Both these studies ascertained the fact that availability of the playground in the neighborhood made the difference for them to go out for physical activity than those who hadn‟t. The effect of physical activity also depends on accessibility availability of playground in the neighborhood (26).
4.6.5
Time spend in television and computer
28
television around for around 1 hour 57 minutes a day. It makes children more prone for obesity because it‟s taking up there time for physical activity and also making them snack more in between meals and eat more sitting in front of the television(35)
4.6.6
Eating calorie rich food
In United States people are eating more calories than they did 30 years ago (32). Most of it is ready to eat items available in restaurants and fast food. These kinds of food contain more calories ,saturated fat.(36) A study was conducted to see association between obesity and overweight and their associated lifestyle factors. It was found that dietary behaviors like being vegetarian and non-vegetarian diets didn‟t have many effects on overweight and obesity, but people who had the habit of eating junk food and chocolates had higher risk of being obese or overweight. The number of visits to the restaurants in a week had significant association with the people who are obese because they visited restaurants more than once a week than their normal weight counterparts(37)
4.6.7
Depression, Anxiety and Stress
Stress
29
mechanisms. Stress when becomes chronic, can cause inadequate sleep, and hesitancy in taking part in leisure activities involving physical work. Stress can adversely affect the immune system and the subjects may be prone for recurrent infections. Stressful living situations, including poverty, or generalized anxiety or depression can stimulate neuroendocrine responses. Hypothalamic-pituitary axis gets activated in such situations causes intra-abdominal adiposity, insulin resistance and excessive cortisol production (38).
A study of 3598 girls and 3347 boys from the birth cohort of 1986 who were followed up since their antenatal period in Northern Finland. The stress related eating behavior was more common among girls, around 43%. The stress driven eaters had more prevalence of overweight obesity and abdominal obesity. Stress driven eating were more frequent with girls in those who use tobacco, had reduced sleep, untimely family meals and increased frequency in the consumption of chocolate, sweets, light sodas and alcohol. Among boys, those stress related eating behavior with frequent consumption of sausages, chocolate, sweets, hamburgers and pizza were more prone to stress driven eating. (39).
4.6.8
Depression
30
(TADS) reported that only 37% of adolescents treated with intensive, combination medication and psychotherapy treatment achieved remission at 12 weeks (40). In a survey conducted by National Health and Nutrition Examination Survey (NHANES) III, data showed that among the most obese adolescents, in the range of 95th to 100th percentile, there was significant levels of major depression, 20% of them in boys and 30% in the girls.
Compared to their normal counter parts obese and overweight children have more social and academic problems like poor scholastic performance and low self-esteem, anxiety, depressive disorders, and a greater number of suicide attempts.(41)
4.6.9
Anxiety
Children with obesity may also have symptoms of anxiety. They may be anxious in matters of eating, physical activity, or in social settings. Anxiety around food consumption may be initial alarming sign to suspect. They might avoid social gatherings for the for the fear of being teased. Some of them also have more concerns about their body size. Common symptoms will be headache and stomach ache which will be complained by children who want to avoid anxiety inducing situations. Other associated symptoms will be sweating of hands and increased heart rate.(42)
4.6.10
Social networking – Its impact on obesity
31
from1971 to 2003, longitudinal statistical models were used to see if obesity or weight gain in one person is associated with weight gain in his or her siblings , friends spouse etc. It was found that a person‟s chance of being obese increased by 57% if he or she had a friend who became obese in a given interval. In case of siblings, if one sibling became obese the chance that other becoming obese increased by 40%. If a spouse became obese the chance of being obese increased by 37% (38).
Social networking suggests that obesity is a result of interaction between biological behavioral and environmental factors. Social networks suggest that acquaintance such as family, schools, neighborhoods or community are interconnected and influence one another. It has significance in that the recent developments in the science of obesity genetics and its use as a preventive factor for development of overweight and obesity. A latest study suggests that 70% of adiposity is due to genetic factors and the rest due to socio environmental contributions .Other studies have suggested traits like eating distribution hunger susceptibility and eating when not hungry run in families. In a study among adolescents tend to cluster people with same weight status(44).
32
chance that the student‟s weight would decrease but there was a 56% chance that his weight would increase (8).
4.7
INTERNATIONAL OBESITY TASK FORCE (IOTF)
International obesity task force is an extended arm of the International Association of the Study of Obesity. IOTF main aim is increase the awareness of obesity and the raising issue of overweight. It works with World Health Organization and other NGO s and stakeholders who have the same area of concern.
Main objectives of IOTF are
1) Articulate policies which direct against prevention of obesity and its translation into research and practice
2) To create knowledge exchange system between individuals and organizations working in obesity Prevention.
3) Undertake research, training and other projects to further obesity prevention 4) Advocate for effective, evidence-informed policy actions for obesity prevention
at national regional and global levels (45)
4.8
WHO CONSULTATION REPORT ON OBESITY
33
34
4.9
Tools used in study
4.9.1
Defining obesity in child hood – limitations
35
This index has been show to correlate weakly with height and strongly with body fatness in adults. The problem with BMI is that it cannot distinguish between lean body mass and body fatness, so it varies with body composition and proportions. For example body fatness is more in females than in males with the same BMI. The problem is even more difficult in case of children because the height keeps on changing and so does body composition. But much confusion remains about how to choose an appropriate reference population and how to select appropriate cut-off point for defining a child as overweight or obese.
4.9.2
Current WHO Definitions
The current recommendations of World Health Organization (WHO) for defining overweight and obesity in children and adolescents separately, shows the complexity of the situation. WHO recommends that weight-for-height Z-scores are used as definition for obesity in children up to the age of 10.
In adolescents (aged 10–19 years), WHO defines “at risk of overweight” as an age-sex-specific BMI greater than the 85th percentile of the reference population. Both these definitions require the use of growth standards or references.
WHO has proposed the development of new international growth reference curves and BMI reference curves.
36
37
4.10
MEASURING TOOLS
STADIOMETER
Its benefits from other ways of measuring height
The measurement of stature (standing height) was used to determine the participants‟ Body Mass Index (weight/height in meter square). The Stadiometer used for the study was mobile Stadiometer 217 of Seca Company. It is different from other systems from other finest of Stadiometeres by its top quality materials skillfully designed assembly system. It is appropriate for doctors, nurses hospitals and easy to carry around for medical examinations to patients homes and is easily carried to schools for screening programs When disassembled, the stadiometer can be suitably transported to any local setting without the need for any support for it to be fixed.
Quick and easy
The fold away height measuring rod of the stadiometer seca 217 can be assembled together easily and fast to be fixed to attached to a steady platform. Unlike the wall mounting type there is no need to be attached to any support.
Large platform for easy use
38
readings properly. It‟s an instrument fitting to people who are particular in getting proper measurements any and every time.
Fig 4.2 Seca 217 dissembled
Specific reading of results
39 User friendly and used in any surface
The measuring rod can be dissembled and easily carried into any place and can be used any form of surface since it has a firm base. That‟s what makes is more popular than other stadiometers and preferred by many investigators in many of difficult settings like hospitals, community and schools studies which can be at times difficult.
Fig 4.3 Seca 217 mobile stadiometer.
Table 2. Technical data of Seca 217 mobile stadiometer (47)
Measuring range 20 - 205 cm /8 - 81” Graduation 1mm 1/8”
Dimensions WxHxD* 328 x 2,145 x 574 mm Device Weight 3.6 kg
40 Principles of measuring height
1) The participant stand with their back against the measuring rod of the stadiometer, heels together. The back (scapulae), buttocks and both heels should be touching.
2) Arms should be relaxed on both sides of the body are relaxed and hanging loosely at the sides shoulders relaxed (checked by running your hands over them and feeling the relaxed trapezius muscle).
3) The head should be in the "Frankfort Horizontal Plane". It‟s the line joining the lower eyelid margin and upper margin of the external auditory meatus.
4) Bring the head piece gently on top of the head. This makes sure that no hairstyle disturbs the measurement and presses down on the hair, thus flattening any hairstyle.
5) Ask the patient to breathe deeply in should not alter this position till measurement of height is over like raising the heels from the floor etc.
41 Calibration of stadiometer
Metal rod of 600 mm placed between the head piece and the base if the height rod not does measure the same height as that of the metal rod the distance between the pieces of the rods needs to be checked.
Digital floor scale with low platform
Seca clara 803 was used in this study. This instrument is one of the best choice when dependable and consistent measurements have to be made for weight monitoring and study purposes such as in schools hospitals and fitness centers. It‟s easy to use and also easy to transport also has a lifelong guarantee even when it‟s used frequently.
a) Non-slippery platform
The platform has a non-slip covering which assures a non-slippery comfortable and firm footing. The additional attachment non slippery rubber feet add to an extra grip for the stability.
b) Low platform
The four load cell technology is applied to design this instrument has given it a sleek design allows easy mounting to the platform. Special two component material allows the plat form to be softer and harder wearing.
42
c)High stability
This instrument is made of extremely high quality plastic which make the surface very hard. Thus the surface is protected from wear and tear. The surface which is smooth makes it easy to clean with spirit.
d) Easy to carry and transport
This digital floor scale weighs only 1.4 kilograms which makes it extremely easy to carry and makes it easy to carry and light for transport.
e) Low power consumption due to automatic switch-off
The best part of the machine the amount of power it saves because of the automatic switch-off with just one set of batteries about 12,000 times weight can be measured. Well ahead of time the machine indicates the change of batteries(49)
Table 2: Technical data of digital low floor scale
Capacity 150 kilograms/330 lbs.* Graduation 100 grams /0.2 lbs. * Dimensions WxHxD* 325x35x315
Digit height 28 mm
Weight 1.4 kilograms
Power supply Batteries
43
Calibration of weighing scale
[image:45.595.182.364.141.333.2]Weighing scale before use needs to be calibrated to make sure that accurate weights are being measured so that errors can be avoided. It‟s ideal to measure the weights ideally at the site where the measurements are to be made. Any weighing machine will be affected by extremes of climate, extreme movements, shakes temperature changes either because of constant use or over with time. Electronic weighing machines are in no way different in this regard and much more electronic machines can have electromagnetic, electrical and magnetic effects. Many of the effects will be obvious and easy to detect but others will display as inconsistency in weighing and instability , however both these issues needs to be addressed so that accuracy of measurements is maintained as much as possible (50)
44
Turn on the weighing machine and weight till zero appears in the monitor and make sure that the weighing scale is the desired scale you would want it to be. Then place it standard weights which are 10 kg and above. Make sure that the weights are being placed in the center of the weighing scale and not on sides or on the edges, as these weights will not be detected by the weighing scales and weighing displayed will not be correct. When more number of weights are being at a time make sure that there is very little time in between keeping weights one over the other as delay would cause the machine to display the already existing weight on its platform.
Make sure during the measurements and between weights are being changed the machine is not disturbed.
45 Depression Anxiety Stress scale 21 (DASS)
Introduction
Depression Anxiety Stress scale is a 21-item questionnaire which is used to measure three of most important negative emotions states of life namely depression anxiety and stress. Each of the three scales contains with 7 items in each, which is again divided in 4 subscales. The Depression scale assesses a state of unease and dissatisfaction (dysphonia), desperateness devaluation of life, belittling of self (self-deprecation), disinterest noninvolvement, anhedonia and inertia. The Anxiety scale assesses autonomic arousal, skeletal muscle effects, anxiety rising in certain situations, and subjective experience of anxiety and its effects. The Stress scale (items) is sensitive to levels of longstanding non-specific arousal. It also assesses relaxing difficulties, nervous arousal, and being easily unhappy disturbed, short tempered impulsive and irritated. The participants are to rate their experience in each of the mentioned state in the questionnaire in a 4 point scale or frequency as in the past week.(51).
Uses of DASS
46
though it one of the useful tolls it cannot replace a detailed history situational analysis and clinical examination, which means it‟s not a diagnostic tools to asses these specific emotional states of life.
Scoring of DASS
Scoring template which has been provided has made it simple to score the questionnaire.
Each response of the question is scored in the side of the question in the template for depression anxiety and stress respectively.
Finally there will be score each for depression, anxiety and stress like a score under D, A and S.
Each of this score is multiplied by two since it‟s a short form of form of DASS long form with 42 items (52).
DASS was developed to screen the non-clinical population. It can be used to screen adolescents and adults. It can be used children as low as 12 years of age provided they are given questionnaires in their own language (53).
Validity and reliability of DASS
47
Cronbach‟s alpha score before the factor analysis was 0.90 for Depression, 0.83 for Anxiety, 0.86 for Stress. Following factor analysis the alpha scores for anxiety and stress reduced by.03 and.04 respectively, however for depression it remained same. For construct validity, separate multiple regression models were calculated for the DASS-21 as total and for the subscales scores. The objective of this was to separately analyze the ability of maladaptive coping, adaptive coping, and satisfaction to predict each of the three different emotional states being incorporated in DASS namely depression anxiety and stress and also total score for DASS. The regression coefficient was used beta was used to determine the strength and direction of the association. Most of the scores were found to be significant with p value less than 0.001.(54)
48
anxiety depression and stress. The findings provide support for the validity of the tripartite model of negative emotions and the use of DASS 21 in adolescent boys and girls. Cronbach‟s alpha coefficients were good for all the three scores both among boys and girls the scores being depression scale (boys = 0.78 girls 0.06) anxiety scale (boys a = 0.74;girls a = 0.72) and the stress scale being (boys a = 0.76; girls a = 0.81)(56).
A 24-hour recall instrument of the daily activities and the questionnaire were compared for validity using Spearman correlation coefficients. (Kappa values) were calculated to assess the proportion of agreement based on categorization of the distributions of the physical activity variables into quartiles. Results showed correlation coefficients ranging from 0.49 to 0.70 in girls and from 0.56 to 0.83 in boys, all statistically significant. Limited concordance capacity was found in the Bland –Altman plots between test-retest of the questionnaire. Validity of IPAQ was modestly correlated for each activity with the 24-hourrecall data (range 0.09-0.51). However, the validity indicators increased considerably when the time spent in moderate and intense activities were reported, and these values were higher for older boys (57).
The relationship between mental health and obesity
49
Research has showed that there is a bidirectional relationship between obesity and depression. The main mediating factors that influence the bidirectional relationship between obesity and mental health disorder are:
a) Obesity as a cause of mental health disorder
Behavioral – low physical activity unhealthy diet and uncontrolled eating
Biological –improper hormonal pathways
Psychological – low self-esteem and body dissatisfaction
Social – stigma and rejection
b) Mental health disorders as a cause of obesity
Behavioral- lack of motivation to exercise
Biological – medications side effect
Psychological-low expectations regarding weight loss
50 Stunkard scale
[image:52.595.108.540.363.605.2]Stunkard scale is a series of images from 1 to 9 representing body images 1 being the thinnest and 9 being the heaviest.it is mainly used to perceive body image of self, participant is usually asked to pick a silhouette which closely resemble them. Silhouette 1 is the thinnest and 4 usually represent BMI 23. Silhouette 5 usually represents overweight and 9 represents fattest of the lot(58).In this study its used for perception of the friends body image in the friends circle of the study participant.
51 Childhood Obesity and its health effects
Childhood Obesity has immediate and long term effects which are prone for risk of cardiac diseases. A study done to assess cardiovascular risk factors among obese and overweight children and adolescents showed that 39% of the children with BMI > 95th percentile had at least two risk factors. Sixty five percent had excess adiposity and 65% had a BMI which was comparable to adults. Of the adolescents with BMI >= 99th percentile, 59% had at least two risk factors. Among all the obese adolescents 94% had excess adiposity and 88% of the children had BMI compared with that of adults.
The adverse health effects of obesity are:
1) More prone for high levels of cholesterol and high blood pressure
2) These children have a propensity to pre-diabetes, a condition in which blood glucose is increased and can cause development of diabetes in the future 3) The children who are obese will have problems with bones and joints and have
sleep apnea.
52 Long term effects
1) Children who are obese as adolescent are likely to obese when they grow up as adults
2) These children hence are prone coronary artery disease; type 2 diabetes mellitus cardiovascular vascular accidents, various types of cancers and osteoarthritis.
3) Being obese poses risk for various types of cancers like cancer of the cervix, ovary colon, breast, kidney, pancreas, esophagus, endometrium, thyroid, prostate, multiple myeloma and Hodgkin‟s lymphoma
53
4.9.1 Treatment of obesity
It‟s a multidisciplinary task involving a group of specialists, pediatric physician, nurse practitioner, dietician, physical instructor, behavioral therapist and a social worker in addition to a motivated team of parents, caretakers, teachers and policy makers. The main aim is to maintain the weight and not to bring down the weight. This will be followed slow reduction of weight reduction to improve BMI. The long-term goal is to improve quality of life and avoiding the immediate and long term adverse effects due to obesity.
Targets in weight loss
1) In the age group of two to five years those who are overweight are recommended to maintain and monitor their present weight.
2) While obese children in the same group, are permitted 0.5 kg /month weight loss. 3) Children in the age group of 6- 11 years who are overweight weight maintenance is adequate
4) For obese not more than one kg per week should be aimed.
5) Same principle as for 6-11 years is applied to children who are overweight and obese in the age group of 12-18 years. This should be accompanied by the following 1) Enhancement of physical activity
2) Sedentary behavior restriction 3) Pharmacological treatment 4) Surgical treatment
54 Observational studies
a. Descriptive studies b. Analytical studies
i. Ecological
ii. Cross-sectional iii. Case-control
iv. Cohort
1. Experimental studies Interventional studies
a. Randomized controlled trials b. Field trials
c. Community trials
55
Advantages and disadvantages of case-control methodology
Advantages:
Well suited to the study of rare disease or those with long latency. Relatively quick to mount the conduct.
Relatively inexpensive
Existing records can occasionally be used. No risk to subjects.
Allows study of multiple potential causes of a disease. Disadvantages:
Relies on recalls or records for information on past exposures. Validation of information is difficult or sometimes impossible. Control of extraneous variables may be incomplete.
Selection of an appropriate comparison group may be difficult. Rates of disease in exposed and unexposed individuals cannot be
determined
56
5
METHODOLOGY
5. MATERIALS AND METHODS
5.1
Study Setting
The city of Vellore is the administrative headquarters of Vellore district in the state of Tamil Nadu, South India. Vellore has four zones with a total of 60 wards, located on the banks of Palar River, in the north-eastern part of Tamil Nadu, covers an area of 87.915 square kilometer and has a population of 4, 81,996 based on 2011 census, with 239,735 males and 242,231 females (59). Vellore is an Urban Agglomeration (U/A) coming under category of Class I UAs/Towns, overseen by Municipal Corporation and is situated in the Urban region of Vellore.
The literacy rate of Vellore is 87.29% which is higher than National Urban average of 85%.
The childhood population percentage for 0-6 years is 9.35 % which is les compared to national average 10.93 %. This consists 22,889 male children and 22,160 female children(60).
57
5.2
Study design
Unmatched case control study.
5.3
Sample size
The study was powered to detect a three times greater odds of being depressed among those who are obese as compared to those not obese using a two sided Fishers exact test.
We assumed the prevalence of depression in adolescent population=12% based on a previous study from Ranchi.
Prevalence among controls (general population) – Pcontrol To get odds ratio of 3,
Prevalence among cases = OR (Pcontrol) 1+ Pconrtol (OR-1)
= (3*0.12)/ [1+ (0.12*2)] = 0.29
p = Weighted average prevalence of exposure = (0.29+ 2*0.12)/3
= 0.17
58
(
√(
) ̅ ̅
√
⁄ )
(
)
c- number of times the control
= 1.96 (upper tail probability for 0.025)
= 0.8416 (upper tail probability for 20% - i.e. 80% power)
d = difference between Pcases and Pcontrols
= 0.29 – 0.12 = 0.1
= 63 cases and 126 controls
59
5.4
Definition of Cases and Controls
Case: Any student attending school who is between the age group 10 -15 years with a BMI of >= 85th percentile and gave assent and parents gave consent to participate in the study.
Control: Any student attending school who is between the age group 10-15 years with a BMI of <85th percentile and matched for age, gender and school and gave assent and parents gave consent to participate in the study.
5.5
Inclusion and Exclusion criteria
Inclusion criteria
Adolescents between age group of 10-15years Attending schools in urban area of Vellore
Exclusion criteria
Children with physical disability Children on chronic medication
5.6 Study period
60
5.6
Selection of cases and controls
The permission to the conduct this study in high schools was obtained from District Educational Officer. The list of higher secondary schools was obtained from D.E.O office. Ten schools were chosen based on the convenience of the school administration and the investigator. Each school was approached and permission was sought from the school principal. As board exam were going on, most school principals did not give permission to include 10th grade students into this study. Classes were chosen from 6th to 9th according to convenience of teachers. In each school children from 2 sections (80-100 students) were screened. All students from these sections underwent height and weight assessment.
Students‟ study serial number, age, height (in cms) and weight (in kg) were entered in Epi-data software. Using WHO-Anthroplus, the data was imported and Z-score and percentiles were calculated for BMI (age adjusted).
61
Selected schools
The following schools were included in the study:
1. G.H.S (Government Higher Secondary School) Sholavaram 2. G.H.S Munjurpattu
3. G.H.S Pennathur 4. G.H.S Konavattam
5. Government Muslim Higher Secondary School 6. V.K.V.M Velapadi
7. N. Krishnasamy Mudaliyar H.S 8. Don Bosco H.S Vellore
62
5.7
Data collection
Data collection was done by self-administered questionnaires. The investigator explained how to fill the form and clarified their doubts. Questionnaires were made available in both English and Tamil. The self-administered questionnaires included the following
General questionnaire to collect information on demographic characteristics,
DASS 21 to assess depression, anxiety and stress and Social networking questionnaire
As students were in one class room, students were instructed not to discuss with their friends or to copy from the person sitting next.
5.8
Statistical analysis
Data was entered in Epi-data and exported in to SPSS version 16. Socio-demographic characters were categorized and frequency and percentage were calculated. DASS 21 responses were computed and total scores for depression, anxiety and stress were calculated as per the DASS 21 manual and individuals were classified as ‟normal, mild, moderate, severe and extremely severe‟
63
and psychological factors. Multivariate logistic regression analysis was performed to adjust for confounding.
64
6
Results and Analysis
6.1
Screening Among the total population
Age distribution of the screened students
Of the 911 students screened, majority, that is 311 (34.14%) were 13 years old. The minimum recorded age was 10 years and there were 14 (1.54%) children.
Gender distribution among the screened students
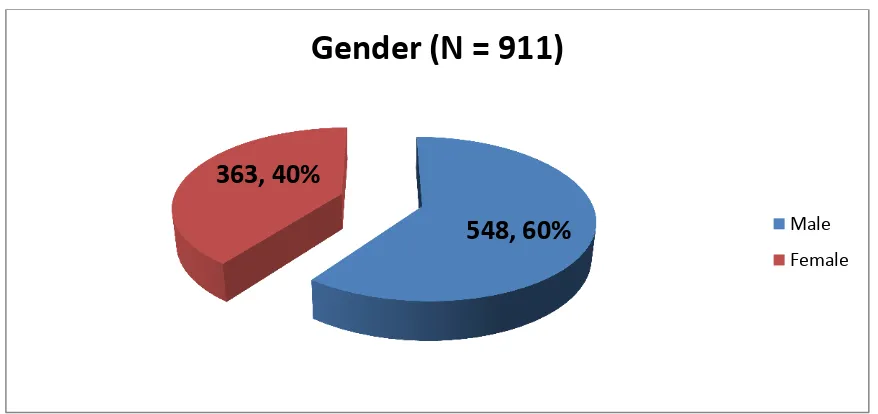
[image:66.595.105.544.395.602.2]Total of 911 students were screened across 10 schools for overweight and obesity of whom, 548 (60%) were males and 363 (40%) were females.
Figure 3 : Gender distribution
548, 60%
363, 40%
Gender (N = 911)
65
Nutritional status of the screened students as per BMI-for-age (WHO classification)
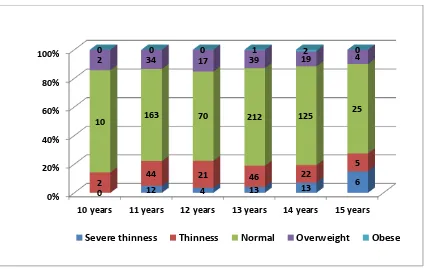
[image:67.595.111.527.230.389.2]In the screening we found that 115 children (12.6%) were overweight and 3 (0.3%) were obese. Among the 13 year olds, 39 (12.5%) were found to be over-weight while among the 11 year olds, 34 (13.4%) were found to be over-weight.
Figure 4: Nutritional status of the screened students as per BMI-for-age Z-score
Figure 5: Nutritional status for different ages as per BMI-for-age (WHO classification)
48, 5% 140, 15% 605, 67% 115, 13% 3, 0% BMI-for-age Z-score Severe thinness Thinness Normal Overweight Obese 0% 20% 40% 60% 80% 100%
10 years 11 years 12 years 13 years 14 years 15 years
0 12 4 13 13
6
2 44 21 46 22
5
10 163 70 212 125
25
2 34 17 39 19 4
0 0 0 1 2 0
[image:67.595.110.537.469.738.2]66
Nutritional status for gender as per BMI-for-age (WHO classification)
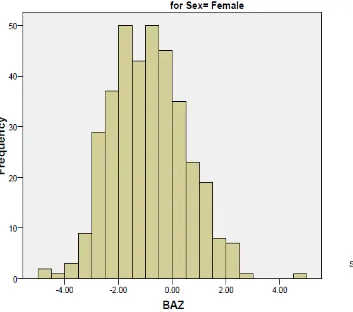
[image:68.595.106.564.319.622.2]The BMI-for-age Z-scores were compared with the gender of the student population. Among the 548 males, 80 (14.6%) were found to be over-weight and among the 363 females, 35 (9.6%) were over-weight. Among the males, 2 (0.4%) were obese and among the females, only one (0.3%) female was found to be obese.
Figure 6: Nutritional status for gender as per BMI-for-age (WHO classification)
15 33
66 74
246
359
35 80
0% 10% 20% 30% 40% 50% 60% 70% 80% 90% 100%
Female Male
68
69
70
6.2
Socio-demographic characteristics of the study
population
Among the 200 study participants, the mean age among the cases was 12.67 years (SD = 1.07) and for the controls it was 12.79 years (SD = 0.99). There were 38 (69.1%) males and 17 (30.9%) females among the cases and there were 93 (64.1%) males and 52 (35.9%) females in the control group.
Majority were Hindus, 44 (80%) among the cases and 116 (80.0%) among the controls.
Among the cases, 23 (40%) attended government schools whereas the remaining 33 (60%) attended government aided schools. Among the controls, 56 (38.6%) attended government schools and 89 (61.4%) attended government aided schools.
71
Table 3: Socio-demographic characteristics of the study population
Variable Category Cases N=55 n (%)
Controls N=145
n (%)
Age (years)
11 8 (14.5%) 16 (11%) 12 17 (30.9%) 38 (26.2%) 13 17 (30.9%) 56 (38.6%) 14 11 (20%) 31 (21.4%)
15 2 (3.6%) 4 (2.8%)
Gender
Male 38 (69.1%) 93 (64.1%) Female 17 (30.9%) 52 (35.9%)
Religion
Hindu 44 (80.0%) 116(80.0%)
Christian 2 (3.6%) 8 (5.5%) Muslims 9 (16.4%) 21 (14.5%)
Type of school
Government 22 (40.0%) 56 (38.6%) Government aided 33 (60.0%) 89 (61.4%)
Type of house
72 Education
Majority of the mothers were educated up to high school both among the cases and the controls which was 30 (54.5%) and 62 (42.5%) respectively. There were more mothers who had attended high school among the controls than among the cases. The next highest numbers were seen in the primary school group which had 11 (20.0%) and 5 (3.4%) of cases and controls respectively. There was lesser number of mothers who had attended higher secondary school in the cases when compared to the controls which were 6 (10.9%) and 21 (14.5%) respectively. Though there were very few graduates both among the cases and controls, the numbers were more among the controls with only 1 (1.8%) among the cases and 3 (2.1%) among the controls. There were no uneducated mothers.
73 Occupation, income and socioeconomic status
Majority of the mothers were housewives, there were more housewives in the controls than among the cases. This was 82 (56.6%) among the controls and 34 (61.8%) among the cases. There were more skilled as well as semi-skilled workers among the controls as compared to the cases.
There were more skilled as well as semi-skilled workers among the controls when compared to the cases. These were 45 (31.0%) among the controls and 16 (29.1%) among the cases who were semi-skilled workers and 41 (28.3%) and 17 (30.9%) in the skilled group for the controls and cases respectively.
74
Table 4: Occupation, income and socioeconomic status
Variable Category
Cases N=55 n (%) Controls N=145 n (%) Mother’s occupation
Professional 0 (0%) 4 (2.8%) Semi-professional 1 (1.8%) 0 (0%) Clerical, shop-owner 2 (3.6%) 4 (2.8%)
Skilled worker 3 (5.5%) 7 (4.8%) Semi-skilled worker 2 (3.6%) 16 (11%) Unskilled worker 13 (23.6%) 32 (22.1%)
House-wife 34 (61.8%) 82 (56.6%)
Father’s occupation
Professional 2 (3.6%) 11 (7.6%) Semi-professional 1 (1.8%) 4 (2.8%) Clerical, shop-owner 7 (2.7%) 13 (9%)
Skilled worker 17 (30.9%) 41 (28.3%) Semi-skilled worker 16 (29.1%) 45 (31%)
Unskilled worker 12 (21.8%) 31 (21.4%)
Monthly Income (Rs.)
upto 1600 5 (9.1%) 19 (13.1%) 1601 – 4809 28 (50.9%) 72 (49.7%) 4810 – 8009 12 (21.8%) 33 (22.8%) 8010 -12019 7 (12.7%) 15 (10.3%) 12020 – 16019 2 (3.6%) 3 (2.1%)
16020 - 32049 1 (1.8%) 3 (2.1%)
Socio-economic status
75 Physical activity among cases and controls
76
Table 5: Physical activity among cases and controls
Variable Category
Cases N=55
n (%)
Controls N=145
n (%)
Transport to school
Walking 22 (40.0%) 82 (56.6%) Cycling 15 (27.3%) 27 (18.6%) Two-wheeler 5 (9.1%) 11 (7.6%)
School Bus 2 (3.6%) 1 (0.7%) Transport Bus 1 (1.8%) 5 (3.4%) Other 10 (18.2%) 19 (13.1%)
Going to playground
Yes 137 (67.3%) 102 (70.3%) No 18 (32.7%) 43 (29.7%)
Watching TV 2 hours or more 29 (52.7%) 69 (47.6%) Less than 2 hours 26 (47.3%) 76 (52.4%)
Eating Habits
77 Social Networking
[image:79.595.102.533.403.747.2]In the time spent in leisure activity, majority, 16 (29.1%) of the cases spent their leisure time by eating outside when compared to 39 (26.1%) of the controls. 26 (17.9%) of the controls played outdoor games when compared to 7 (12.7%) of the cases. 18 (32.7%) of the cases never spent time for ant sort of leisure activity when compares to 45 (31.0%) of the controls. The main mode of interaction among the adolescents were by visiting each other which was 36 (65.5%) when compared to 113 (77.9%) among the controls. This was followed by majority of them in the cases, 17 (30.9%) using cell phone to interact with friends when compared to 22 (15.2%) of controls.
Table 6: Social Networking
Variable Category Cases N=55 n (%)
Controls N=145 n (%)
Leisure time activity
No leisure time
activity 18 (32.7%) 45 (31%) Playing video games 7 (2.7%) 20 (13.8%)
Eat out 16 (29.1%) 39 (26.9%) Indoor games 1 (1.8%) 7 (4.8%) Sit around and chat 6 (10.9%) 8 (5.5%) Outdoor games 7 (12.7%) 26 (17.9%)
Mode of interaction with
friends
Physically visiting
them 36 (65.5%) 113 (77.9%) Through facebook 1 (1.8%) 5 (3.4%) Through cell phone 17 (30.9%) 22 (15.2%)
78 Friends
The number of friends who were obese for the study participants were compared among the cases and controls. Of the 55 cases, 16 adolescents (29.1%) among cases had at least 2 obese friends when compared to 43 (29.7%) among the controls. Among the cases 7 (12.7%) had at least 3 obese friends when compared to 27 (18.6%) of the controls.
Table 7: Categorization of Obese Friends
Variable Category Cases N=55
n (%)
Controls N=145
n (%)
Number of obese/overweight friends
< 3 friends 41 (74.5%) 96 (66.2%) 3 and above 14 (25.9%) 49 (33.8%)
Mental Health Status by DASS-21 among Cases and Controls
79
Table 8: Mental Health Status by DASS-21 among Cases and Controls
Variable Category
Cases N=55 n (%)
Controls N=145 n (%)
Depression
No depression 33 (61.1%) 78 (54.5%)
Mild depression 5 (9.3%) 25 (17.5%)
Moderate depression 12 (22.2%) 28 (19.6%)
Severe depression 2 (3.7%) 9 (6.3%)
Extreme severe depression 2 (3.7%) 3 (2.1%)
Anxiety
No anxiety 28 (51.9%) 66 (46.2%)
Mild anxiety 5 (9.3%) 19 (13.3%)
Moderate anxiety 5 (9.3%) 27 (18.9%)
Severe anxiety 8 (18.8%) 12 (8.4%)
Extreme severe anxiety 8 (14.8%) 19 (13.3%)
Stress
No stress 42 (77.8%) 107 (74.8%)
Mild stress 3 (5.6%) 14 (9.8%)
Moderate stress 5 (9.3%) 16 (11.2%)
Severe stress 4 (7.4%) 6 (4.2%)
80
6.3
BIVARIATE ANALYSIS
A total of 200 participants were recruited in the study. Among them 55 participants had BMI for age percentile more than 85 (cases) and 145 participants had less than 85th percentile.
AGE
Table 9: Age distribution among cases and controls
Age Cases
n (%)
Controls n (%)
Total n (%) 11 to 12 years 25 (45.5) 54 (37.2) 79 (39.5) 13 to 15 years 30 (54.5) 91 (62.8) 121 (60.5)
Total 55 145 200
Chi sq. = 0.43 p –value = 0.51 OR (95% CI) = 0.8 (0.41 – 1.56)
81
SEX
Table 10: Gender distribution among cases and controls
Gender Cases
n (%)
Controls n (%)
Total n (%)
Female 17 (30.9) 52 (35.9) 69 (34.5)
Male 38 (69.1) 93 (64.1) 131 (65.5)
Total 55 145 200
Chi sq. = 0.43 p –value = 0.51 OR (95% CI) = 1.25 (0.64 – 2.43)
Of the 55 cases and 145 controls, majority of them, i.e., 31% (17/55) of the females were cases as compared to 36% (54/145) of the controls. The remaining 66 % of the participants were. The difference in proportion between boys and girls was not statistically significant (p-value 0.511).
RELIGION
Table 11: Distribution of Religion among cases and controls
Religion Cases
n (%)
Controls n (%)
Total n (%)
Hindu 44 (80) 116 (80) 160 (80)
Muslim/Christian 11 (20) 29 (20) 40 (20)
Total 55 145 200
82
Majority of the participants (80%) belonged to the Hindu religion. The distribution of religion was the same among cases and controls in this study population. There was no statistically significant association between religion and overweight/obesity.
TYPE OF SCHOOL
Table 12: Distribution of type of school among cases and controls
School Cases
n (%)
Controls n (%)
Total n (%)
Government 22 (40) 56 (38.6) 78 (39)
Government aided 33 (60) 89 (61.4) 122 (61)
Total 55 145 200
Chi sq. = 0.032 p –value = 0.86 OR (95% CI) = 1.06 (0.56 – 1.99)
83
TYPE OF ROOF
Forty three per cent (24/55) of the cases lived in houses with concrete roofs as compared to 51% (74/