INELASTIC BEHAVIOR OF CONCRETE-FILLED THIN-WALLED STEEL TUBULAR COLUMNS SUBJECTED TO LOCAL BUCKLING
Qing Quan LIANG1
ABSTRACT: This paper is concerned with the inelastic behavior of axially loaded concrete-filled thin-walled steel tubular columns subjected to local buckling. A nonlinear fiber element analysis program accounting for local buckling effects is developed for predicting the ultimate strength and ductility of concrete-filled thin-walled steel tubular columns. The effects of local buckling are taken into consideration by using the local buckling equations and effective width formulas for steel plates. The fiber element analysis technique is verified by experimental results and is employed to study the effects of steel ratios and concrete strengths on the ultimate strength and ductility of concrete-filled thin-walled steel tubular columns.
KEYWORDS: composite column; ductility; fiber element method; local buckling; strength.
1. INTRODUCTION
High strength structural steels and concrete are increasingly used with thin steel plates in concrete-filled steel tubular (CFST) columns. However, this gives a rise to local buckling. High strength concrete may also reduce the ductility of CFST columns because of its brittle nature. Design codes such as Eurocode 4 [1], LRFD [2] and ACI 318-02 [3] do not consider the effects of the plate local buckling on the ultimate strength of CFST columns. Tests on thin-walled CFST columns showed that thin steel plates might buckle award from the concrete core [4-6]. The post-local buckling behavior of steel plates in composite members was reported by Liang and Uy [7]and Liang et al. [8, 9].
The fiber element method has been presented by El-Tawil et al. [10] for the nonlinear analysis of concrete-encased composite columns under axial load and biaxial bending. El-Tawil and Deierlein [11] studied the ultimate strength and ductility of concrete-encased composite columns. Lakshmi and Shanmugam [12] presented a semi-analytical model for analyzing CFST columns. Liew et al. [13] developed an advanced analysis program for the nonlinear analysis of steel frames with composite beams. The effects of local buckling, however, have not been considered in nonlinear analysis methods for thin-walled CFST columns.
In this paper, the ultimate strength and ductility of short thin-walled CFST columns with local buckling effects are investigated by using a nonlinear fiber element analysis technique. Design formulas for critical local buckling and effective width formulas are employed in the fiber element analysis method to account for local buckling effects. The accuracy of the fiber element analysis method is established by comparisons with experimental results. The fiber element analysis technique is then employed to study the effects of steel ratios and concrete strengths on the strength and ductility of thin-walled CFST columns subjected to local buckling.
1
2.1 CONSTITUTIVE MODELS FOR STEEL
In the fiber element method, the composite section is discretized into many fiber elements. The uniaxial stress-strain relationships are used for materials. Stress resultants are obtained by numerical integration of stresses through the composite section. The fiber stresses for structural steels with residual stresses are calculated using The Ramberg-Osgood formula [14], which is expressed by
+ =
n s s
s s
E 7 0.7
3 1
σ σ σ
ε (1)
whereσs is the longitudinal stress in steel, εs is the longitudinal strain in steel, Es is the Young’s
modulus of steel, σ0.7is the stress corresponding to E0.7 =0.7Es, and n is the knee factor that defines
the sharpness of the stress-strain curve. The knee factor n = 25 is used in the fiber element analysis program to account for the isotropic strain hardening of steel sections [7].
2.2 CONSTITUTIVE MODELS FOR CONCRETE
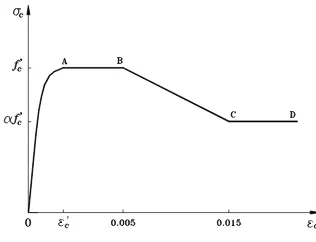
It is assumed that the confinement effect increases only the ductility of the encased concrete in a CFST column but not its ultimate load [15]. The general stress-strain curve for concrete in CFST columns is depicted in Figure 1. The part OA of the stress-strain curve is modeled using the equation suggested by Mander et al. [16] as
(
)
(
)
γε ε γ
ε ε γ σ
' ' '
1 c c
c c c c
f
+ −
= (2)
where σc is the longitudinal compressive concrete stress,
'
c
f is the compressive cylinder strength of
concrete, εc is the longitudinal compressive concrete strain, '
c
ε is the strain at '
c
f . The parameter γ is determined by
(
' ')
c c c
c
f E
E ε γ
−
= (3)
where Ec is the Young’s modulus of concrete. The strain
'
c
ε is taken as 0.002 for concrete strength under 28 MPa and 0.003 for concrete strength over 82 MPa and is determined as a linear function of the concrete strength between 28 and 82 MPa. The parts AB, BC, CD of the stress-strain curve for confined concrete depicted in Figure 3 are defined as follows:
'
c c = f
σ for ' 0.005
≤ < c
c ε
ε (4)
(
)
(
' ')
'
015 . 0
100 c c c
c
c αf ε f αf
σ = + − − for 0.005<εc≤0.015 (5)
'
c c αf
σ = for εc>0.015 (6)
Figure 1. Stress-strain curve for concrete Figure 2. Effective fibers in CFST section
2.3 CRITICAL LOCAL BUCKLING
Local buckling of steel plates depends on the width-to-thickness ratios, stress states, boundary conditions, initial geometric imperfections and residual stresses. For CFST columns under axial compression, the critical local buckling stresses of thin steel plates can be determined by [9]
3 7 2
5
10 198 . 1 10
869 . 9 005132
. 0 5507 .
0
× +
× −
+
= − −
t b t
b t
b fy
cb
σ
(7)
whereσcb is the critical local buckling stress of the plate with imperfections, b is the width of the plate, t is the thickness of the plate and fyis the yield strength of steel plates. Equation (7) accounts
for the initial out-of-plane deflection of 0.1t and residual compressive stress of 0.25fy and can be
used for steel plates with b/t ratios ranging from 30 to 100.
2.4 POST-LOCAL BUCKLING
The effective width concept is usually used to express the post-local buckling strength of thin steel plates as depicted in Figure 2. An effective width formula proposed by Liang et al. [9] is employed in the fiber element analysis program and it is expressed by
3 6 2
4
10 921 . 1 10
944 . 3 02038
. 0 5554 .
0
× +
× −
+
= − −
t b t
b t
b b
be (8)
where be is the effective width of a steel plate. The above effective width formula accounts for the
initial out-of-plane defection of 0.1t and residual compressive stress of 0.25fy and can be used for
steel plates with b/t ratios ranging from 30 to 100. In the fiber element analysis program, the progressive local and post-local buckling of steel plates in concrete-filled steel box columns is simulated by gradually redistributing the normal stresses within the steel plates.
3. SECTION AND DUCTILITY PERFORMANCE
∑
∑
= =
=
+
= nc
j
j c j u ns
i
i s i u
i s
A A
PI
1 , , 1
, ,
1
σ σ
(9)
where σu,i is the longitudinal stress of steel fiber i at the ultimate load and σu,j the longitudinal stress of concrete fiber j at the ultimate load. The section performance index accounts for the effects of cross-sectional areas and material strengths of steel and concrete and b/t ratios.
To evaluate the axial ductility performance of CFST columns, the ductility performance index is defined as
y d
PI ε ε0.95
= (10)
where ε0.95 is the axial strain when the load falls to 95% of the ultimate load and εy is the axial strain
when the composite section is at yield. The axial strain εy is approximately defined as the strain when
the load attains 95% of the ultimate load.
4. COMPARISONS WITH EXPERIMENTAL RESULTS
The fiber element analysis results are compared with experimental data presented by Schneider [17] to verify the method. In the present fiber element analysis, the maximum concrete compressive stress in the constitutive model was taken as '
85 .
0 fc for all specimens. The load-axial strain curves for these
concrete-filled steel box columns obtained by the fiber element analysis and experiments are depicted in Figure 3. The figure demonstrates that the fiber element analysis technique predicted very well the axial stiffness, ultimate strengths and post-peak behavior of the test specimens.
5. EFFECTS OF STEEL RATIOS
The composite column section (600 × 600 mm) with steel ratios (β = As/Ag) of 0.04, 0.08 and 0.12
was analyzed using the fiber element technique. Material properties were: fy =250 MPa and
28
' = c
f MPa andEs =200GPa. The maximum compressive concrete strength was taken as
'
85 .
0 fc in the material model. The load-axial strain curves obtained for CFST columns are depicted in Figure 4(a), where P0 is the ultimate load of the composite section with a steel ratio of 0.04. The figure shows that increasing the steel ratio increases the ultimate load and axial stiffness of the column. The section performance index increased from 0.2 to 0.44 and 0.55 when the steel ratio increased from 0.04 to 0.08 and 0.12, respectively. The ductility performance index of the section with steel ratios of
g
s A
0 200 400 600 800 1000 1200
0 0.005 0.01 0.015 0.02
Axial strain
L
o
a
d
(
k
N
)
Experiment (S1) Present study
0 200 400 600 800 1000 1200 1400
0 0.005 0.01 0.015 0.02 0.025 0.03
Axial strain
L
o
a
d
(
k
N
)
Experiment (S2) Present study
(a) Specimen S1 (b) Specimen S2
0 200 400 600 800 1000
0 0.01 0.02 0.03 0.04
Axial strain
L
o
a
d
(
k
N
)
Experiment (R1) Present study
0 200 400 600 800 1000 1200 1400
0 0.005 0.01 0.015 0.02 0.025 0.03
Axial strain
L
o
a
d
(
k
N
)
Experiment (R3) Present study
[image:5.595.117.481.88.420.2](c) Specimen R1 (d) Specimen R3
Figure 3. Comparison of present study with experimental results
β = 0.04 β = 0.08 β = 0.12
0 0.2 0.4 0.6 0.8 1 1.2 1.4 1.6 1.8 2
0 0.005 0.01 0.015 0.02 0.025 0.03
Axial strain
L
o
a
d
P
/P
0
f'c=28MPa f'c=69MPa f'c=110MPa
0 0.5 1 1.5 2 2.5 3
0 0.005 0.01 0.015 0.02 0.025 0.03
Axial strain
L
o
a
d
P
/
P0
Figure 4. Behavior of CFST columns: (a) effects of steel ratios; (b) effects of concrete strengths
6. EFFECTS OF CONCRETE STRENGTHS
[image:5.595.115.479.464.597.2]MPa, the ductility performance index of the composite section decreased from 4.9 to 2.6.
7. CONCLUSIONS
In this paper, the ultimate strength and ductility of short concrete-filled thin-walled steel box columns have been investigated using the fiber element analysis technique. The progressive local and post-local buckling of a thin-walled CFST column is modeled by gradually distributing the normal stresses within the steel box. The effects of steel ratios and concrete strengths on the ultimate strength and ductility of CFST columns were investigated. The 4% limit on the steel ratio or the 0.2 limit on the steel contribution ratio imposed in current design codes leads to the use of very slender steel tube walls in CFST columns. It is suggested that CFST columns should be designed to have a section performance index as high as 0.5 to be considered as efficient composite sections.
8. REFERENCES
1. Eurocode 4. Design of composite steel and concrete structures, Part 1.1, general rules and rules for buildings. 1994.
2. LRFD. Load and resistance factor design specification for steel buildings. American Institution of Steel Construction, 1999.
3. ACI 318-02. Building code requirements for reinforced concrete. ACI, Detroit, MI, USA, 2002. 4. Ge, H.B. and Usami, T., “Strength of concrete-filled thin-walled steel box columns:
experiments”. Journal of Structural Engineering, ASCE, Vol. 118, No. 11, 1992, pp. 3036-3054. 5. Bridge, R.Q., O’Shea, M.D., Gardner, P., Grigson, R. and Tyrell, J., “Local buckling of square
thin-walled steel tubes with concrete infill”. Proc. of the Int. Conf. on Structural Stability and Design, Sydney, Australia, 1995, pp. 307-314.
6. Uy, B., “Strength of concrete-filled steel box columns incorporating local buckling”. Journal of Structural Engineering, ASCE, Vol. 126, No. 3, 2000, pp. 341-352.
7. Liang, Q.Q. and Uy, B., “Theoretical study on the post-local buckling of steel plates in concrete-filled box columns”. Computers and Structures, Vol. 75, No. 5, 2000, pp. 479-490.
8. Liang, Q.Q., Uy, B., Wright, H.D. and Bradford, M.A., “Local buckling of steel plates in double skin composite panels under biaxial compression and shear”. Journal of Structural Engineering, ASCE, Vol. 130, No. 3, 2004, pp. 443-451.
9. Liang, Q.Q., Uy, B. and Liew, J.Y.R., “Local buckling of steel plates in concrete-filled thin-walled steel tubular beam-columns”. Journal of Constructional Steel Research, 2005 (submitted). 10. El-Tawil, S., Sanz-Picón, C.F. and Deierlein, G.G. “Evaluation of ACI 318 and AISC (LRFD) strength provisions for composite beam-columns”. Journal of Constructional Steel Research, Vol. 34, No. 1, 1995, 103-126.
11. El-Tawil, S. and Deierlein, G.G., “Strength and ductility of concrete encased composite columns”. Journal of Structural Engineering, ASCE, Vol. 125, No. 9, pp. 1009-1019.
12. Lakshmi, B. and Shanmugam, N.E., “Nonlinear analysis of in-filled steel-concrete composite columns”. Journal of Structural Engineering, ASCE, Vol. 128, No. 7, 2002, pp. 922-933.
13. Liew, J.Y.R., Chen, H. and Shanmugam, N.E., “Inelastic analysis of steel frames with composite beams”. Journal of Structural Engineering, ASCE, Vol. 127, No. 2, 2001, pp. 194-202.
14. Ramberg, W. and Osgood, W.R., “Description of stress-strain curves by three parameters”. NACA Technical Note. No. 902, 1943.
15. Tomii, M. and Sakino, K., “Elastic-plastic behavior of concrete filled square steel tubular beam-columns”. Trans. Arch. Inst. Japan, Vol. 280, 1979, pp. 111-120.
16. Mander, J.B., Priestly, M.N.J. and Park, R., “Theoretical stress-strain model for confined concrete”. Journal of Structural Engineering, ASCE, Vol. 114, No. 8, 1988, pp. 1804-1826. 17. Schneider, S.P., “Axially loaded concrete-filled steel tubes”. Journal of Structural Engineering,