LIST OF APPENDICES
APPENDIX A. LIST OF ABBREVIATIONS... 353 APPENDIX B. GLOSSARY OF STATISTICAL TESTS AND
TERMINOLOGY ... 355 APPENDIX C. TIMEFRAME OF STUDY... 359 APPENDIX D. MAPPINGS RELATED TO SURVEY... 361 APPENDIX E. SURVEY COVER LETTER AND QUESTIONNAIRE .... 373 APPENDIX F. ANALYSIS OF BEST PRACTICE SURVEY DATA... 379 APPENDIX G. PIP SAMPLE DOCUMENTS ... 395 APPENDIX H. SUMMARY OF PIP ASSESSMENT AND FINAL REPORTS
... 409 APPENDIX I. STATISTICAL TESTS RELATING TO PIP FIELD
EXPERIMENTS ... 431 APPENDIX J. QUANTITATIVE AND QUALITATIVE ANALYSIS
SUPPORTING DISCUSSION ... 451
Appendix A.
List of abbreviations
Table A.1 List of AbbreviationsAbbreviation Meaning
ABS Australian Bureau of Statistics ACS Australian Computer Society
ANZSIC Australian and New Zealand Standard Industrial Classification BSA Business Software Association
CBA CMM-based appraisal
CM Configuration management
CMM Capability Maturity Model
CMMI Capability Maturity Model Integrated COTS Commercial Off-the-Shelf
CSDP Certified Software Development Professional
EC European Commission
ESE Empirical Software Engineering ESI European Software Institute
ESSI European Systems and Software Initiative FDIS Final Draft International Standard
FTE Full Time Equivalent
GST Australian Government Goods and Service Taxation legislation ICT Information and Communication Technology
IEC International Electrotechnical Commission IIB Information Industries Board
IPI Internal Process Improvement
ISBSG International Software Benchmarking Standards Group
IS Information Systems
ISO International Organisation for Standardization MIS Management Information Systems M-W U Mann-Whitney U test
NIIP National Industry Improvement Program
PA Process attribute
PDTR Proposed Draft Technical Report
PE Process establishment
PIE Process Improvement Experiment PIP Process Improvement Program
PM Project management
PR Problem resolution
PSM Practical Software Measurement
QA Quality assurance
Qld Queensland
RAPID Rapid Assessments for Process Improvement for software Development
RE Requirements elicitation
RM Risk management
SADT Structured Analysis and Design Techniques SBPQ Software Best Practices Questionnaire
Appendix A
SEA Software Engineering Australia
SEAQ Software Engineering Australia – Queensland Branch SEI Software Engineering Institute
SME Small Medium Enterprise
SPA Software Process Assessment SPC Statistical Process Control
SPI Software Process Improvement
SPICE Software Process Improvement and Capability dEtermination SQA Software Quality Assurance
SQI Software Quality Institute
TR Technical Report
Appendix B.
Glossary of statistical tests and terminology
Data scale types. The statistical operations allowable on a given set of scores are dependent on the level of measurement achieved. The four levels of measurement are as follows: nominal (qualitative; categorical observations), ordinal (ranked categorical), interval (quantitative), and ratio (has true zero point) (Selvanathan et al. 2000, pp. 14-6; Siegel 1956).
p-value is the ‘probability that the observed data or data more extreme, given that the
null hypothesis is true, and the sampling was done randomly’ (Miller 2004, p. 185) and is referred in the statistical tables as p. The p-value is compared to the significance criterion α. In this study, α is set at 0.05. The null hypothesis is rejected if the p-value is less than α.
Independent groups t-test is used to confirm if interval or ratio data represents two populations. The t-test is a parametric test, and assumes the data is drawn from two independent groups and that the two populations have equal variances. Levene’s test is used to compare the variances of the two populations.
Normality is a prerequisite for some statistical tests. To test if the data arise from a normal distribution, the Shapiro-Wilks W-statistic is used if the sample size is <=50, and the Kolmogorov D statistic if the sample size is > 50 (Bonate 2000, p. 58; Coakes & Steed 1996).
An Outlier is an observation that is unusually small or unusually large (Selvanathan et al. 2000, p. 662). Observations with values between 1.5 and 3 box lengths from the upper or lower edge of the box are referred to as outliers. The box length is the interquartile range. Extremes are observations with values more than 3 box lengths from the upper or lower edge of the box. Source: SPSS Help (SPSS Inc. 2004)
The One-Way ANOVA procedure produces a one-way analysis of variance for a quantitative dependent variable by a single factor (independent) variable. Analysis of variance is used to test the hypothesis that several means are equal. This technique is an extension of the two-sample t test. In addition to determining that differences exist among the means, this test can identify which means differ. There are two types of tests for comparing means: a priori contrasts and post hoc tests. Contrasts are tests set up before running the experiment, and post hoc tests are run after the experiment has been conducted. Source: SPSS Help (SPSS Inc. 2004)
ANOVA was used to compare the adoption level of organisations within each industry sector. As population normality is a prerequisite assumption for analysis of variance, the calculation was performed separately for the non-COTS developers and for the COTS developers. As the second assumption for the ANOVA test is homogeneity of variance, Levene’s test was performed in each case.
Glossary of statistical tests and terminology
as the coefficient of concordance, which is a measure of agreement among raters. Each case is a judge or rater and each variable is an item or person being judged. For each variable, the sum of ranks is computed. Kendall's W ranges between 0 (no agreement) and 1 (complete agreement). Source: SPSS Help (SPSS Inc. 2004).
Wilcoxon signed ranks test is a paired-sample test. It is the non-parametric equivalent to the paired samples t-test. The only assumption is that the sample distributions are symmetric about the median and the number of tied ranks is small. The test involves calculating the difference scores from high to low, affixing the sign of each difference to the corresponding rank. In the case of tied ranks, the mean of the rank which would have been assigned to those observations had they not been tied, is used (Bonate 2000, p. 58; Selvanathan et al. 2000, p. 443). The Wilcoxon pretest/posttest was used for pair-wise comparisons to determine if a statistical difference exists between the capability levels at assessment and follow-up meeting.
The Mann-Whitney U test is used to determine whether two independent samples (groups) come from the same population. It is the most popular of the two-independent-samples tests. It is equivalent to the Wilcoxon rank sum test and the Kruskal-Wallis test for two groups. Mann-Whitney tests that two sampled populations are equivalent in location. The observations from both groups are combined and ranked, with the average rank assigned in the case of ties. The number of ties should be small relative to the total number of observations. If the populations are identical in location, the ranks should be randomly mixed between the two samples. The number of times a score from group 1 precedes a score from group 2 and the number of times a score from group 2 precedes a score from group 1 are calculated. The Mann-Whitney U statistic is the smaller of these two numbers. The Wilcoxon rank sum W statistic, also displayed, is the rank sum of the smaller sample. If both samples have the same number of observations, W is the rank sum of the group named. From SPSS Help (SPSS Inc. 2004). In some of the tables in this study, referred to as M-W U.
Pearson coefficient of correlation (also known as Pearson product-moment correlation) is a parametric test to measure the strength of association between two variables (Selvanathan et al. 2000) . The prerequisites are that the data must be collected from related pairs; the scale of measurement should be interval or ratio; scores within each variable should be normally distributed; the relationship between the 2 variables must be linear; the variability in scores for the variables is roughly the same (Coakes & Steed 1996, p. 49-50).
Spearman rank correlation coefficient (rho) is used to measure and test if a relationship exists between two variables (Selvanathan et al. 2000, p. 653). It is the non-parametric alternative to the parametric bivariate correlation (Pearson’s r) (Coakes & Steed 1996, p. 166). In this study, the Spearman rank correlation coefficient (rho) is labelled rs.
Discriminate function analysis is used to determine which continuous variables discriminate between two or more naturally occurring groups. It answers the question: can a combination of variables be used to predict group membership? In discriminant analysis, the independent variables are the predictors and the dependent variables are the groups. Usually, several variables are included in a study to see which ones contribute to the discrimination between groups. Wilks' lambda is used in an ANOVA (F) test of mean differences in discriminant analysis, such that the smaller the lambda for an independent variable, the more that variable contributes to the discriminant function. Lambda varies from 0 to 1, with 0 meaning group means differ (thus the more the variable differentiates the groups), and 1 meaning all group means are the same. The F test of Wilks' lambda shows which variables' contributions are significant. Variables should be continuous and normally distributed (Poulsen & French 2002).
Fisher’s exact probability test is useful for analysing either nominal or ordinal discrete data when the two independent samples are small in size. The test determines whether the two groups differ in the proportion with which they fall into the two classifications. Fisher’s exact test if used in this research to compare responses of high and low adopters.
Bonferroni correction method. The probability of committing a Type I error (falsely reject H0) increases with the number of tests. To overcome this risk, the
Appendix C.
Timeframe of study
Table C.1 List of research activities with start and end datesActivity From date To date
Literature Review Jul 1998 Nov 2004
Modify Questionnaire Sep 1998 Jan 1999
Pre-test, pilot test Dec 1998 Jan 1999
Mail out questionnaire Jan 1999 Jan 1999
Preliminary analysis of survey responses Feb 1999 Mar 1999 Prepare preliminary report for SEA’99 Apr 1999
Further survey analysis Jan 2000 Mar 2000
Prepare ASWEC paper Mar 2000 April 2000
Participate in PIP assessments Oct 1999 Dec 1999
Prepare PIP assessment reports Jan 2000 Mar 2000
Plan and conduct follow-up meetings June 2000 Aug 2000
Prepare final reports Aug 2000 Sep 2000
Preliminary analysis of four PIP firms Sep 2000 Dec 2000
Further analysis of survey data Jan 2001 Nov 2004
Further analysis of PIP reports Jan 2001 Nov 2004
Comparison survey and PIP results Jan 2001 Nov 2004
Appendix D.
Mappings related to survey
Table D.1 Mapping of Best Practice Survey Questions to ESI Questionnaire
ESSI ESI question ESI section New question for this research New section
Organisation Type General
Information
Deleted
Country General
Information
Deleted
Number of Employees General
Information
A4 Your Organisation A
Number of Employees involved in Software Engineering General Information
A5 Your Organisation A
Organisation primary involvement in software industry General Information
A3 Your Organisation A
Industrial Sector General
Information
A2 Your Organisation A
Community of Interest General
Information
Deleted
A1 Contact information Your Organisation A
A6 Your Organisation A
A7 Your Organisation A
1.1 1.1 Does each software project have a nominated software project manager?
Organisational Issues
1 5.1 Project
Management & Training
5
1.2 1.2 Does the software project manager report to a business project manager responsible for the overall benefit of the project to the business?
Organisational Issues
1 5.2 Project
Management & Training
5
1.3 1.3 Does a Software Quality Assurance (SQA) function exist within an independent reporting line from software
Organisational Issues
1 5.3 Does a Software Quality Assurance (SQA) function exist?
Project
Mappings related to survey
ESSI ESI question ESI section New question for this research New section
line from the software development project management? 1.4 1.4 Is a change control function established for each
software project?
Organisational Issues
1 3.1 Configuration
Management
5
1.5 1.5 Is there a required training programme for all newly-appointed software managers which is designed to
familiarise them with in-house software project management procedures?
Organisational Issues
1 5.9 Project
Management & Training
5
1.6 1.6 Is there a procedure for maintaining awareness of the state-of-the-art in CASE or software engineering
technology?
Organisational Issues
1 5.10 Project
Management & Training
5
1.7 1.7 Is there a procedure for ensuring that appropriate levels of user/customer/marketing input is made throughout the project?
Organisational Issues
1 1.1 Requirements and
Design
1
1.8 (1.8) Where other non-software resources are critical to the success of the project is there a procedure for ensuring their availability according to plan?
Organisational Issues
1 4.9 Estimates and
Schedules
4
2.01 2.1 Do management formally assess the benefits, viability, and risk of each software project prior to making
contractual (or internal) commitments?
Standards and Procedures
2 5.4 Project
management & Training
5
2.02 2.2 Do management formally conduct periodic reviews of the status of each software project?
Standards and Procedures
2 5.6 Project
Management & Training
5
2.03 (2.3) Are there procedures to ensure that external software subcontracting organisations, if any, follow a disciplined software development process?
Standards and Procedures
2 (5.5) Project
Management & Training
5
2.04 2.4 For each project, are independent audits (such as inspections or walkthroughs) conducted for each major stage in the software development process?
Standards and Procedures
2 5.7 Project
Management & Training
5
ESSI ESI question ESI section New question for this research New section
project? Procedures
2.06 2.6 Is there a documented procedure for estimating software size (such as ‘Lines of Source Code’) and thus for using productivity measures?
Standards and Procedures
2 4.1 Estimates and
Schedules
4
2.07 2.7 Is a formal procedure used to produce software development effort, schedule, and cost estimates?
Standards and Procedures
2 4.2 Estimates and
Schedules
4
2.08 2.8 Is a formal procedure (such as a review or handover with sign-off) used whenever a deliverable (such as a user statement of requirements or system requirements) is passed from one discrete group to another (e.g. user to analyst to designer) to ensure it is properly understood?
Standards and Procedures
2 5.8 Project
Management & Training
5
2.09 (2.9) Is there a procedure to ensure that the systems projects selected for development qualitatively or
quantitatively support/alleviate the organisation's business objective/problems?
Standards and Procedures
2 (1.2) Requirements and
Design
1
2.10 (2.10) Are there procedures to ensure that the functionality, strengths, and weaknesses of the ‘system’ which the software is replacing are formally reviewed?
Standards and Procedures
2 1.4 Requirements and
Design
1
2.11 2.11 Does test planning commence prior to programming beginning based on the user requirements and high-level design documents?
Standards and Procedures
2 2.2 Code and Test 2
2.12 2.12 Is independent testing conducted by users (or appropriate representatives) under the guidance of Software Quality Assurance before any system or enhancement goes live?
Standards and Procedures
2 2.5 Is independent testing conducted by users (or appropriate representatives) before any system or enhancement goes live?
If YES, is it under the guidance of Software Quality Assurance?
Code and Test 2
Mappings related to survey
ESSI ESI question ESI section New question for this research New section
for live operation and that no changes are made directly to a ‘live’ version of any system (other than through
modification to its development version)?
passing user acceptance testing is the same as that which is
implemented for live operation? Is there a procedure to check that no changes are made directly to a ‘live’ version of any system (other than through modification to its development version)? 3.1 3.1 Are records of actual project resourcing and timescales
versus estimates maintained (at individual
resource/resource-type level) and regularly analysed/fed-back into the estimating and scheduling procedures?
Metrics 3 4.3 Estimates and
Schedules 4
3.2 (3.2) Are records of software size maintained for each software configuration item, over time, and fed-back into the estimating process?
Metrics 3 (4.4) Estimates and
Schedules 4
3.3 3.3 Are statistics on the sources of errors in software code gathered and analysed for their cause, detection and avoidance measures?
Metrics 3 2.12 Code and Test 2
3.4 3.4 Are statistics on test efficiency (% of errors actually detected by an activity against the maximum theoretically possible) gathered and analysed for all testing stages in the development process?
Metrics 3 2.9 Are statistics on test efficiency (eg. % of errors actually detected by an activity against the maximum
theoretically possible) gathered and analysed for all testing stages in the development process?
Code and Test 2
3.5 3.5 Is project tracking (e.g. earned value) used throughout the software development process (actual versus planned deliverables analyses, designed, unit tested, system tested, acceptance tested over time) to monitor project progress?
Metrics 3 4.5 Estimates and
Schedules
4
3.6 (3.6) Are estimates made and compared with actuals for target computer performance (e.g. memory utilisation,
ESSI ESI question ESI section New question for this research New section processor throughput and file/channel I/O and disk usage)?
3.7 3.7 Are post-implementation software problem reports logged and their resolution effectively tracked and analysed?
Metrics 3 2.10 Code and Test 2
3.8 3.8 Do records exist from which (and requiring nothing extra) all current versions and variants of software systems and their components can be quickly and accurately reconstructed in the development environment?
Metrics 3 2.11 Code and Test 2
4.1 4.1 Are estimates, schedules and subsequent changes produced only by the project managers who directly control the project resources and are fully aware of their abilities and availabilities?
Control of the Development Process
4 4.6 Estimates and
Schedules
4
4.2 4.2 Does the overall business project manager gain
agreement and sign-off from all parties who have produced detailed estimates and schedules before publishing or revising a consolidated project plan?
Control of the Development Process
4 4.8 Estimates and
Schedules
4
4.3 4.3 Is there a procedure for controlling changes to the software requirements, designs and accompanying
documentation?
Control of the Development Process
4 3.2 Configuration
Management
3
4.4 4.4 Is there a procedure for controlling changes to the code and specifications?
Control of the Development Process
4 3.3 Configuration
Management
3
4.5 4.5 Is there a procedure for assuring that regression testing (i.e. the forced re-run of all previous tests prior to any new tests) is routinely performed during and after initial implementation?
Control of the Development Process
4 2.7 Code and Test 2
4.6 4.6 Do procedures exist to ensure that every required function is tested/verified?
Control of the Development Process
Mappings related to survey
ESSI ESI question ESI section New question for this research New section
designs through to code?
5.2 5.2 Are design notations such as Structured Analysis and Design Technique used in program design?
Tools and Technology
5 1.3 Requirements and
Design
1
5.3 5.3 Are automated testing tools used (for example for capturing and replaying tests, or for ensuring logic paths coverage)?
Tools and Technology
5 Included in new Q 2.3 Code and Test 2
5.4 5.4 Are software tools used for tracking and reporting the status of the software/subroutines in the software
development library?
Tools and Technology
5 3.5 Are software tools used for tracking and reporting the status (eg. reviewed, tested, released) of the software/subroutines in the software development library?
Configuration Management
3
5.5 5.5 Are prototyping methods used in ensuring the requirements elements of the software?
Tools and Technology
5 1.5 Requirements and
Design
1
5.6 (5.6) Is a data dictionary available for controlling and storing details of all data files and their fields?
Tools and Technology
5 (1.6) Requirements and
Design
1
5.7 5.7 Are software tools used for project planning, estimating, scheduling, and critical path analysis?
Tools and Technology
5 4.7 Estimates &
Schedules
4
2.1 Programming languages used Code & Test 2 2.3 Development tools used Code & Test 2 6.1 Which aspects of your
software development activities have the most for improvement?
How can we help you?
6
6.2 How can SEA help you achieve those improvements?
How can we help you?
6
Table D.2 Mapping of ANZSIC division codes to industry sectors used by ESI
ANZSIC Code ANZSIC Division ESI Industry sectors A Agriculture, forestry & fishing Agriculture & forestry
Fishing
B Mining Mining & quarrying
C Manufacturing 17 manufacturing industries
D Electricity, gas & water supply Energy production & distribution; gas & water supply
E Construction Construction & building
F Wholesale trade Wholesale & retail trade; repair of goods
G Retail trade
H Accommodation, cafes & restaurants Lodging & restaurants I Transport & storage Transportation services J Communication services Post & telecommunications
Publishing, printing and reproduction of recorded media K Finance & insurance Finance & insurance
L Property & business services Business, legal and management consultancy; holdings Real estate activities
Renting & leasing M Government administration & defence
N Education Education
O Health & community services Community service activities Health & social work
P Cultural & recreational services Recreational, cultural and sporting activities Q Personal & other services
6 IT activities
Technical testing & analysis
Recycling
Mappings related to survey
Table D.3 Mapping of Best Practice Survey to ISO/IEC TR 15504 and RAPID model
Section 1—Requirements and Design ISO/IEC 15504 RAPID
1.1 Is there a procedure for ensuring that appropriate levels of user/customer/marketing input are made throughout the project?
CUS.3 Requirements elicitation
RE
1.2 Is there a procedure to ensure that the systems projects selected for development qualitatively or quantitatively support/alleviate the organisation’s business objective/problems?
CUS.1.1 Acquisition preparation
No
1.3 Are design notations such as Structured Analysis and Design Technique used in program design? ENG.1.3 Software design SD 1.4 Are there procedures to ensure that the functionality, strengths, and weaknesses of the ‘system’ which the
software is replacing are formally reviewed?
No No
1.5 Are prototyping methods used in ensuring the requirements elements of the software? ENG.1.1 Systems
requirements analysis and design
SD
1.6 Is a data dictionary available for controlling and storing details of all data files and their fields? ENG.1.3 Software design SD
Section 2—Code and Test ISO/IEC 15504 RAPID
2.2 Does test planning commence prior to programming beginning based on the user requirements and high-level design documents?
ENG.1.6 Software testing SD
2.4 Are common coding standards applied to each software project? ENG.1.4 Software construction
SD
2.5a Is independent testing conducted by users (or appropriate representatives) before any system or enhancement goes live?
ENG.1.5 Software integration SD
2.5b If YES, is it under the guidance of Software Quality Assurance? SUP.3 Quality assurance QA 2.6a Is there a procedure to check that the system configuration (i.e. the programs and any data) passing user
acceptance testing is the same as that which is implemented for live operation?
SUP.2 Configuration management
CM
2.6b Is there a procedure to check that no changes are made directly to a ‘live’ version of any system (other than through modification to its development version)?
SUP.2 Configuration management
CM
2.7 Is there a procedure for assuring that regression testing (i.e. the forced re-run of all previous tests prior to any new tests) is routinely performed during and after initial implementation?
ENG.1.6 Software testing SD
2.8 Are estimates made and compared with actuals for target computer performance (e.g. memory utilisation, processor throughput and file/channel I/O and disk usage)?
MAN.3 Quality management No
2.9 Are statistics on test efficiency (eg. % of errors actually detected by an activity against the maximum theoretically possible) gathered and analysed for all testing stages in the development process?
Section 2—Code and Test (continued) ISO/IEC 15504 RAPID 2.10 Are post-implementation software problem reports logged and their resolution effectively tracked and
analysed?
SUP.8 Problem resolution PR
2.11 Do records exist from which (and requiring nothing extra) all current versions and variants of software systems and their components can be quickly and accurately reconstructed in the development environment?
SUP.2 Configuration management
CM
2.12 Are statistics on the sources of errors in software code gathered and analysed for their cause, detection and avoidance measures?
SUP.4 Verification No
2.13 Do procedures exist to ensure that every required function is tested/verified? SUP.4 Verification No
Section 3—Configuration Management ISO/IEC 15504 RAPID
3.1 Is a change control function established for each software project? SUP.2 Configuration management
CM
3.2 Is there a procedure for controlling changes to the software requirements, designs and accompanying documentation?
SUP.2 Configuration management
CM
3.3 Is there a procedure for controlling changes to the code and specifications? SUP.2 Configuration management
CM
3.4 Are software tools used to assist in forwards and/or backwards tracing of software requirements to software designs through to code?
ENG.1 Development SD
3.5 Are software tools used for tracking and reporting the status (eg. reviewed, tested, released) of the software/subroutines in the software development library?
SUP.2 but not software tools CM
Section 4—Estimates and Schedules ISO/IEC 15504 RAPID
4.1 Is there a documented procedure for estimating software size (such as ‘Lines of Source Code’) and thus for using productivity measures?
MAN.2 Project management PM
4.2 Is a formal procedure used to produce software development effort, schedule, and cost estimates? MAN.2 Project management PM 4.3 Are records of actual project resourcing and timescales versus estimates maintained (at individual
resource/resource-type level) and regularly analysed/fed-back into the estimating and scheduling procedures?
MAN.2 Project management – first part
PM
4.4 Are records of software size maintained for each software configuration item, over time, and fed-back into the estimating process?
SUP.2 Configuration management
CM
4.5 Is project tracking (e.g. earned value) used throughout the software development process (actual versus planned deliverables analyses, designed, unit tested, system tested, acceptance tested over time) to monitor project progress?
Mappings related to survey
Section 4—Estimates and Schedules (continued) ISO/IEC 15504 RAPID
4.7 Are software tools used for project planning, estimating, scheduling, and critical path analysis? MAN.2 Project management PM 4.8 Does the overall business project manager gain agreement and sign-off from all parties who have produced
detailed estimates and schedules before publishing or revising a consolidated project plan?
MAN.2 Project management PM
4.9 Where other non-software resources are critical to the success of the project is there a procedure for ensuring their availability according to plan?
MAN.2 Project management PM
Section 5—Project Management & Training ISO/IEC 15504 RAPID
5.1 Does each software project have a nominated software project manager? MAN.2 Project management PM 5.2 Does the software project manager report to a business project manager responsible for the overall benefit of the
project to the business?
MAN.2 Project management PM
5.3a Does a Software Quality Assurance (SQA) function exist? SUP.3 Quality assurance QA 5.3b If YES, does the SQA function have an independent reporting line from software development project
management?
SUP.3 Quality assurance QA
5.4 Do management formally assess the benefits, viability, and risk of each software project prior to making contractual (or internal) commitments?
MAN.2 Project management PM
5.5 Are there procedures to ensure that external software subcontracting organisations, if any, follow a disciplined software development process?
CUS.1.3 Supplier monitoring No
5.6 Do management formally conduct periodic reviews of the status of each software project? MAN.2 Project management PM 5.7 For each project, are independent audits (such as inspections or walkthroughs) conducted for each major stage
in the software development process?
SUP.3 Quality assurance QA
5.8 Is a formal procedure (such as a review or handover with sign-off) used whenever a deliverable (such as a user statement of requirements or system requirements) is passed from one discrete group to another (e.g. user to analyst to designer) to ensure it is properly understood?
SUP.3 Quality assurance QA
5.9 Is there a required training programme for all newly-appointed software managers which is designed to familiarise them with in-house software project management procedures?
ORG.3 Human resource management
No
5.10 Is there a procedure for maintaining awareness of the state-of-the-art in CASE or software engineering technology?
Table D.4 ISO/IEC 15504 Processes Process
group
Basic processes Component processes
Primary life cycle processes
CUS.1 Acquisition CUS 1.1 Acquisition preparation CUS 1.2 Supplier selection CUS 1.3 Supplier monitoring CUS 1.4 Customer acceptance CUS.2 Supply
CUS.3 Requirements elicitation
CUS.4 Operation CUS 4.1 Operational use Customer
CUS 4.2 Customer support
ENG.1 Development ENG 1.1 System requirements analysis and design
ENG 1.2 Software requirements analysis ENG 1.3 Software design
ENG 1.4 Software construction ENG 1.5 Software integration ENG 1.6 Software testing
ENG 1.7 System integration and testing Engineering
ENG.2 System and software maintenance
Supporting life cycle processes SUP.1 Documentation
SUP.2 Configuration management SUP.3 Quality assurance
SUP.4 Verification SUP.5 Validation SUP.6 Joint review SUP.7 Audit Support
SUP.8 Problem resolution Organisational life cycle processes
MAN.1 Management MAN.2 Project management MAN.3 Quality management Management
MAN.4 Risk management ORG.1 Organisational alignment
ORG.2 Improvement ORG 2.1 Process establishment ORG 2.2 Process assessment ORG 2.3 Process improvement ORG.3 Human resource
management
ORG.4 Infrastructure ORG.5 Measurement Organisation
ORG.6 Reuse
Appendix E.
Survey Cover Letter and Questionnaire
Software Development Manager Company
Street Suburb
State Postcode
Dear Sir/Madam
Software Engineering Australia is undertaking an industry improvement program for the software industry. The goal of the initiative is to improve the capability and competitiveness of the Australian software development industry. In the first phase of the program, the level of use of widely-recognised best practices in the software industry will be established through the use of the accompanying survey. The survey, developed by the European Software Institute has been adapted for use in Australia to enable us to tailor the program to industry's needs. Analysis of the survey results will enable a comparison of local industry with international developers, and the identification of potential candidates for improvement projects.
I would appreciate it if you could use a small amount of your valuable time to respond to the survey. The survey is being sent to all commercial software developers and the large organisations involved in software development in Queensland. Total confidentiality is assured. The results will be summarised; individual responses will not be published. After the responses have been analysed, a summary report will be mailed to all respondents.
The survey has been designed to minimise the time demands on participants, and mostly requires indicating a response by placing a tick in the appropriate box. It should take around 10 minutes to fill out. I would appreciate your completing the survey and returning it in the reply-paid envelope by 30 January 1999.
Should you have any queries about this survey, please do not hesitate to contact me on (07) 3236 1111.
Thank you for your participation.
Phil Scanlan
Appendix F.
Analysis of best practice survey data
Table F.1 Industry sectors of respondent organisationsSector name Sector code Frequency Percent
Software development 0 156 76.8
Agriculture, forestry & fishing 1 2 1.0
Mining 2 2 1.0
Manufacturing 3 5 2.5
Utilities 4 5 2.5
Construction 5 1 .5
Retail & wholesale 6 1 .5
Accommodation, cafes & restaurants 7 0 0
Transport & storage 8 0 0
Communication services & media 9 2 1.0
Finance & insurance 10 2 1.0
Property & business services 11 1 .5
Government, Administration & Defence 12 5 2.5
Education 13 7 3.4
Health & community service 14 3 1.5
Cultural & recreational services 15 1 .5
Personal & other services 16 0 0
Tourism & hospitality 17 0 0
Information technology 18 10 4.9
[image:29.595.119.471.113.418.2]Total 203 100.0
Table F.2 Programming languages used now and planned for future
Language Now Next 12 months Trend
Frequency % Frequency % %
VB 87 42.9 74 36.5 -6
Ms-Access 74 36.5 57 28.1 -8
Other 68 33.5 33 16.3 -17
C++ 64 31.5 54 26.6 -5
SQL 64 31.5 53 26.1 -5
C 47 23.2 32 15.8 -7
Java 35 17.2 53 26.1 9
Delphi 32 15.8 22 10.8 -5
Oracle 31 15.3 24 11.8 -3
COBOL 14 6.9 9 4.4 -2
Powerbuild 10 4.9 4 2.0 -3
PL/I 2 1.0 0 0.0 -1
Analysis of best practice survey data
Table F.3 Other programming languages in use
Programming language or tool Frequency Percent
Assembler 6 2.9%
Autodesk Autocad ARX or Lisp 3 1.5%
CA Visual Objects 6 2.9%
Centura 2 1.0%
Clarion 5 2.4%
Clipper 2 1.0%
Fortran 2 1.0%
FoxPro and/or Visual FoxPro 5 2.4%
Informix 4 2.0%
Perl 6 2.9%
RPG 2 1.0%
Paradox 2 1.0%
CA Open Road 2 1.0%
Progress 3 1.5%
Dbase III or IV 3 1.5%
Director Lingo 2 1.0%
MapBasic 2 1.0%
Dataflex 2 1.0%
Pascal 2 1.0%
ABAP/4 2 1.0%
ASP-Jscript 2 1.0%
HTML, MTML, DHTML 3 1.5%
Advanced Revelation and OpenInsight 2 1.0%
MS-Basic & QBasic 2 1.0%
Various un-named 2 1.0%
The following languages were each reported by 1 respondent:
4th Dimension (www.4d.com); Abane IV; Asymetrix Toolbook (www.asymetrix.com); Excel, FilePro; FilemakerPro; Forth (www.forth.com); How; Ingres; Interbase PL/SQL; Javascript; Lotus Notes; Modula Embedded; Paxus RT86; Sybase Power++; Pick; RolePlaying Game (RPG) Director (Macromedia); SQLWindows; TCL?TK; GE Smallworld Magik.
Note: Respondents were invited to record any other programming languages used now and expected to be used in the next 12 months. Although many respondents chose to record the names of the programming language, they did not consistently tick the check boxes to indicate if usage was current or planned for the future. Therefore, interpretation of the use of these languages in 12 months time is not possible.
Table F.4 Development tools used now and planned to use in the next 12 months
Tools Now Next 12 Months Trend
Frequency % Frequency %
Staff time-sheet system 69 34.0 38 18.7 -15
Source code control 51 25.1 54 26.6 1
3rd party reusable components 49 24.1 35 17.2 -7
Defect tracking 24 11.8 20 9.9 -2
Other 21 10.3 8 3.9 -6
Auto code analysis 12 5.9 13 6.4 0
Automated test capture 5 2.5 11 5.4 3
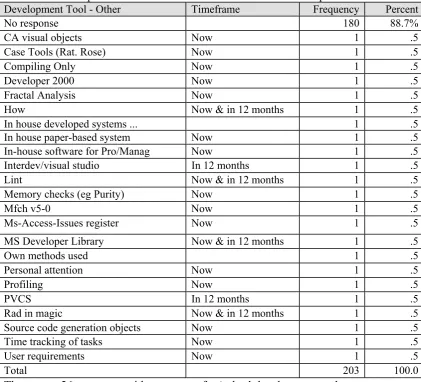
Table F.5 Development tools – recorded comments for ‘other’ response
Development Tool - Other Timeframe Frequency Percent
No response 180 88.7%
CA visual objects Now 1 .5
Case Tools (Rat. Rose) Now 1 .5
Compiling Only Now 1 .5
Developer 2000 Now 1 .5
Fractal Analysis Now 1 .5
How Now & in 12 months 1 .5
In house developed systems ... 1 .5
In house paper-based system Now 1 .5
In-house software for Pro/Manag Now 1 .5
Interdev/visual studio In 12 months 1 .5
Lint Now & in 12 months 1 .5
Memory checks (eg Purity) Now 1 .5
Mfch v5-0 Now 1 .5
Ms-Access-Issues register Now 1 .5
MS Developer Library Now & in 12 months 1 .5
Own methods used 1 .5
Personal attention Now 1 .5
Profiling Now 1 .5
PVCS In 12 months 1 .5
Rad in magic Now & in 12 months 1 .5
Source code generation objects Now 1 .5
Time tracking of tasks Now 1 .5
User requirements Now 1 .5
Total 203 100.0
Analysis of best practice survey data
Table F.6 Mean adoption level and number of responses for each practice
Question item Yes No Not
applicable
Missing Mean Practice Adoption Level Section 1—Requirements and Design
1.1 Is there a procedure for ensuring that appropriate levels of user/ customer/ marketing input is made throughout the project?
169 32 0 2 84.08%
1.2 Is there a procedure to ensure that the systems projects selected for development qualitatively or quantitatively support/alleviate the organisation’s business
objective/problems?
117 34 47 52 77.48%
1.3 Are design notations such as Structured Analysis and Design Technique used in program design?
101 98 0 4 50.75%
1.4 Are there procedures to ensure that the functionality, strengths, and weaknesses of the ‘system’ which the software is replacing are formally reviewed?
96 57 46 50 62.75%
1.5 Are prototyping methods used in ensuring the requirements elements of the software? 154 43 0 6 78.17% 1.6 Is a data dictionary available for controlling and storing details of all data files and their
fields?
116 55 26 32 67.84%
Section 2—Code and Test
2.2 Does test planning commence prior to programming beginning based on the user requirements and high-level design documents?
86 111 0 6 43.65%
2.4 Are common coding standards applied to each software project? 157 40 0 6 79.70%
2.5a Is independent testing conducted by users (or appropriate representatives) before any system or enhancement goes live?
162 40 0 1 80.20%
2.5b If YES, is it under the guidance of Software Quality Assurance? 35 118 0 50 22.88% 2.6a Is there a procedure to check that the system configuration (i.e. the programs and any
data) passing user acceptance testing is the same as that which is implemented for live operation?
124 74 0 5 62.63%
2.6b Is there a procedure to check that no changes are made directly to a ‘live’ version of any system (other than through modification to its development version)?
117 74 0 12 61.26%
2.7 Is there a procedure for assuring that regression testing (i.e. the forced re-run of all previous tests prior to any new tests) is routinely performed during and after initial implementation?
Question item Yes No Not
applicable Missing Adoption Level Mean Practice 2.8 Are estimates made and compared with actuals for target computer performance (e.g.
memory utilisation, processor throughput and file/channel I/O and disk usage)? 47 86 69 70 35.34% 2.9 Are statistics on test efficiency (eg. % of errors actually detected by an activity against the
maximum theoretically possible) gathered and analysed for all testing stages in the development process?
21 177 0 5 10.61%
2.10 Are post-implementation software problem reports logged and their resolution effectively tracked and analysed?
153 48 0 2 76.12%
2.11 Do records exist from which (and requiring nothing extra) all current versions and variants of software systems and their components can be quickly and accurately reconstructed in the development environment?
130 69 0 4 65.33%
2.12 Are statistics on the sources of errors in software code gathered and analysed for their cause, detection and avoidance measures?
36 163 0 4 18.09%
2.13 Do procedures exist to ensure that every required function is tested/verified? 107 91 0 5 54.04% Section 3—Configuration Management
3.1 Is a change control function established for each software project? 91 109 0 3 45.50% 3.2 Is there a procedure for controlling changes to the software requirements, designs and
accompanying documentation?
116 86 0 1 57.43%
3.3 Is there a procedure for controlling changes to the code and specifications? 117 82 0 4 58.79% 3.4 Are software tools used to assist in forwards and/or backwards tracing of software
requirements to software designs through to code?
40 160 0 3 20.00%
3.5 Are software tools used for tracking and reporting the status (eg. reviewed, tested, released) of the software/subroutines in the software development library?
39 161 0 3 19.50%
Section 4—Estimates and Schedules
4.1 Is there a documented procedure for estimating software size (such as ‘Lines of Source Code’) and thus for using productivity measures?
24 177 0 2 11.94%
4.2 Is a formal procedure used to produce software development effort, schedule, and cost estimates?
Analysis of best practice survey data
Question item Yes No Not
applicable Missing Adoption Level Mean Practice and scheduling procedures?
4.4 Are records of software size maintained for each software configuration item, over time, and fed-back into the estimating process?
24 175 0 4 12.06%
4.5 Is project tracking (e.g. earned value) used throughout the software development process (actual versus planned deliverables analyses, designed, unit tested, system tested, acceptance tested over time) to monitor project progress?
66 134 0 3 33.00%
4.6 Are estimates, schedules and subsequent changes produced only by the project managers who directly control the project resources and are fully aware of their abilities and
availabilities?
117 83 0 3 58.50%
4.7 Are software tools used for project planning, estimating, scheduling, and critical path analysis?
87 114 0 2 43.28%
4.8 Does the overall business project manager gain agreement and sign-off from all parties who have produced detailed estimates and schedules before publishing or revising a consolidated project plan?
80 116 0 7 40.82%
4.9 Where other non-software resources are critical to the success of the project is there a procedure for ensuring their availability according to plan?
65 42 92 96 60.75%
Section 5—Project Management & Training
5.1 Does each software project have a nominated software project manager? 175 26 0 2 87.06% 5.2 Does the software project manager report to a business project manager responsible for the
overall benefit of the project to the business?
110 88 0 5 55.56%
5.3 Does a Software Quality Assurance (SQA) function exist? 47 154 0 2 23.38%
5.3 b If 5.3 YES, does the SQA function have an independent reporting line from software development project management?
14 29 0 160 32.56%
5.4 Do management formally assess the benefits, viability, and risk of each software project prior to making contractual (or internal) commitments?
138 63 0 2 68.66%
5.5 Are there procedures to ensure that external software subcontracting organisations, if any,
follow a disciplined software development process? 52 42 108 109 55.32%
Question item Yes No Not
applicable Missing Adoption Level Mean Practice for each major stage in the software development process?
5.8 Is a formal procedure (such as a review or handover with sign-off) used whenever a deliverable (such as a user statement of requirements or system requirements) is passed from one discrete group to another (e.g. user to analyst to designer) to ensure it is properly
understood?
77 123 0 3 38.50%
5.9 Is there a required training programme for all newly-appointed software managers which is designed to familiarise them with in-house software project management procedures?
42 154 0 7 21.43%
5.10 Is there a procedure for maintaining awareness of the state-of-the-art in CASE or software engineering technology?
42 158 0 3 21.00%
Total of 44 questions 3909 4275 388 748 47.76%
Analysis of best practice survey data
Table F.7 Adoption level of each practice – characteristics of distribution
Statistics Value Std. Error
Mean 47.7970 3.36379
95% Confidence interval for mean Lower bound 41.0133
Upper bound 54.5808
5% Trimmed mean 47.7507
Median 48.1250 Variance 497.863
Standard deviation 22.31284
Minimum 10.61 Maximum 87.06 Range 76.45
Interquartile range 36.5725
Skewness .004 .357
Kurtosis -1.167 .702
Table F.8 Adoption level of each practice - tests of normality
Kolmogorov-Smirnov(a) Shapiro-Wilks
Statistic df p Statistic df p Practice Adoption Level .090 44 .200(*) .955 44 .083 * This is a lower bound of the true significance.
Table F.9 Extent of adoption of each practice ranked in descending order
Practices adopted by 75-100% of organisations N % Each software project has a nominated software project manager 201 87.06 There a procedure for ensuring that appropriate levels of
user/customer/marketing input is made throughout the project
201 84.08
Independent testing is conducted by users before any system or enhancement goes live
202 80.20
Common coding standards are applied to each software project 197 79.70 Prototyping methods are used in ensuring the requirements elements of the
software
197 78.17
There a procedure to ensure that the systems projects selected for development qualitatively or quantitatively support/alleviate the organisation’s business objective/problems
151 77.48
Post-implementation software problem reports are logged and their resolution effectively tracked and analysed
201 76.12
Practices adopted by 50-74.9% of organisations N %
Management formally conducts periodic reviews of the status of each software project
203 74.38
Management formally assesses the benefits, viability, and risk of each software project prior to making contractual (or internal) commitments
201 68.66
A data dictionary available for controlling and storing details of all data files and their fields
171 67.84
Records exist from which (and requiring nothing extra) all current versions and variants of software systems and their components can be quickly and
accurately reconstructed in the development environment
199 65.33
Procedures exist to ensure that the functionality, strengths, and weaknesses of the ‘system’ which the software is replacing are formally reviewed
153 62.75
There is a procedure to check that the system configuration (i.e. the programs and any data) passing user acceptance testing is the same as that which is implemented for live operation
198 62.63
There is a procedure to check that no changes are made directly to a ‘live’ version of any system (other than through modification to its development version)
191 61.26
Where other non-software resources are critical to the success of the project, there is a procedure for ensuring their availability according to plan
107 60.75
There is a procedure for controlling changes to the code and specifications 199 58.79 Estimates, schedules and subsequent changes are produced only by the project
managers who directly control the project resources and are fully aware of their abilities and availabilities
200 58.50
There is a procedure for controlling changes to the software requirements, designs and accompanying documentation
202 57.43
The software project manager reports to a business project manager responsible
for the overall benefit of the project to the business 198 55.56 There are procedures to ensure that external software subcontracting
organisations, if any, follow a disciplined software development process
94 55.32
Procedures exist to ensure that every required function is tested/verified 198 54.04 Design notations such as Structured Analysis and Design Technique are used in
program design
Analysis of best practice survey data
Practices adopted by 25-50% of organisations N %
A change control function is established for each software project 200 45.50 Test planning commences prior to programming beginning based on the user
requirements and high-level design documents
197 43.65
Software tools used for project planning, estimating, scheduling, and critical path analysis
201 43.28
The overall business project manager gains agreement and sign-off from all parties who have produced detailed estimates and schedules before publishing or revising a consolidated project plan
196 40.82
A formal procedure (such as a review or handover with sign-off) is used whenever a deliverable (such as a user statement of requirements or system requirements) is passed from one discrete group to another (e.g. user to analyst to designer) to ensure it is properly understood
200 38.50
A formal procedure is used to produce software development effort, schedule, and cost estimates
202 38.12
Estimates are made and compared with actuals for target computer performance (memory utilisation, processor throughput and file/channel I/O and disk usage)
133 35.34
For each project, independent audits (such as inspections or walkthroughs) are conducted for each major stage in the software development process
202 34.65
Records of actual project resourcing and timescales versus estimates maintained (at individual resource/resource-type level) and regularly analysed/fed-back into the estimating and scheduling procedures
201 33.33
Project tracking (e.g. earned value) is used throughout the software
development process (actual versus planned deliverables analyses, designed, unit tested, system tested, acceptance tested over time) to monitor project progress
200 33.00
The SQA function has an independent reporting line from software development project management
43 32.56
There is a procedure for assuring that regression testing (i.e. the forced re-run of all previous tests prior to any new tests) is routinely performed during and after initial implementation
199 26.63
Practices adopted by 0-25% of organisations N %
A Software Quality Assurance (SQA) function exists 201 23.38 Independent testing is under the guidance of Software Quality Assurance 153 22.88 There is a required training programme for all newly-appointed software
managers which is designed to familiarise them with in-house software project management procedures
196 21.43
There a procedure for maintaining awareness of the state-of-the-art in CASE or
software engineering technology 200 21.00
Software tools used to assist in forwards and/or backwards tracing of software requirements to software designs through to code
200 20.00
Software tools are used for tracking and reporting the status (reviewed, tested, released) of the software/subroutines in the software development library
200 19.50
Statistics on the sources of errors in software code gathered and analysed for their cause, detection and avoidance measures
199 18.09
Records of software size are maintained for each software configuration item, over time, and fed-back into the estimating process
199 12.06
There is a documented procedure for estimating software size (such as ‘Lines of Source Code’) and thus for using productivity measures
201 11.94
Statistics on test efficiency (eg. % of errors actually detected by an activity against the maximum theoretically possible) are gathered and analysed for all testing stages in the development process
Table F.10 Comparison of adoption of primary life cycle practices compared to organisation/support practices
Life cycle group N Mean Std. deviation Std. error mean
Primary 13 56.7062 24.94557 6.91866
Organisation/support 31 44.0610 20.39296 3.66268
Table F.11 Adoption of primary life cycle practices compared to support/ organisational practices - independent samples test
Levene's test for equality of variances
t-test for equality of means
F p t df p
(2-tailed)
Mean difference
Std. error difference
95% confidence interval of the
difference
Equal variances assumed Lower Upper
.739 .395 1.756 42 .086 12.6452 7.20030 -1.88561 27.17598 Equal variances not assumed
1.615 19.07 .123 12.6452 7.82835 -3.73569 29.02607
Table F.12 Organisation adoption level - skewness and kurtosis
Developer Group Skewness Kurtosis
Does not develop COTS .18 -.55
COTS software developer .11 -.89
Note: values for skewness and kurtosis are zero if the observed distribution is exactly normal.
Table F.13 Comparison adoption level of COTS and non-COTS developers - test of homogeneity of variance
Adoption level Levene statistic df1 df2 p
Based on mean .493 1 201 .483
Based on median .478 1 201 .490
Based on median and with adjusted df .478 1 200.827 .490
Based on trimmed mean .509 1 201 .477
Table F.14 Adoption level of COTS developers compared to non-COTS developers
Analysis of best practice survey data
Table F.15 Independent samples test comparing adoption level of COTS with non-COTS developers
Levene's test for equality of variances
t-test for equality of means
F p t df p
(2-tail) Mean Difference Std. Error Difference 95% Confidence Interval of the
Difference
Equal variances assumed Lower Upper
.493 .483 -2.726 201 .007 -7.9952 2.93302 -13.77860 -2.21172 Equal variances not assumed
-2.704 179.67 .008 -7.9952 2.95643 -13.82895 -2.16136
87 116 N = COTS Dev 1 0 TO TA L E M P 80000 60000 40000 20000 0 -20000 148 180 68 154 123 197 167 121 165 38 29 44 39 199 186 80 160 176 163 157 128 170 153 120 166 172 192 189 119 169 164 171
Non-COTS COTS
Figure F-1 Box plot comparison of number of employees for non-COTS and COTS developers
Table F.16 Correlation: total number of employees and adoption level
Statistic All
responses
Non-COTS total employees COTS total employees
All cases All
cases
Excluding 2 outliers
All cases
Excluding 1 outlier
Pearson correlation
.060 .060 .112 .060 .254(**)
p (1-tailed) .262 .262 .117 .292 .009
N 116 116 114 87 86
Table F.17 Correlation: adoption level and total number of employees excluding software users (in-house or 3rd party)
Non-COTS total employees COTS total employees
Pearson correlation .211(*) .337(**)
p (1-tailed) .042 .002
N 68 74
* Correlation is significant at the 0.05 level (1-tailed). ** Correlation is significant at the 0.01 level (1-tailed).
Table F.18 Correlation: adoption level and total number of employees for software users (in-house or 3rd party)
Non COTS total employees COTS total employees
Pearson correlation .119 .086
p (1-tailed) .210 .390
N 48 13
Table F.19 Correlation: adoption level and number of software developers
Non-COTS number of developers COTS number of developers
Pearson correlation .253(**) .302(**)
p (1-tailed) .003 .002
N 116 87
** Correlation is significant at the 0.01 level (1-tailed).
Table F.20 Adoption by sector comparison of non-COTS and COTS developers
Sector name Sector
code
Total Not COTS Developer
COTS Developers
N N Mean
adoption
N Mean adoption
Software development 0 133 78 45.7% 78 52.9%
Agriculture, forestry & fishing 1 2 1 73.8% 1 51.2%
Mining 2 2 2 22.3%
Manufacturing 3 5 3 42.5% 2 27.3%
Utilities 4 5 4 58.0% 1 35.7%
Construction 5 1 1 15.8%
Retail & wholesale 6 1 1 28.6%
Accommodation, cafes, restaurants 7 0
Transport & storage 8 0
Communication services & media 9 2 2 27.6%
Finance & insurance 10 2 2 64.2%
Property & business services 11 1 1 50.0% Government admin & defence 12 5 5 50.0%
Education 13 7 5 16.1% 2 62.0%
Health & community service 14 3 2 36.8% 1 63.4%
Analysis of best practice survey data
Table F.21 Non-COTS Developers: adoption level by sector Test of homogeneity of variances
Levene Statistic df1 df2 p
1.363(a) 9 102 .215
a Groups with only one case are ignored in computing the test of homogeneity of variance for adoption level (4 sectors were ignored).
Table F.22 Non-COTS Developers: Comparison of adoption levels by sector One-Way ANOVA Sum of squares df Mean square F p
Between groups 9174.639 13 705.741 1.912 .037
Within groups 37658.858 102 369.204
Total 46833.497 115
9 2 5 5 2 2 4 3 2 78 N =
SECTOR
18 14 13 12 10 9 4 3 2 0
R
oughA
d
opt
ion
120
100
80
60
40
20
0
-20
119
[image:42.595.110.437.380.655.2]38
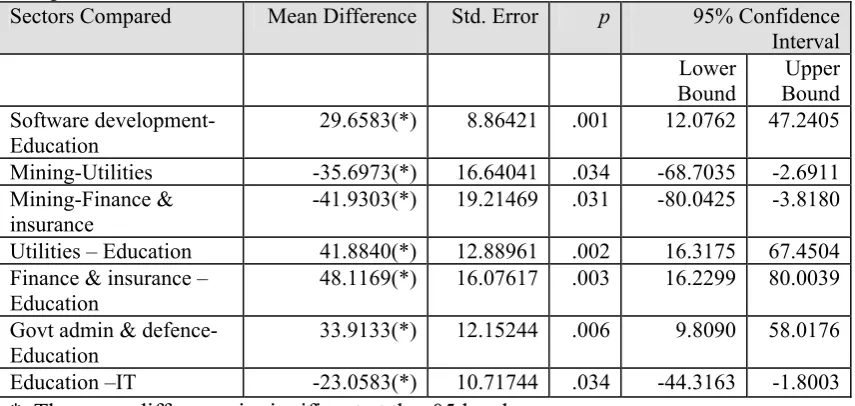
Table F.23 Non-COTS developers: summary of significant differences from multiple comparisons
Sectors Compared Mean Difference Std. Error p 95% Confidence Interval
Lower
Bound
Upper Bound Software development-
Education
29.6583(*) 8.86421 .001 12.0762 47.2405
Mining-Utilities -35.6973(*) 16.64041 .034 -68.7035 -2.6911 Mining-Finance &
insurance
-41.9303(*) 19.21469 .031 -80.0425 -3.8180
Utilities – Education 41.8840(*) 12.88961 .002 16.3175 67.4504 Finance & insurance –
Education
48.1169(*) 16.07617 .003 16.2299 80.0039
Govt admin & defence- Education
33.9133(*) 12.15244 .006 9.8090 58.0176
Education –IT -23.0583(*) 10.71744 .034 -44.3163 -1.8003 * The mean difference is significant at the .05 level.
Table F.24 COTS Developers: adoption level by sector Test of homogeneity of variances
Levene statistic df1 df2 p
1.758(a) 2 79 .179
a Groups with only one case are ignored in computing the test of homogeneity of variance for Adoption. (5 sectors ignored)
Table F.25 COTS Developer: Adoption level by sector - comparison of means One-way ANOVA - Adoption level
Sum of squares df Mean square F p Between groups 3533.168 7 504.738 1.120 .359 Within groups 35595.714 79 450.579
Appendix G.
PIP Sample Documents
PIP Sample Documents
Section 2 Sample of assessment template (requirements elicitation)
Requirements gathering: How do you gather requirements from customers and potential users?
PA 1.1 - Process Performance: Is the requirements gathering process performed, at least informally?Does the process for gathering requirements as implemented in this organization achieve its expected outcomes?
Refer specific outcomes on next page
Do the company personnel understand the scope of the requirements gathering process?
Are there identifiable input work products for requirements gathering?
Identify.
List identified inputs
Are there identifiable output work products from requirements gathering?
Identify.
List identified outputs
Has your company established continuing communications with your key customers?
Newsletter Web Page User Group
Do you have a clear understanding of the customer’s requirements for each project?
Functions
Quality Characteristics Safety
Security Is there a means for identifying new
customer needs and reflecting this in the requirements?
Environmental scanning Changes in business domain
Do you monitor the needs of your customers on a continuous basis?
Surveys
Market research Customer satisfaction
Can your customers readily establish the status of their requests?
Web page
Do you have a program for ongoing enhancement of your products?
PIP Sample Documents
PA 2.1 - Performance Management: Is the performance of the requirements gathering process managed? Do you identify your objectives for
requirements gathering?
Quality Cost Schedule Do you develop a plan for your
requirements gathering activities?
Scope Schedule
Work breakdown Do you assign specific responsibilities
and authorities for developing work products associated with requirements gathering?
Roles
Responsible individuals Approvals
Do you track and monitor the
requirements gathering activities, and re-plan when needed?
Status reports Team meetings
PA 2.2 – Work Product Management: Are the work products of the requirements gathering process managed? Do you specify requirements for the work
products associated with requirements gathering?
Documentation Standards
Control requirements Timing
Do you manage the documentation and change control for the work products associated with requirements gathering?
Version control Baseline definition
Have you identified and defined any dependencies between the work products associated with requirements gathering?
Relationships between work products Sequencing
Do you evaluate and where necessary take corrective action to ensure the quality of the work products associated with requirements gathering?
Reviews
Records of defects found Traceability of correction
PIP Sample Documents
PA 3.1 - Process Definition: Is the requirements gathering process defined? Do you have a standard process for
requirements gathering, and does it provides guidance on implementation and tailoring?
Policies Procedures Standards
Do you implement or tailor the standard process for requirements gathering to obtain a defined process appropriate to the project or product?
Common approach to tailoring for individual projects
Do you collect performance data about requirements gathering so that the behaviour of your defined process can be understood?
Suitability of measures
Do you establish and refine your understanding of the behaviour of the requirements gathering process by using relevant performance data?
Use of measures
Do you refine the standard process for requirements gathering?
Improvement suggestions Change requests
PA 3.2 - Process Resource: Are suitable resources provided for the requirements gathering process? Do you identify and document the roles,
responsibilities and competencies required to support the implementation of your defined process for requirements gathering?
Job descriptions Skills matrix
Do you provide the human resources needed to support the performance of the defined process for requirements
gathering?
Are these resources allocated and used?
Training needs Training records Recruitment policy
Do you identify and document the infrastructure requirements to support the implementation of the defined process for requirements gathering?
Is the infrastructure adequate Tools
Environment
Is the identified process infrastructure provided to support the performance of the defined requirements gathering process?
Is this infrastructure allocated and used?
Upgrading development tools Hardware improvements Furnishings