Board and monitoring committee independence
31
0
0
Full text
(2) 1. INTRODUCTION This study focuses on the independence of boards of directors and their monitoring committees (audit and compensation). 1. for 109 large Australian companies whose boards. have chosen to use a committee structure. Committees represent a mechanism for companies to organise their boards such that they make effective use of directors’ time (which is limited, especially for non-executive directors).. In Australia, The Bosch Committee has. recommended that boards be comprised of a majority of independent, non-executive directors.2 Pease and McMillan (1993) specifically highlight the importance of director independence during the audit process and executive remuneration determinations; the two key functions of monitoring committees investigated in our study. Independent non-executive directors are regarded as being in a better position than non-independent directors to effectively monitor executive management (Stapledon and Lawrence, 1997).. Their. independence allows them to provide objective assessments of firm actions and to ensure that there are adequate "checks and balances" on managerial behaviour (Vance, 1983).. We have chosen the Australian institutional setting to examine the issue of board and monitoring committee independence. In contrast to the US, where companies listed on the New York Stock Exchange are required to have an audit committee formed entirely of independent directors (Klein, 1998), the formation and composition of audit and compensation committees remain essentially unregulated in Australia. Accordingly, our measures of audit committee independence exhibit considerably greater variation than that found in related studies undertaken in the US. For example, Klein (2002) reports that only 1.4% of directors in her sample of S&P 500 firm audit committees are insiders, while 79.6% are outsiders and 19% are affiliates.. Our research contributes to the corporate governance literature by responding to recent calls for empirical investigation of board committees (Gales and Kesner, 1994; Dalton et al, 1998). Our examination of the relation between full board and both audit and compensation. 1. Monitoring committees are one of two generic committee types identified by Harrison (1987). The other generic type relates to management support or operating committees. While nominations committees may also be considered as monitoring committees, this type of committee does not have a distinct monitoring function and is therefore not included in our study. 2 The Australian Investment Managers’ Association (AIMA) in its 1995 Corporate Governance Guidelines has espoused similar views. Overseas, the importance of independence on boards has been reinforced by the Blue Ribbon Committee Report in the US and by the Cadbury Committee on the Financial Aspects of Corporate Governance in Britain.. 2.
(3) committee independence provides evidence of strong positive associations, and shows that the independence of monitoring committees tends to be higher than that of full boards of directors.. We examine the impact of other mechanisms that can be used to control agency conflicts on board and monitoring committee independence. Bathala and Rao (1995) hypothesise and find that firms choose an optimal board composition depending upon the other monitoring mechanisms employed. committees.. We extend their analysis to the composition of monitoring. Our results indicate that low management ownership and an absence of. substantial shareholders are compensated for with greater board independence, while reduced monitoring by debtholders when leverage is low is compensated for with increased audit committee independence.. Finally, we examine the impact of independence on board and committee effectiveness by reference to firm value. Agency theory suggests a positive relation between effective monitoring of management and firm value, due to reduced costs of dysfunctional behaviour (Jensen and Meckling, 1976). However, we do not find a significant association between either full board or monitoring committee independence and firm value.. The remainder of the paper is organised as follows. The next section describes the role of each of type of monitoring committee and draws on the tenets of agency theory to develop hypotheses about (a) the impact of other mechanisms used to control agency conflicts; and (b) the relation between both full board and monitoring committee independence and firm value. Our empirical analysis is contained in section 3, while section 4 concludes.. 2. THEORY AND HYPOTHESES 2.1 Board of Directors and Monitoring Committee Independence Fama and Jensen (1983) outline the role of organisational mechanisms in controlling agency conflicts.. They identify the board of directors as one of the most important of these. organisational controls, and highlight the importance of board independence in relation to the ratification and monitoring of management decisions. In particular, Fama and Jensen stress that boards have the power to hire, fire, and compensate top-level managers and to ratify and monitor important decisions. 3.
(4) Fama (1980) and Fama and Jensen (1983) stress the importance of both inside (executive) and outside (non-executive) directors for effective boards, with the appropriate mix determining the board’s effectiveness in monitoring management. Firms with boards of directors that are dominated by top management can suffer problems associated with collusion and transfer of stockholder wealth. Therefore, corporate boards generally include outside members who ratify decisions that involve serious agency problems and act as arbiters in disagreements among internal managers. Prior research into the determinants of board composition finds some support for the conjecture that board independence is particularly important in situations where the potential for agency problems is most severe (for example, see Baysinger and Butler, 1985; and Pearce and Zahra, 1992). Fama and Jensen (1983, p. 315) assert that “outside board members act as arbiters in disagreements among internal managers and carry out tasks that involve serious agency problems between internal managers and residual claimants, for example, setting executive compensation”.. For firms using a committee structure, much of this responsibility would rest with independent committee members. The independent monitoring function of committees is important where conflicts of interest arise, particularly those situations where executive directors are involved. A great deal of important processes and decisions occur at committee level (see Kesner, 1988; Bilimoria & Piderit, 1994; Daily, 1994, 1996; Ellstrand, Daily and Dalton, 1999).. The two monitoring committees analysed in this study are the audit and. compensation committees. We have chosen to analyse these two committees and not the nominations committee, since they have a distinct monitoring function that is related to management while the nominations committee is concerned with the board itself. Further, audit and compensation committees have legislative and institutional bases underlying their role, while the nominations committee has no such requirements.3. The primary function of the audit committee is to review management information and to meet regularly with internal and external auditors to review the financial statements and external reporting process, to review the audit process (both external and internal) and internal controls (Bosch, 1995; Klein, 1998). This information allows the committee to assess the extent to which the board fulfils its duties and liabilities. By supervising the audit. 3. Thanks to an anonymous referee for pointing this out.. 4.
(5) process, additional assurance about the quality of the company’s financial reporting can be attained. Audit committees can add to the independence of the audit process by providing internal auditors with a mechanism to approach the board without having to use senior management channels (Pease and McMillan, 1993); and can enhance the integrity of monitoring (Menon and Williams, 1994). Bosch (1995) also argues that audit committees reduce the likelihood that a strong management will unduly influence external auditors. With regard to their composition, Menon and Williams (1994, p. 125) argue that an audit committee having executive directors as members “…cannot be viewed as an objective monitor of management”.. It is widely acknowledged that effective audit committees are those that oversee the financial integrity of the company and protect its shareholders’ interests. Independence is essential to being effective in such an oversight role, giving committee members the ability to question management’s actions or judgement (Verschoor, 1993; O’Malley, 1994; Scarbrough, Rama & Raghunandan, 1998). Indeed, this point has been recognised by committee members themselves. For instance, Verschoor (1993) cites a United States General Accounting Office survey in which the chairpersons of audit committees in banks identified the most important factor influencing the effectiveness of audit committee oversight as the independence of its constituents. Independent audit committees can reduce agency costs by minimising the opportunistic selection of financial accounting policies, and by increasing the credibility and accuracy of financial reporting.. Compensation committees typically determine and review remuneration packages for senior company officers (Klein, 1998), taking into consideration the company’s needs together with the interests of its shareholders and other stakeholders (Bosch, 1995).. Remuneration. packages awarded to directors and senior managers have long drawn shareholder and media attention (Pease & McMillan, 1993). In recent times there has been an increasing demand for greater accountability for remuneration, substantially contributing to the growth in adoption of these committees (Bosch, 1995). The determination of appropriate remuneration packages for, and the assessment of, the performance of senior executives are part of the central monitoring duties of directors (Kesner, 1988).. By ensuring that executive. remuneration packages are fair and equitable, independent compensation committees can reduce the agency costs that arise if executives are responsible for determining their own remuneration. 5.
(6) Therefore, for firms using a committee structure, much of the monitoring responsibility of the board is expected to rest with independent committee members.. Indeed, monitoring. committees of the board represent more focused monitoring when compared with the overall board, which is responsible for decision management as well as decision control (Fama and Jensen, 1983).. We thus expect the independence of monitoring committees to be. proportionately greater than that of full boards of directors.. Since committee members must be selected from those available on the full board of directors, a sparsity of independent directors to choose from will result in a less independent monitoring committee than might otherwise have been the case. Accordingly, a positive relation between independence of the full board and that of its monitoring committees has been documented in prior overseas research into audit and nomination committees (see Bradbury, 1990; Menon and Williams, 1994; Vafeas, 1999).. 2.2 Impact of other mechanisms used to control agency conflicts While the agency literature recognises the importance of independent boards of directors in relation to the monitoring of management decisions, this is only one of the mechanisms used to control agency conflicts. This literature suggests increased (a) managerial ownership of equity, (b) dividend payout, and (c) leverage as devices used to ensure that managers’ interests are aligned with those of shareholders. Bathala and Rao (1995) hypothesise and find that US firms choose an optimal board composition depending upon these other mechanisms employed by the firm to control agency conflicts. More specifically, these authors predict and find an inverse relationship between board independence and each of these other agency conflict controlling mechanisms. That is, the relationship appears to be predominantly one of substitutes rather than complements. Bathala and Rao (1995, p. 62) argue that while it is expected that firms will make use of several of these mechanisms, marginal firm specific benefits and costs are expected to cause them to rely more on one type of mechanism than another. We extend their analysis to the composition of monitoring committees and propose that, for firms using a committee structure, monitoring committee independence is negatively related to the extent to which the firm employs other agency conflict-controlling mechanisms. The theoretical underpinnings for each of these are outlined below.. 6.
(7) Jensen and Meckling (1976) assert that increasing managerial ownership of equity can mitigate agency conflicts. The higher the proportion of equity owned by managers, the greater the alignment between manager and shareholder interests. Indirect empirical support for this proposition can be found in McConnell and Servaes (1990) and Morck, Shleifer and Vishny (1988). Further, Weisbach (1988) finds that the fraction of outside directors is negatively correlated with stockholdings of top management. In relation to dividend payout and leverage, Jensen (1986) asserts that the payment of dividends and the contractual obligations associated with debt reduce the amount of discretionary funds available to management, thereby reducing their incentive to engage in non-optimal activities. Further, Grossman and Hart (1982) argue that increased debt causes managers to become more efficient in order to lessen the probability of bankruptcy, loss of control, and loss of reputation. In relation to dividends, Easterbrook (1984) argues that the regular payment of dividends causes firms to go to the capital markets for investment funding. Scrutiny of firms accessing the capital markets acts as a deterrent to opportunistic behaviour by managers. Empirical evidence supports the proposition that increased debt and dividend payouts can mitigate agency conflicts (see Harris and Raviv (1991) and Rozeff (1982)).4. In addition to the agency conflict controlling mechanisms suggested by Bathala and Rao (1995), substantial shareholders have incentives to monitor management and serve as an additional control mechanism (Shleifer and Vishny, 1986; Jensen, 1993).5 In their survey of corporate governance, Shleifer and Vishny (1997) conclude that substantial shareholders achieve corporate governance by exercising their voting rights. These shareholders have both “a general interest in profit maximization, and enough control over the assets of the firm to have their interests respected” (p. 754). The greater the extent of substantial shareholders on the board, the greater the amount of control that can be exercised. The large cash flow stake held by these shareholders provides an incentive to monitor incumbent management, since the expected return on holding a large block of shares exceeds the monitoring costs involved. 4. It is likely that decisions relating to dividend and debt policies are at least partly dependent upon board quality. Therefore, there is a potential simultaneity issue related to our testing of hypothesis one. Data constraints preclude us from utilising two-stage least squares estimation to control for possible problems related to this simultaneity. 5 A substantial shareholder is any person having at least 5% holding in the voting shares (or a class of voting shares) of a company (Corporations Law). Substantial shareholders may also be referred to as blockholders. While institutional investors represent a further potential monitor of managers, we do not analyse this group of substantial shareholders separately, since we expect that only those institutional investors with substantial holdings will have incentives to actively monitor management. That is, we assume that substantial shareholders have incentives to monitor management, regardless of whether they are institutional investors.. 7.
(8) (Shleifer and Vishny, 1986). Therefore, boards with a greater representation of substantial shareholders are expected to achieve superior monitoring. Indeed, Bradbury (1990) finds that substantial shareholders are related to the existence of audit committees.. If full board and monitoring committee independence is related to the extent to which the firm employs other agency conflict-controlling mechanisms, we expect that the monitoring role of independent directors is less critical for firms with higher proportions of inside ownership and substantial shareholders, and higher dividend payout and leverage ratios. We test the hypothesis that. H1 There is a negative relationship between the independence of boards of directors (and their monitoring committees) and the extent of (a) managerial ownership of equity, (b) dividend payout, (c) leverage, and (d) substantial shareholders on the board.. 2.3 Independence and firm value Prior research, predominantly in the UK and USA, has tested for empirical links between overall board of director composition and firm performance (as opposed to value) measures. However, this line of research has met with only limited success, since some studies have found positive relationships, some have found negative relationships, while others report no relationship at all (see Zahra and Pearce, 1989; and Finkelstein and Hambrick, 1995 for a review of this literature). Dalton, Daily and Ellstrand (1998) propose that these inconsistent results may be due to conducting research into the composition of the board at large, rather than at the committee level. However, a recent study of board committee composition in the US found no evidence to support a prediction of a positive relationship between audit and compensation committee independence and firm performance (Klein, 1998).6. We propose that the more direct indicator of effective monitoring is firm value rather than performance.7 This proposition is based on the tenets of agency theory, which proposes that dysfunctional behaviour reduces the value of the firm (Jensen and Meckling, 1976), and that one means by which the costs of such dysfunctional behaviour can be reduced is through 6. Klein’s (1998) failure to find support for predicted relationships between the independence of audit committees and firm performance for US companies may be the result of there being low variation in her audit committee composition variable. Companies listed on the New York Stock Exchange are required to have an audit committee formed entirely of independent directors (Klein, 1998).. 8.
(9) monitoring of management actions. Therefore, agency theory suggests a positive relation between effective monitoring of management and firm value. In relation to monitoring committees, the independence of each committee member is expected to enhance monitoring effectiveness, thereby reducing agency costs and increasing firm value.. We test the. hypothesis that. H2 There is a positive relationship between the independence of boards of directors (and their monitoring committees) and firm value.. 3. ANALYSIS We identified the Top 200 firms listed on the Australian Stock Exchange in 1997. Large firms were selected on the basis that they are more likely to use a board committee structure, while smaller firms are more likely to operate using the full board. Some firms in the Top 200 are unsuitable for the analysis. The various subcategories of firms excluded are detailed in Table 1. In particular, companies not having both audit and compensation committees are excluded.. The final group of companies for analysis consists of 109 large Australian. companies.. [insert Table 1 here]. Some companies satisfy more than one criterion for exclusion.. Trusts have unique. characteristics which impact on their corporate governance practices. The trust manager and the trustee are jointly responsible for governance matters but have a fundamental separation of responsibilities and powers between them. Foreign companies are excluded because their financial statements are not typically prepared according to the normal disclosure requirements applicable to companies listed on the ASX.. 3.1 Board of Director and Monitoring Committee Independence We commence our analysis with an examination of full board and monitoring committee independence.. Full board independence (BRDIND) is captured by the proportion of. independent directors to total directors on the board. Individual directors are assessed in 7. While performance and value are linked, firm value more directly captures predictions emanating from agency. 9.
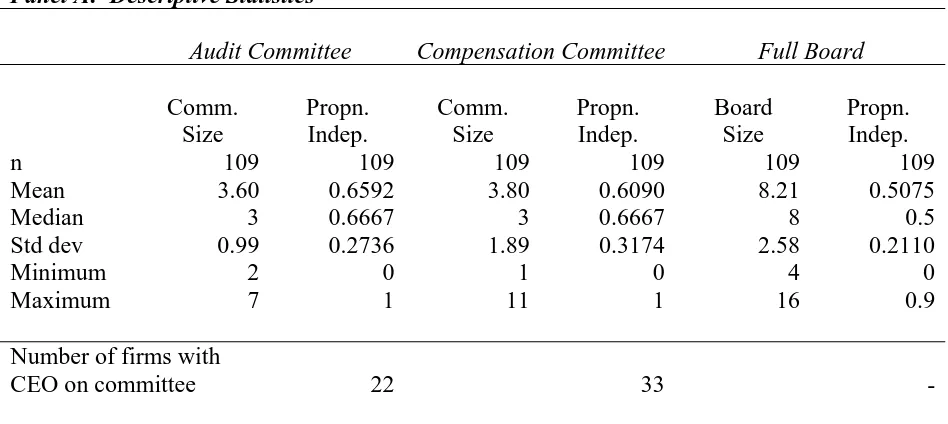
(10) terms of their independence from management, with the definition of independence espoused by the Australian Investment Managers’ Association (AIMA) being adopted.8 Essentially, independent directors are non-executive directors who do not have a business or other relationship with the firm that could interfere with their ability to act independently. This data was hand collected, making the classification of directors a time-intensive process. However, the determination of director independence rather than mere executive status is an important component of this research.. Non-executive directors are not necessarily. independent of the company’s executive management. Their independence can be impaired by virtue of their other relationships or business dealings with the company. This includes acting as a professional adviser to the firm.. The independence of each monitoring committee is measured in two ways: (a) the proportion of independent directors on the committee, and (b) the absence of the company’s Chief Executive Officer (CEO) from the committee. AUD1 and COM1 are used to measure the proportion of independent directors on the audit and compensation committees respectively, while AUD2 and COM2 capture whether the CEO is a member of these committees.. [insert Table 2 about here]. The descriptive statistics shown in Panel A of Table 2 indicate that our sample firm’s audit committees had a mean (median) size of 3.60 (3) members. 22 firms included the CEO as a member of the audit committee. The proportion of independent directors ranges between zero and one, with a mean (median) of 0.6592 (0.6667).. The mean (median) size of. compensation committees was 3.8 (3). Interestingly, in 33 cases the company’s CEO was a member of the committee, indicating some degree of influence over the remuneration process.. The mean (median) proportion of compensation committee members who are. independent directors is 0.609 (0.6667). The mean full board size of the sample companies is 8.21 with a median of 8. Boards ranged in size between four and 16 members. Measures of mean and median proportions of independent directors indicate that boards tend to be equally split between independent and non-independent directors. However, this proportion ranges. theory. 8 The principles embodied within this definition appear to be consistent with those existing in other countries bearing an Anglo-Saxon corporate governance system.. 10.
(11) between 0 (no independent directors) and 0.9. As expected, monitoring committees tend to have a greater proportion of independent directors than the full board.. The additional descriptive analysis presented in Panel B indicates that 31 audit committees (28.4%) were regarded as being wholly independent. Further, 73 companies (67%) complied with an AIMA recommendation that only non-executive directors be members of this committee. Indeed, one hundred and five of the committees (96.3%) comprised a majority of non-executive directors, while 70 (64.2%) comprised a majority of independent directors. These comparisons reveal the importance of making a distinction between non-executive and independent directors.. The appointment of non-executives to boards and monitoring. committees cannot ensure total objectivity in the monitoring process. Whereas the AIMA’s recommendation with respect to audit committees is for all members to be non-executive, its guidelines regarding compensation committees merely call for a majority of non-executives. 102 (93.6%) of the sample firms having a compensation committee conformed with this guideline, while 68 firms (62.4%) had established such committees with no executive members at all.. Only 61 of the committees (56%) were comprised of a majority of. independent directors, with a mere 30 of those (27.5% of all compensation committees) classified as wholly independent.. A key guideline espoused by the AIMA is that boards should constitute a majority of independent directors.. However, only 48 (44%) of sample firms complied with this. guideline. A less onerous recommendation forwarded by the Bosch Committee was that boards be at least one-third independent. The sample’s conformity with this criterion was in the order of 79.8% (87 firms). Further, approximately 88.1% of sample firms (96) had a majority of non-executives on the board.. Panel C of Table 2 shows bivariate correlations amongst our monitoring committee and full board independence variables. While the proportion of independent directors on each of the monitoring committees is significantly positively correlated with the proportion on the full board, the decision to include the CEO on the audit committee is not related to overall board independence. On the other hand, more independent boards tend not to include the CEO on the compensation committee. Our two measures of independence tend to be significantly positively correlated for each committee indicating that, where independence is seen to be important, this is often achieved by both a high proportion of independent directors and the 11.
(12) absence of the CEO.. For example, our two measures of compensation committee. independence have a Pearson correlation coefficient of .378 (p < .01).. 3.2 Empirical model, variable measurement and data sources Hypothesis one predicts negative relationships between both monitoring committee and full board independence and other mechanisms that can be used to control agency conflicts. Our tests of this hypothesis involve examining the impact of these other mechanisms on the independence of the (a) audit committee, (b) compensation committee, and (c) full board. We control for the significant positive correlation between full board and monitoring committee independence documented above, as well as several other firm characteristics likely to be associated with independence. We use the following models to test hypothesis one: AUD1it = ß0 + ß1MGOWNit + ß2PAYOUTit + ß3DEBTit + ß4SUBSit + ß5INDSEGit + ß6GEOSEGit + ß7GROWTHit + ß8PERFit + ß9SIZEit + ß10BRDINDit + εit. COM1it = ß0 + ß1MGOWNit + ß2PAYOUTit + ß3DEBTit + ß4SUBSit + ß5INDSEGit + ß6GEOSEGit + ß7GROWTHit + ß8PERFit + ß9SIZEit + ß10BRDINDit + εit. BRDINDit = ß0 + ß1MGOWNit + ß2PAYOUTit + ß3DEBTit + ß4SUBSit + ß5INDSEGit + ß6GEOSEGit + ß7GROWTHit + ß8PERFit + ß9SIZEit + ß10COMINDit + εit. (1a). (1b). (1c). AUD1, COM1 and BRDIND are as previously defined.9 COMIND is the average proportion of independent directors on the firm’s two monitoring committees ((AUD1 + COM1) / 2). This variable proxies for the overall firm policy with respect to the independence of monitoring committees and overcomes potential multicollinearity problems associated with including both AUD1 and COM1 in equation (1c).10. MGOWN captures the proportion of equity, including options as well as ordinary shares, held by non-independent directors.11 PAYOUT is measured as the ratio of ordinary dividends to earnings. Seven sample firms had a negative PAYOUT in 1997 due to reporting losses in 9. Results of sensitivity tests using our alternative measures of committee independence (AUD2 and COM2) are reported in section 3.3. 10 Sensitivity tests that replace COMIND with AUD1 and/or COM1 produce consistent results in terms of the sign and significance of the other independent variables.. 12.
(13) that year. Including such data in its raw form would bias our results, since the continued payment of dividends in loss years remains an important alternative governance mechanism. We counter this potential bias by attributing a payout ratio of 100% for each of these seven firms. DEBT captures leverage and is measured as long-term debt divided by the sum of long-term debt and the market value of ordinary equity. PAYOUT and DEBT are measured relative to industry medians for that year.12 The impact of substantial shareholders (SUBS) is captured by the number of directors on the board representing a substantial shareholder.13. In addition to the variables used to test our hypotheses, our model includes several control variables that capture the firm characteristics most likely to be associated with board and monitoring committee independence. These control variables draw on the arguments identified in prior research into the determinants of full board independence and are measured as follows.14 INDSEG and GEOSEG capture the extent of firm diversification,15 and are operationalised as the number of industry and geographical segments reported in notes to the financial statements. Growth options (GROWTH) are captured by the market-to-book ratio, calculated as the ratio of the market value of ordinary equity to the book value of ordinary equity.16 Financial performance (PERF)17 is captured by each firm’s average earnings before interest and taxes (EBIT) to total assets ratio over the 1995 to 1997 period. We calculate a three-year average since this is expected to give a more accurate measure than using a single year observation. Single year measures of firm performance can be problematic if sample firms show an atypical performance result in that year. Likewise, SIZE is measured as the. 11. We refine the measure used by Bathala and Rao (1995) by (a) considering whether directors are nonindependent rather than merely whether they are executive or non-executive directors, and (b) including options to purchase ordinary shares in this measure. 12 The median payout ratio for the gold miners industry category is zero. We therefore use the industry mean rather than the industry median for the firms in this industry. 13 The measurement of board independence does not include directors who are substantial shareholders. Indeed, the AIMA definition precludes such directors from the ‘independent’ classification. 14 We control for the impact of industry effects by measuring certain variables relative to industry medians. 15 Prior empirical research has found that as diversification increases, so does board independence (Baysinger and Butler, 1985; Hermalin and Weisbach, 1988). Diversification efforts aim to reduce or manage environmental uncertainty associated with current and future opportunities (Pearce and Zahra, 1992, p.421). 16 Anderson, Francis and Stokes (1993) show that each firm’s mix of corporate governance mechanisms is determined by the degree to which its value is made up by assets-in-place versus growth options. 17 Baysinger and Butler (1985) find that firms with above average financial performance have higher percentages of outside directors than firms with below average performance. Further, Zahra and Pearce (1989) propose that the presence of outside directors enhance financial performance by (a) enabling the acquisition of timely data on environmental changes, (b) ensuring careful analyses of managerial proposals, (c) enhancing ability to respond effectively to the expectations of diverse interest groups, and (d) undertaking crucial control functions.. 13.
(14) average total revenues earned between 1995 and 1997.18 Total revenues are used since they are less likely to be impacted by the effectiveness of monitoring mechanisms, when compared with alternative measures of size such as firm value.19 GROWTH, PERF and SIZE are all measured relative to industry medians for that year (ASX classifications).. Annual reports downloaded from the Connect 4 Annual Report Collection represent the major source of data for the study.. Accounting data relevant to the determination of. PAYOUT, DEBT, SIZE, GROWTH, and PERF were hand collected from the financial statements; while directors’/chairmen’s reports, corporate governance statements, statutory information sections, segment reports and related party disclosures were studied to assess MGOWN, SUBS, INDSEG, GEOSEG and committee structure and independence. Industry median data was obtained from Aspect Financial Pty Ltd. Part of the assessment of director independence requires knowledge of whether each director was, directly or indirectly, a substantial shareholder of the company. While the identification of substantial shareholders was predominantly made in the annual reports, this information was verified by reference to AFR Shareholder Handbooks of Australian Listed Companies for the relevant time period.. 3.3 Results Table 3 shows descriptive statistics for our independent variables. While MGOWN ranges between zero and 0.997, it tends to be low, on average. Indeed, for 90 of our 109 firms, equity ownership by non-independent directors comprises less than 5% of total ordinary equity. Since the distribution of this variable is severely non-normal and no transformation satisfactorily improves its distribution, we use a dichotomous rather than continuous measure in our hypotheses tests. MGOWN_D is coded one where the proportion of equity, including options as well as ordinary shares, held by non-independent directors exceeds five percent of issued ordinary shares and options, zero otherwise.20. 18. Pearce and Zahra (1992) include size as a control variable, since it is empirically correlated with both board composition and company performance. A further justification for including size as a firm characteristic stems from Pincus et al’s (1989) contention that economies of scale result in net monitoring benefits increasing with size. 19 Our results are insensitive to using an alternate measure of SIZE, market value of equity. 20 While our five percent cut-off is arbitrary, it seems reasonable to expect that director’s equity holdings of less than this amount would be unlikely to reduce agency conflicts. Results of additional unreported tests using cutoffs of 2% and 10% indicate that our results are not sensitive to the cut-off level chosen.. 14.
(15) Mean and median measures for PAYOUT and DEBT indicate higher than average dividends and leverage for our companies.. Likewise, they are bigger and have more growth. opportunities (indicated by SIZE and GROWTH) than their industry medians. On the other hand, financial performance (PERF) does not appear to be substantially different from industry medians. Many of our companies don’t have any directors representing substantial shareholders, with a median of zero and a mean of only one per company (SUBS). Mean and median measures for INDSEG and GEOSEG indicate limited diversity, on average. However, minima and maxima indicate considerable variation for all of our independent variables. 21. [insert Table 3 about here]. Correlations between these independent variables are shown in Table 4. While there are several significant correlations between our independent variables, the majority of these are low enough to suggest that multicollinearity should not be a problem for our multivariate hypotheses tests.22. MGOWN_D and SUBS are positively correlated (r = 0.370, p < 0.001). since firms with non-independent directors holding five percent or more of ordinary equity are given non-zero values for both measures. However, we are confident that these variables are capturing different aspects of the alternative mechanisms used to control agency conflicts. In particular, MGOWN_D also captures those firms without substantial shareholders where combined non-independent director ownership of shares and options is greater than or equal to five percent; while SUBS captures holdings of greater than 5% that are held by both independent and non-independent directors and considers the number of substantial shareholders per firm.. Significant correlations between our hypothesised variables and. several control variables (particularly SIZE, PERF and GROWTH) reinforce the importance of controlling for these firm characteristics in our hypothesis tests.. [insert Table 4 about here]. 21. These descriptive statistics indicate that several of our independent variables are not normally distributed. However, transformations were not considered necessary given that diagnostic tests on the distributions of the regression residuals show that the residuals are normally distributed. 22 We have formally checked for multicollinearity using variance inflation factors (VIFs). Our highest VIF of 1.6 is well below the cut-off of 10 suggested by Lardaro (1993, p.446), and Hair, Anderson, Tatham and Black (1998, p.193).. 15.
(16) Hypothesis one proposes negative relationships between board (committee) independence and other mechanisms used to control agency conflicts. Table 5 shows regression estimates in relation to the proportion of independent directors on audit and compensation committees as well as the full board. DEBT is negatively related to audit committee independence, regardless of whether this is measured as the proportion of independent directors or the absence of the CEO from this committee. That is, more independent audit committees are associated with lower leverage; indicating that when debtholders have lower incentives to monitor the financial reporting and audit functions, the independence of committee level monitoring becomes more important.. On the other hand, compensation committee. independence is not associated with any of these other control mechanisms. Sensitivity tests using our alternative measures of committee independence (AUD2 and COM2) yield the same conclusions. For the full board, the proportion of management ownership (MGOWN_D) and the number of substantial shareholders (SUBS) are significantly negatively associated with independence. That is, a more independent board is used for monitoring when there is low management ownership and an absence of substantial shareholders. None of the firm characteristic control variables are significantly related to monitoring committee or full board independence.. [insert Table 5 about here]. 3.4 Impact on firm value In this section of our analysis, we examine the impact of board and monitoring committee independence on monitoring effectiveness by reference to firm value.. Hypothesis two. predicts a positive relationship between firm value and monitoring committee (board) independence. The design of empirical tests for this hypothesis is difficult to the extent that many factors other than effective monitoring are expected to impact firm value. Ideally, we would perform our analysis on a firm-by-firm basis and examine the market value of each firm while adjusting the level of monitoring committee independence. Of course, such a test is not possible when using archival data. A second option would be to observe the change in market value for firms adjusting the level of monitoring committee independence between years. Unfortunately, only a handful of our firms made such a change in 1997, rendering statistical testing impossible. Therefore, we employ a cross-sectional research design, and. 16.
(17) acknowledge the limitations associated with such a design.23 We reduce some of the problems associated with using cross-sectional tests by controlling for firm size and measuring the independence of the board and monitoring committees relative to industry medians. Effectively, we assume that industry median independence proportions are optimal, and assess the impact of deviations from these optimal proportions of independent directors.. We use the following models to test whether monitoring committee and board independence are positively related to firm value:24 MVE it = β 0 + β 1 AUD1 / INDUSTRYit + β 2 SIZE it + ε it. (2a). MVE it = β 0 + β 1COM 1 / INDUSTRYit + β 2 SIZE it + ε it. (2b). MVE it = β 0 + β 1 BRDIND / INDUSTRYit + β 2 SIZE it + ε it. (2c). The Securities Industry Research Centre of Asia-Pacific (SIRCA) database was used to obtain share price data relevant to the determination of the market values of shareholder equity. Market value of equity (MVE) is calculated as the number of shares outstanding at balance date by price per share on that date. While our companies for analysis are drawn from the largest 200 listed Australian companies, some of these are quite small by international standards.. Market values range between $93m and $38,068m indicating. substantial variation in firm size within the sample.. Table 6 shows regression results for equations (2a) to (2c). The results indicate that neither board nor monitoring committee independence is significantly associated with firm value. The results reported in Table 6 are after log transformations of both MVE and SIZE. These. 23. Thanks to David Emanuel for pointing this out and discussions about possible solutions. Ohlson (1995) proposes a model in which market values can be fully explained by book values and future abnormal earnings. Empirical tests employing this model generally proxy for future abnormal earnings with either annual earnings or abnormal earnings for the current year. However, the inclusion of book values and earnings as control variables in our model would eliminate the effect that we are attempting to isolate, since we expect that the outcomes of effective monitoring will manifest in both book value and earnings. On the other hand, our measure of firm size, average total revenues over the three years 1995 to 1997, is not expected to be affected by the effectiveness of monitoring mechanisms. 24. 17.
(18) transformations were necessary, since positive skewness in these variables causes the regression residuals to be non-normal, and this is corrected by the log transformations.25. [insert Table 6 about here]. To test the robustness of our results to possible scale effects, we estimate an alternate specification of equation (2). Barth and Clinch (1999), in their examination of scale effects on inferences obtained from capital markets-based accounting research, suggest researchers need to be careful to ensure their findings are not attributable to scale. Our alternate specification involved using the ratio of MVE to SIZE as our dependent variable and excluding SIZE from the right-hand-side of our model. Our results are insensitive to this alternate specification. That is, full board and monitoring committee independence are not significantly associated with market value. Overall, the results of these tests complement those of Klein (1998) in relation to US audit and compensation committees.. 4. CONCLUSIONS This paper examines full board and monitoring committee independence, the impact of other mechanisms used to control agency conflicts on that independence, and the impact of independence on firm value. We document a strong positive association between the proportion of independent directors on the full board and its audit and compensation committees. Indicative of the more focused monitoring function of these committees, both audit and compensation committees tend to have a greater proportion of independent directors than the full board.. Further, we find that greater full board independence is. associated with low management ownership and an absence of substantial shareholders, while greater audit committee independence is associated with reduced monitoring by debtholders when leverage is low. Low levels of these other monitoring mechanisms appear to be compensated for with higher levels of board and audit committee independence. However, none of these alternative agency conflict-controlling mechanisms is associated with compensation committee independence.. 25. To check the sensitivity of our results to these transformations, we re-ran them with untransformed data and used White’s (1980) standard errors to limit problems associated with heteroskedasticity (see Barth and Kallapur, 1996). Our results are insensitive to the transformations.. 18.
(19) We are unable to provide evidence that firm value is enhanced through stronger monitoring committee or full board independence. However, our results may be due to problems associated with the use of cross-sectional tests. While agency theory predicts that more effective monitoring will result in higher firm value at the margin, other determinants of firm value are likely to overwhelm this effect when differences in market value between firms are considered. A further limitation of the paper relates to the generalisability of results. Given our focus on boards with monitoring committees, and the greater propensity for boards of larger firms to use these committees, our sample is drawn from the largest 200 Australian firms.. Therefore, our results may not be generalisable to smaller firms using similar. committee structures or to firms that do not have both audit and compensation committees.. 19.
(20) REFERENCES Aldrich, K. 1979, Organization and Environments, Englewood Cliffs, N.J., Prentice-Hall. Australian Society of Certified Practicing Accountants (ASCPA) 1995, Corporate Governance Disclosure – How do Australia’s Top Companies Rate? Barth, M.E., and Clinch, G. 1999, “Scale Effects in Capital Markets-Based Accounting Research”, working paper, Stanford University and University of New South Wales. Barth, M.E., and Kallapur, S. 1996, “The Effects of Cross-Sectional Scale Differences on Regression Results in Empirical Accounting Research”, Contemporary Accounting Research, Fall, pp. 527-67. Bathala, C.T., and Rao, R.P. 1995, The Determinants of Board Composition: An Agency Theory Perspective, Managerial and Decision Economics, 16(1), 59-69. Baxter, P. 1998, "The Voluntary Disclosure of Audit Committees in Australian Listed Companies' Annual Reports", Unpublished masters thesis, University of Southern Queensland. Baysinger, B.D., and Butler, H.N. 1985, Corporate Governance and the Board of Directors: Performance Effects of Changes in Board Composition, Journal of Law, Economics, and Organization, 1, 101-24. Bilimoria, D., and Piderit, S.K. 1994, Board Committee Membership: Effects of Sex-based Bias, Academy of Management Journal, 37(6), 1453-1477. Bosch, H. 1995, The Director at Risk: Accountability in the Boardroom, Pitman Publishing, Melbourne. Bradbury, M.E. 1990, The Incentives for Voluntary Audit Committee Formation, Journal of Accounting and Public Policy, 9, 19-36. Daily, C.M. 1994, Bankruptcy in Strategic Studies: Management, 20(2), 263-295.. Past and Promise, Journal of. Daily, C.M. 1996, Governance Patterns in Bankruptcy Reorganizations, Strategic Management Journal, 17(5), 355-375. Dalton, D.R., Daily, C.M., Ellstrand, A.E., and Johnson, J.L. 1998, Meta-Analytic Reviews of Board Composition, Leadership Structure, and Financial Performance, Strategic Management Journal, 19(3), 269-290. Easterbrook, F. 1984, Two Agency Cost Explanations of Dividends, American Economic Review, 74, 650-9.. 20.
(21) Ellstrand, A.E., Daily, C.M., and Dalton, D.R. 1999, Governance by Committee: The Influence of Board of Directors’ Committee Composition on Corporate Performance, Journal of Business Strategies, 16(1), 67. Fama, E.F. 1980, Agency problem and the theory of the firm, Journal of Political Economy, 33, 288-308 Fama, E.F. and Jensen, M.C. 1983, Separation of Ownership and Control, Journal of Law & Economics, XXVI, 301-25. Finkelstein, S., and Hambrick, D.C. 1995, Strategic Leadership: Top Executives and their Effects on Organizations, West, Minneapolis. Gales, L.M., and Kesner, I.F. 1994, An Analysis of Board of Director Size and Composition in Bankrupt Organizations, Journal of Business Research, 30(3), 271-282. Grossman, S.J. and Hart, O. 1982, Corporate Financial Structure and Managerial Incentives, In The Economics of Information and Uncertainty (edited by J.J. MaCall), The University of Chicago Press, Chicago, 107-37. Gujarati, D. 1992, “Essentials of Econometrics”, McGraw-Hill International, Singapore. Harris, M and Raviv, A. 1991, The Theory of Capital Structure, Journal of Finance, 46, 297356. Harrison, J.R. 1987, The Strategic Use of Corporate Board Committees, California Management Review, 30(1), 109-125. Hermalin, B.E., and Weisbach, M.S. 1988, The Determinants of Board Composition, RAND Journal of Economics, 19 (4), 589-606. Jensen, M.C. 1986, Agency costs of free cash flow, corporate finance, and takeovers, American Economic Review, 76, May, 323-29. Jensen, M.C. 1993, The Modern Industrial Revolution, Exit, and the Failure of Internal Control Systems, Journal of Finance, XLVIII, 831-80. Jensen, M.C., and Meckling, W.H. 1976, Theory of the Firm: Managerial Behavior, Agency Costs and Ownership Structure, Journal of Financial Economics, 3, 305-360. Kesner, I.F. 1988, Directors’ Characteristics and Committee Membership: An Investigation of Type, Occupation, Tenure, and Gender, Academy of Management Journal, 31(1), 66-84. Klein, A. 1998, Firm Performance and Board Committee Structure, Journal of Law and Economics, 16(1), 275-303. Klein, A. 2002, Economic Determinants of Audit Committee Independence, The Accounting Review, 77(2), 435-453.. 21.
(22) Lipton, P., and Herzberg, A. 1999, Understanding Company Law, 8th edn, LBC Information Services, Pyrmont, NSW. McConnell, J.J. and Servaes, H. 1990, Additional Evidence on Equity Ownership and Corporate Value, Journal of Financial Economics, 27, 595-612. Menon, K., and Williams, J.D. 1994, The Use of Audit Committees for Monitoring, Journal of Accounting and Public Policy, 13(2), 121-139. Morck, R., Shleifer, A. and Vishny, R.W. 1988, Management Ownership and Market Valuation: An Empirical Analysis, Journal of Financial Economics, 20, 293-316. Ohlson, J. 1995, “Earnings, Book Values and Dividends in Security Valuation”, Contemporary Accounting Research, 661-87. O’Malley, S.F. 1994, Improving Audit Committee Performance, Corporate Board, 15(86), 914. Pearce, J.A. and Zahra, S.A. 1992, Board Composition from a Strategic Contingency Perspective, Journal of Management Studies, 29 (4), 411-38. Pease, G., and McMillan, K. 1993, The Independent Non-Executive Director, Longman Professional Publishing, Melbourne. Pincus, K., Rusbarsky, M., and Wong, J., 1989, Voluntary Formation of Corporate Audit Committees Among NASDAQ Firms, Journal of Accounting & Public Policy, 8(4), 239-265. Rozeff, M.S. 1982, Growth, Beta and Agency Costs as Determinants of Dividend Payout Ratios, Journal of Financial Research, 5, 249-59. Scarbrough, D.P., Rama, D.V., and Raghunandan, K. 1998, Audit Committee Composition and Interaction with Internal Auditing: Canadian Evidence, Accounting Horizons, 12(1), 5162. Shleifer, A., and Vishny, R.W., 1986, Large Shareholders and Corporate Control, Journal of Political Economy, 95, 461-88. Shleifer, A., and Vishny, R.W., 1997, A Survey of Corporate Governance, Journal of Finance, 52 (2), 737-83. Stapledon, G.P., and Lawrence, J. 1997, Board Composition, Structure and Independence in Australia’s Largest Listed Companies, Melbourne University Law Review, 21(1), 150-186. Thomadakis, S.B. 1977, A Value-Based Test of Profitability and the Market Structure, Review of Economics and Statistics, May, 179-185. Vafeas, N. 1999, The Nature of Board Nominating Committees and their Role in Corporate Governance, Journal of Business Finance and Accounting, 26(1), 199-225.. 22.
(23) Vance, S.C. 1983, Corporate Leadership, Boards, Directors and Strategy, McGraw-Hill, New York. Verschoor, C.C. 1993, Benchmarking the Audit Committee, Journal of Accountancy, 176(3), 59-63. Weisbach, M.S. 1988, Outside Directors and CEO Turnover, Journal of Financial Economics, 20, 431-60. Zahra, S.A., and Pearce, J.A. II 1989, Board of Directors and Corporate Financial Performance: A Review and Integrative Model, Journal of Management, 15(2), 391-394. Zahra, S.A., and Stanton, W.W. 1988, The Implications of Board of Directors’ Composition for Corporate Strategy and Performance, International Journal of Management, 5, 229-236.. 23.
(24) Table 1 Companies Analysed Top 200 companies in 1997. 200. Exclusions: Don’t have both committees. 40. Trusts. 28. Foreign companies. 12. Delistings/mergers/takeovers. 5. Other (not able to be traced or missing data for some variables) Final group of companies for analysis. 6. 91 109. 24.
(25) Table 2 Monitoring Committee and Full Board Independence Descriptive Statistics, Correlation Coefficients, and Compliance with Governance Recommendations for 109 Large Australian Companies. Panel A: Descriptive Statistics Audit Committee. n Mean Median Std dev Minimum Maximum. Comm. Size 109 3.60 3 0.99 2 7. Compensation Committee. Propn. Indep. 109 0.6592 0.6667 0.2736 0 1. Number of firms with CEO on committee. Comm. Size 109 3.80 3 1.89 1 11. Full Board. Propn. Indep. 109 0.6090 0.6667 0.3174 0 1. 22. Board Size 109 8.21 8 2.58 4 16. Propn. Indep. 109 0.5075 0.5 0.2110 0 0.9. 33. -. Panel B: Compliance with Governance Recommendations Audit Committee. Wholly independent Wholly non-executive Majority independent Majority non-executive At least one-third independent* *. Compensation Committee. Full Board. Frequency. %. Frequency. %. Frequency. %. 31 73 70 105 -. 28.4 67.0 64.2 96.3 -. 30 68 61 102 -. 27.5 62.4 56.0 93.6 -. 0 3 48 96 87. 0.0 2.8 44.0 88.1 79.8. This was a recommendation forwarded by the Bosch Committee in relation to full boards only.. 25.
(26) Panel C: Pearson (Spearman) Correlations BRDIND AUD1 AUD1 0.597** (0.587)** COM1 0.718** 0.601** (0.743)** (0.593)** AUD2 -0.014 0.330** (-0.018) (0.340)** COM2 0.202* 0.099 (0.202)* (0.097) * two-tailed p<0.05, ** two-tailed p<0.01. COM1. AUD2. 0.066 (0.055) 0.378** (0.411)**. 0.216* (0.216)*. BRDIND = the ratio of independent directors to total directors on the board. AUD1 = the ratio of independent directors to total directors on the audit committee. COM1 = the ratio of independent directors to total directors on the compensation committee. AUD2 = dichotomous variable coded 1 where the CEO is not a member of the audit committee, and 0 otherwise. COM2 = dichotomous variable coded 1 where the CEO is not a member of the compensation committee, and 0 otherwise.. 26.
(27) Table 3 Independent Variable Descriptive Statistics for 109 Large Australian Companies. Mean Median Std dev Minimum Maximum. MGOWN 0.074 0.004 0.184 0.000 0.997. PAYOUT 1.99 1.39 2.46 0.00 19.30. DEBT 11.87 1.51 27.23 0.00 131.11. SUBS 1.01 0.00 1.57 0.00 9.00. INDSEG 2.20 2.00 1.53 1.00 9.00. GEOSEG 2.43 2.00 1.60 1.00 8.00. SIZE GROWTH 144.15 5.58 18.69 1.64 462.35 28.96 0.01 0.26 3,507.31 303.14. PERF 1.14 0.96 3.01 -5.33 25.78. PAYOUT = the dividend payout ratio, calculated as ordinary dividends divided by earnings (where earnings is calculated as operating profit before extraordinaries and after tax); relative to industry median dividend payout ratio. Negative payout ratios recoded as 100 percent prior to scaling. DEBT = the debt ratio, calculated as long term debt divided by the sum of long-term debt and the market value of ordinary equity; relative to industry median debt ratio. SUBS = the number of directors on the board who represent a substantial shareholder. INDSEG = the number of reported industry segments. GEOSEG = the number of reported geographic segments. GROWTH = the market to book ratio, calculated as the ratio of the market value of ordinary equity to the book value of ordinary equity; relative to industry median market to book ratio. PERF = previous financial performance, measured as the mean of (EBIT to total assets ratio between 1995 and 1997 relative to industry median EBIT to total assets ratio between 1995 and 1997). SIZE = the mean of (total revenues between 1995 and 1997 relative to industry median total revenues between 1995 and 1997). MGOWN = the proportion of equity (including options as well as ordinary shares) held by non-independent directors.. 27.
(28) Table 4 Pearson (Spearman) Correlations between Independent Variables for 109 Large Australian Companies MGOWN_D PAYOUT -0.133 -0.160 DEBT -0.080 0.234* 0.083 0.108 SUBS 0.370** 0.017 0.448** 0.008 INDSEG 0.018 -0.022 -0.011 -0.094 GEOSEG 0.058 -0.106 0.076 -0.095 GROWTH 0.216* -0.023 0.126 -0.088 PERF 0.027 -0.123 0.137 -0.218* SIZE -0.128 0.200* -0.201* 0.371** * two-tailed p<0.05, ** two-tailed p<0.01. DEBT. SUBS. INDSEG. GEOSEG. 0.013 0.044 -0.116 0.072 -0.023 -0.022 -0.056 -0.277** -0.254** -0.343** 0.410** 0.364**. 0.007 -0.014 -0.120 -0.057 0.187 0.097 -0.066 -0.009 -0.102 0.033. 0.225* 0.283** -0.068 -0.141 0.112 0.104 0.070 -0.062. 0.053 0.044 0.042 0.054 0.090 0.067. GROWTH. PERF. 0.030 0.145 -0.037 -0.157. -0.218* -0.358**. PAYOUT. MGOWN_D = dichotomous variable coded 1 where the proportion of equity (including options as well as ordinary shares) held by non-independent directors exceeds 5 percent, and 0 otherwise. PAYOUT = the dividend payout ratio, calculated as ordinary dividends divided by earnings (where earnings is calculated as operating profit before extraordinaries and after tax); relative to industry median dividend payout ratio. Negative payout ratios recoded as 100 percent prior to scaling. DEBT = the debt ratio, calculated as long term debt divided by the sum of long-term debt and the market value of ordinary equity; relative to industry median debt ratio. SUBS = the number of directors on the board who represent a substantial shareholder. INDSEG = the number of reported industry segments. GEOSEG = the number of reported geographic segments. GROWTH = the market to book ratio, calculated as the ratio of the market value of ordinary equity to the book value of ordinary equity; relative to industry median market to book ratio. PERF = previous financial performance, measured as the mean of (EBIT to total assets ratio between 1995 and 1997 relative to industry median EBIT to total assets ratio between 1995 and 1997). SIZE = the mean of (total revenues between 1995 and 1997 relative to industry median total revenues between 1995 and 1997).. 28.
(29) Table 5 Regression Estimates of Monitoring Committee and Full Board Independence on Other Agency Conflict Controlling Mechanisms for 109 Large Australian Companies (t-values in parentheses) Panel A: Dependent Variable is Audit Committee Independence (AUD1) β0. β1. β2. β3. β4. β5. β6. β7. β8. β9. ß10. Constant Pred. sign. MGOWN_D -. PAYOUT -. DEBT -. SUBS -. INDSEG +. GEOSEG +. GROWTH +. PERF +. SIZE +. BRDIND +. 0.197 (2.119)*. -0.041 (-0.645). 0.003 (0.370). -0.002 (-2.263)*. 0.005 (0.307). 0.014 (0.997). 0.025 (1.821). -0.001 (-0.108). -0.006 (-0.863). 0.001 (1.399). 0.762 (6.014)**. Adjusted R2. 0.374. Panel B: Dependent Variable is Compensation Committee Independence (COM1) β0. β1. β2. β3. β4. β5. β6. β7. β8. β9. ß10. Constant Pred. sign. MGOWN_D -. PAYOUT -. DEBT -. SUBS -. INDSEG +. GEOSEG +. GROWTH +. PERF +. SIZE +. BRDIND +. -0.093 (-0.975). 0.036 (0.547). 0.008 (0.884). 0.001 (0.045). 0.015 (0.876). 0.012 (0.839). 0.017 (1.226). 0.001 (0.177). -0.004 (-0.468). 0.001 (1.107). 1.161 (8.882)**. Adjusted R2. 0.504. Panel C: Dependent Variable is Full Board Independence (BRDIND) β0. β1. β2. β3. β4. β5. β6. β7. β8. β9. ß10. Constant Pred. sign. MGOWN_D -. PAYOUT -. DEBT -. SUBS -. INDSEG +. GEOSEG +. GROWTH +. PERF +. SIZE +. COMIND +. 0.293 (6.472)**. -0.073 (-2.024)*. -0.001 (-0.222). 0.001 (1.134). -0.039 (-4.323)**. -0.005 (-0.574). -0.015 (-1.864). -0.001 (-0.281). 0.003 (0.819). -0.001 (-0.993). 0.489 (9.323)**. Adjusted R2. 0.645. * Two-tailed p<0.05, ** Two-tailed p<0.01 AUD1 = the ratio of independent directors to total directors on the audit committee. COM1 = the ratio of independent directors to total directors on the compensation committee. COMIND = the average proportion of independent directors on the firm’s two monitoring committees ((AUD1 + COM1) / 2). BRDIND = the ratio of independent directors to total directors on the board. MGOWN_D = dichotomous variable coded 1 where the proportion of equity (including options as well as ordinary shares) held by non-independent directors exceeds 5 percent, and 0 otherwise. PAYOUT = the dividend payout ratio, calculated as ordinary dividends divided by earnings (where earnings is calculated as operating profit before extraordinaries and after tax); relative to industry median dividend payout ratio. Negative payout ratios recoded as 100 percent prior to scaling. DEBT = the debt ratio, calculated as long term debt divided by the sum of long-term debt and the market value of ordinary equity; relative to industry median debt ratio.. 29.
(30) SUBS = the number of directors on the board who represent a substantial shareholder. INDSEG = the number of reported industry segments. GEOSEG = the number of reported geographic segments. GROWTH = the market to book ratio, calculated as the ratio of the market value of ordinary equity to the book value of ordinary equity; relative to industry median market to book ratio. PERF = previous financial performance, measured as the mean of (EBIT to total assets ratio between 1995 and 1997 relative to industry median EBIT to total assets ratio between 1995 and 1997). SIZE = the mean of (total revenues between 1995 and 1997 relative to industry median total revenues between 1995 and 1997).. 30.
(31) Table 6 Regression Estimates of Firm Value (MVE) on Monitoring Committee and Board Independence Relative to Industry Averages for 109 Large Australian Companies (t-values in parentheses) Panel A: Audit committee β0 Constant 5.260 (4.32)**. β1 AUD1/INDUSTRY + 0.221 (1.30). β2 SIZE + 0.744 (12.49)**. Adjusted R2. β1 COM1/INDUSTRY + 0.099 (0.82). β2 SIZE + 0.748 (12.51)**. Adjusted R2. β1 BRDIND/INDUSTRY + 0.192 (1.22). β2 SIZE + 0.754 (12.61)**. Adjusted R2. 0.614. Panel B: Compensation committee β0 Constant 5.294 (4.31)**. 0.610. Panel C: Full board β0 Constant 5.070 (4.07)**. 0.613. * Two-tailed p<0.05, **Two-tailed p<0.01 MVE = the natural log of the market value of ordinary equity. AUD1/INDUSTRY = proportion of independent directors on the audit committee relative to industry average proportion of independent directors on the compensation committee. COM1/INDUSTRY = proportion of independent directors on the compensation committee relative to industry average proportion of independent directors on the compensation committee. BRDIND/INDUSTRY = proportion of independent directors on the full board relative to industry average proportion of independent directors on the full board. SIZE = the natural log of mean total revenues between 1995 and 1997.. 31.
(32)
Figure


+3


Related documents
Help Text: A successful answer will provide the details of the solution your organization will implement and evidence to support that the solution will be effective.. What will
After controlling for the sets of demographic variables, the set of essential preparation practices measured through the School Leadership Questionnaire (mean of 11 items)
In 2015, we revised our Group sustainability strategy, considering our aims against four core pillars: health; safety; environment; and community & human rights.. This review
When using Pepperl+Fuchs Segment Protectors in combination with Fieldbus Power Supplies to generate Ex ic rated spur outputs, the delivered separation wall has to be plugged on
In this paper I use an extensive dataset of hourly and daily data points from the Norwegian and Danish transmission system operators (TSO’s), Nordpool - the central exchange, and
The dynamic capabilities literature posits that ambidexterity as a dynamic capability rests on the ability of leaders/managers to not only articulate their firm’s strategic
As a weekly webinar, the course will include presentations from subject matter experts throughout Canada who will contextualize military mental and physical health needs and
The monthly budget amount shall be calculated by the utility on the basis of the estimated consumption and estimated applicable rates through the end of the budget year. A budget
