Delimiting coral species using alternative techniques: Montipora digitata (Dana, 1846), a case study
215
0
0
Full text
(2) To Ann.
(3) Frontispiece. Fat fingers (PP) and yellow spatulate (YS) morphs of Montipora digitata (Dana 1846): are they morphs or species?.
(4)
(5) Delimiting coral species using alternative techniques: Montipora digitata (Dana, 1846), a case study. Thesis Submitted by Ben Stobart BSc (Joint Hons) (Bangor) in August 1994 for the Degree of Doctor of Philosophy in the Department of Marine Biology at James Cook University of North Queensland.
(6) ACCESS TO THIS THESIS I, the undersigned, the author of this thesis, understand that James Cook University of North Queensland will make it available for use within the University Library and, by microfilm or other photographic means, allow access to users in other approved libraries. All users consulting this thesis will have to sign the following statement: "In consulting this thesis I agree not to copy or closely paraphrase it in whole or in part without the written consent of the author; and to make proper written acknowledgement for any assistance which I have obtained from it." Beyond this, I do not wish to place any restriction on access to this thesis.. Ben Stobart .. This day:. /I. i. (9'4'.
(7) ABSTRACT High levels of intra-specific skeletal variability and considerable overlap of skeletal characters between species pose problems for the application of traditional taxonomic methods. Such problems can be overcome using alternative techniques. In this study, four alternative techniques were used to investigate the species status of two sympatrically occurring morphs of Montipora digitata (Dana 1846) found on inshore reefs along the Queensland coast, Australia. Allozyme electrophoresis indicated that gene flow does not occur between the two morphs, which were distinguished by one fixed gene difference at locus LT-2 and frequency differences at three other loci. These differences were consistent at three locations separated by up to 300 km. The genetic distinctiveness of the two morphs is further supported by the comparatively high values of Nei's genetic distance between morphs (0.24), in contrast to low values within populations of the two morphs (0.01). Populations of both morphs were generally in Hardy-Weinberg equilibrium verifying that sexual recruits contribute to the genetic structure of the populations. Low genetic diversity ratios (Go:GE), despite sampling designed to reduce the chance of collecting clonemates, indicated that asexual reproduction also occurs. Breeding experiments demonstrated that fertilisation occurs readily among colonies of the same morph, but that there is virtually no fertilisation between morphs. Reproductive hierarchies detected within the two morphs may indicate a more complex breeding structure within each population. Gamete interaction experiments revealed that the block to fertilisation between morphs occurs before egg activation. It is suggested that incompatibility of egg-sperm binding proteins is the most likely reason for reproductive isolation between the morphs. Breeding experiments involving nine species of Montipora demonstrated that hybridisation occurs within the genus Montipora in vitro, but not at high levels, and survival of hybrid juveniles was poor. Hybridisation is therefore unlikely to play a major role in the evolution of the genus. Univariate and multivariate morphometric analyses based on five skeletal characters revealed that there are significant differences in skeletal morphology between the two morphs. Considerable overlap in these characters, however, makes them unsuitable for species identification. Septal shape was found to reliably separate the two morphs. In view of the concurrence among genetic, breeding and morphological data, and examination of holotypes, the two morphs were renamed M. tortuosa (Dana 1846) and M. digitata (Dana 1846).. ii.
(8) Abstract. Comparison of a number of reproductive characters indicates that the two species, M. tortuosa and M. digitata, differ in their reproductive biology. Montipora tortuosa produced more eggs per polyp and larger testes, and a greater percentage of polyps within the colonies produced eggs. However, M. digitata produced larger eggs, a strategy that made the total reproductive output between the two species equivalent. The reproductive study also revealed that these two species, and several other species within the genus Montipora, spawn in both spring and autumn. Reproductive outputs differed between the two breeding seasons. Differences in reproductive output and contrasting environmental conditions during the two spawning seasons are discussed in relation to ultimate and proximate cues governing coral spawning. Values for Nei's genetic distance suggest that the two species evolved 3.5 to 7.1 million years ago. Morphological and ecological similarities between M. tortuosa and M. digitata indicate that they have not diverged substantially in this time, they probably evolved in the same habitat in which they are found today, and they are most likely monophyletic in origin. It is argued that speciation of M. tortuosa and M. digitata may have resulted from stochastic changes to egg-sperm binding proteins on the egg surface. Reproductive hierarchies within the species support the existence of molecular variability in these proteins which may have led to reproductive isolation between M. tortuosa and M. digitata. Studies on mass spawning corals so far have found high levels of hybridisation suggesting that they do not conform to most species concepts. In contrast, M. tortuosa and M. digitata show most of the qualities of "good" morphological, biological, ecological and evolutionary species.. iii.
(9) ACKNOWLEDGMENTS. I am very grateful to all the people that have helped me over the past three and a half years, this work would not have been possible without their kindness and expertise. I would like to start by thanking all those who have been mad enough to help with the gruelling overnight coral spawning experiments - Keith Martin-Smith, Allen Chen, Bill Burnett, Li Shu Chen, Sarah Stobart, Bette Willis, Carden Wallace, Terry Hughes, Jason Tanner, Francis Pantus, Craig Mundy, Karen Miller, Potchana Bonyanante, Vachira Lheknim, Jackie Wolstenhohne, James Gilmour, Mandy Young, Goslick Schepers, Bill Leggat, Bob Stephens, Bobby Beaman, Molly Cummings, Emma Hutchinson, Joe Goudie and Meredith Campey. I am particularly grateful to my "elite spawning crack-team" - Smithers, Billy Burnett and Allen - to which I say "Wibble" (Black Adder 1991). Many others have assisted with fertilisation experiments in one way or another, I gratefully acknowledge their help. I was also assisted on other trips by Corina Sullivan, Dave Booth, Giglia Beretta, and Tim .. Lynch. Special thanks to Natalie Moltzanifjksky and Mark McCormick for help with the nightmare (statistics), Carden Wallace and Charlie Veron (for access to coral samples), Russel Jaycock and the ToWnsville Meteorology Bureau (weather data), Ray Berkelmans, Jamie Oliver and the Great Barrier Reef Marine Park Authority (for temperature data), Jim Darley and Heather Windsor (for help with electron microscopy) and Zolly Florian (for help with photomicroscopy). I also thank all of those who have contributed to this thesis by means of discussion and comments. In particular Russ Babcock, John Benzie, John Collins, Peter Harrison, Terry Hughes, Keith Martin-Smith, Karen Miller, Craig Mundy, Francis Pantus, Joanna Pitt, Mary-Stafford Smith, Charlie Veron, Greg White, Bette Willis and the Coral Discussion Group. For generosity in lending their equipment and facilities I thank Howard Choat, The Australian Institute of Marine Science, James Cook University of North Queensland, Lee Fitzpatrick, and Uncle Bernie's Party hire. I owe special thanks to my supervisors: John Benzie, Terry Hughes and Bette Willis, who have provided me with a great deal of support over the past few years. I am particularly grateful to Bette Willis for enduring the torture of reading my entire thesis, and for her creative input and financial support.. iv.
(10) Acknowledgments. Financial support was provided by a CFSP scholarship and a GBRMPA augmentative grant. I particularly thank the administrators of the CFSP for making my stay in Australia trouble-free. My good friend Guillermo Cryns has given me a great deal of support and encouragement over the past few years, and has made collection of samples in Papua New Guinea possible. iMuchas gracias Guillermo! Completion of a thesis can be a very stressful task, but can be made easier with a bit of encouragement at the correct moments: I thank my wife Sarah, John Benzie and Keith-Martin Smith for their impeccable timing. Finally I thank my family for having faith in my abilities without ever requiring any proof of them; I will never forget that..
(11) TABLE OF CONTENTS Frontispiece Title Statement of Access Abstract Acknowledgments Table of Contents List of Tables List of Plates List of Figures Declaration Chapter 1: General Introduction _ 1.1 Systematics of scleractinian corals 1.2 The biological significance of morphological species 1.3 Introduction to the genus Montipora de Blainville, 1830 1.4 Montipora digitata: a case study. iv vi. xi xiii xiv. 1 1 4 6 7. Chapter 2: Genetic differentiation between two morphs of Montipora digitata (Dana 1846) using allozyme electrophoresis 2.1 Introduction 2.2 Materials and methods 2.2.1 Study sites 2.2.2 Sampling and storage 2.2.3 Screening for enzyme systems 2.2.4 Sample preparation 2.2.5 Statistical analyses 2.3 Results 2.3.1 Enzymes surveyed 2.3.2 Details of systems used in this study 2.3.3 Survey results 2.4 Discussion. 11 11 12 12 14 17 18 19 20 20 20 23 35. Chapter 3: Reproductive compatibility within the genus Montipora 3.1 Introduction 3.2 Materials and methods. 40 40 43 vi.
(12) Table of contents. 3.2.1 Study sites 3.2.2 Pre-spawning protocols 3.2.3 Obtaining and crossing coral gametes 3.2.4 Egg activation experiments 3.2.5 Data analysis 3.3 Results 3.3.1 Crosses between morphs of Montipora digitata 3.3.2 Egg- sperm interaction 3.3.3 Between species crosses 3.3.4 Inter-annual variability in fertilisation success 3.4 Discussion. 43 43 43 46 47 47 47 51 54 54 57. Chapter 4: Morphometric study of two morphs of Montipora digitata 4.1 Introduction 4.2 Materials and methods 4.2.1 Collection of colonies 4.2.2 Morphometric analysis Corallite measurements: Colony measurements: 4.2.4 Septal morphology of juvenile Montipora digitata. 4.2.5 Validating septal shape as a distinguishing character 4.2.6 Examination of museum collections 4.2.7 Statistical analyses 4.3 Results 4.3.1 Morphometric analysis 4.3.2 Septal morphology 4.3.3 Morphology of juveniles 4.3.4 Comparison with museum specimens 4.4 Discussion t. 62 62 64 64 64 65 67 68 69 69 69 70 70 76 81 81 85. Chapter 5: The reproductive ecology of Montipora tortuosa and M. digitata 5.1 Introduction 5.1.1 Coral reproductive ecology 5.1.2 The costs of reproduction 5.1.3 Using reproductive traits in taxonomy 5.2 Materials and methods 5.2.1 Study sites 5.2.2 Comparisons of gametogenesis between M. tortuosa and M. digitata. 91 91 91 93 94 95 95 95 vii.
(13) Table of contents. 5.2.3 Comparisons of reproductive output between M. tortuosa and M. digitata 5.2.4 Spawning patterns of M. tortuosa and M. digitata 5.2.5 Spawning observations 5.2.6 Spawning patterns of other Montipora species 5.2.7 Sperm morphology 5.2.8 Growth differences between M. tortuosa and M.. 96 96 97 97 98. digitata 5.2.9 Resource allocation for growth and reproduction. 100. between breeding seasons 5.2.10 Environmental parameters 5.2.11 Statistical analyses 5.3 Results 5.3.1 Interspecific differences in reproductive traits Timing of gametogenesis: Percentage of egg-bearing polyps: Mean egg number: Mean egg size: Testes sizes: Reproductive output: Hour of spawning: Sperm morphology: Comparisons of growth rate between M. tortuosa and M. digitata: 5.3.2 The reproductive ecology of M. tortuosa and M. digitata Reproductive seasonality: Comparison of breeding intensity between the spring and autumn breeding seasons: Spawning synchrony: month of spawning Spawning synchrony: night of spawning 5.3.3 Does M. tortuosa partition energy between growth and reproduction to sustain two breeding seasons. 100 101 101 102 102 102 102 102 108 112 112 114 116 116 119 119 119 119 122. annually? 5.3.4. Spawning patterns of plate species of Montipora: Spawning synchrony: month of spawning Spawning synchrony: night of spawning 5.3.5 Variation in physical parameters relative to spawning. 123 123 123 128. periods. 128 viii.
(14) Table of contents. 5.4 Discussion 5.4.1 Interspecific differences in reproductive traits 5.4.2 The reproductive ecology of M. tortuosa and M. digitata. Chapter 6: General discussion. 6.1 The species status of Montipora digitata 6.2 Biological significance and species concepts 6.3 Factors mediating the coexistence of M. digitata and M. tortuosa. 6.4 Phylogeny of Montipora tortuosa and M. digitata 6.5 Conclusions. 131 131 134 143 143 144 147 149 152. References cited. 154. Appendix. 173+. Publications arising from this thesis. 173+. ix.
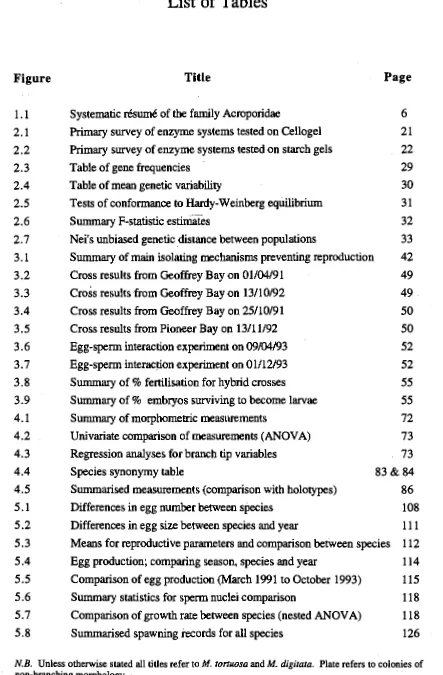
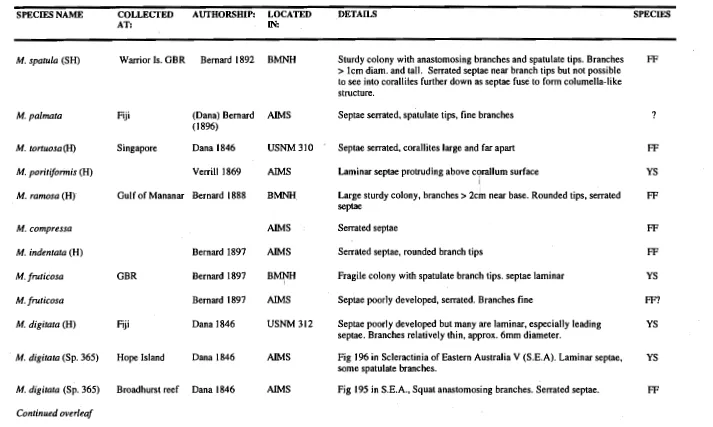
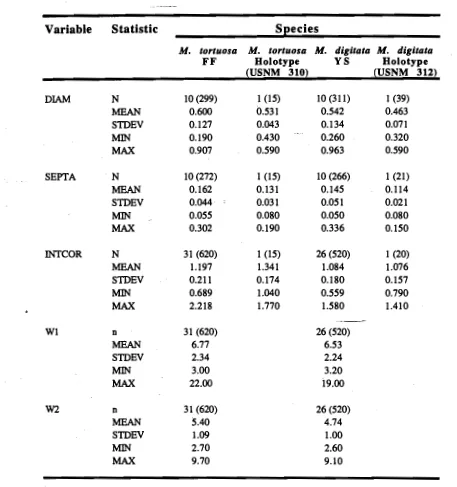
(15) List of Tables. Figure 1.1 2.1 2.2 2.3 2.4 2.5 2.6 2.7 3.1 3.2 3.3 3.4 3.5 3.6 3.7 3.8 3.9 4.1 4.2 4.3 4.4 4.5 5.1 5.2 5.3 5.4 5.5 5.6 5.7 5.8. Title. Page. 6 Systematic résumé of the family Acroporidae 21 Primary survey of enzyme systems tested on Cellogel 22 Primary survey of enzyme systems tested on starch gels 29 Table of gene frequencies 30 Table of mean genetic variability 31 Tests of conformance to Hardy-Weinberg equilibrium 32 Summary F-statistic estimates 33 Nei's unbiased genetic distance between populations 42 Summary of main isolating mechanisms preventing reproduction 49 Cross results from Geoffrey Bay on 01/04/91 49 Crois results from Geoffrey Bay on 13/10/92 50 Cross results from Geoffrey Bay on 25/10/91 50 Cross results from Pioneer Bay on 13/11/92 52 Egg-sperm interaction experiment on 09/04/93 52 Egg-sperm interaction experiment on 01/12/93 55 Summary of % fertilisation for hybrid crosses 55 Summary of % embryos surviving to become larvae 72 Summary of morphometric measurements 73 Univariate comparison of measurements (ANOVA) 73 Regression analyses for branch tip variables 83 & 84 Species synonymy table 86 Summarised measurements (comparison with holotypes) 108 Differences in egg number between species 111 Differences in egg size between species and year Means for reproductive parameters and comparison between species 112 114 Egg production; comparing season, species and year 115 Comparison of egg production (March 1991 to October 1993) 118 Summary statistics for sperm nuclei comparison 118 Comparison of growth rate between species (nested ANOVA) 126 Summarised spawning records for all species. N.B. Unless otherwise stated all titles refer to M. tortuosa and M. digitata. Plate refers to colonies of non-branching morphology..
(16) List of Plates Title Page. Figure. 2.1 2.2 2.3 4.1 4.2 4.3 5.1 5.2. Map of study sites at Magnetic Island Starch gel zymogram stained for LT Starch gel zymogram stained for PGM Scanning electron micrographs of skeleton (corallites) Scanning electron micrographs of corallites (longitudinal section) Scanning electron micrographs of juvenile corallites Spermatozoon of M. digitata (Transmission Electron Micrograph) Comparison of sperm-head morphology (T. E. M.). 15 25 25 79 80 82 99 117. xi.
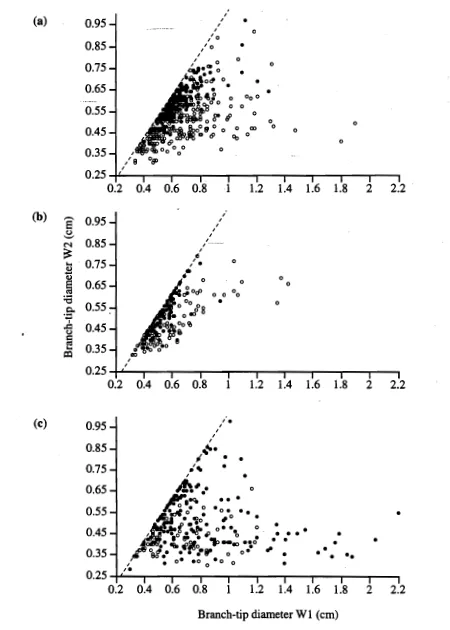
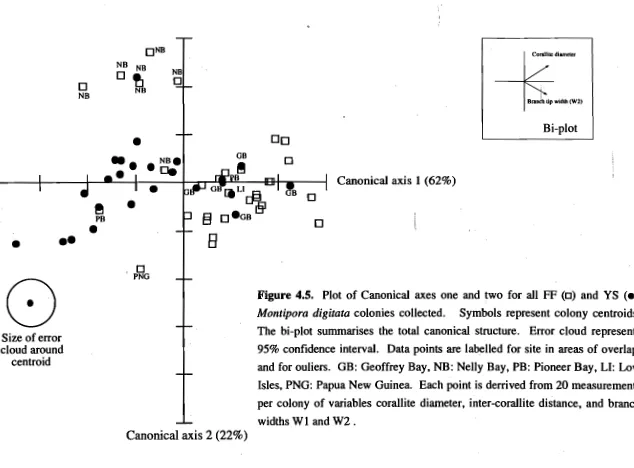
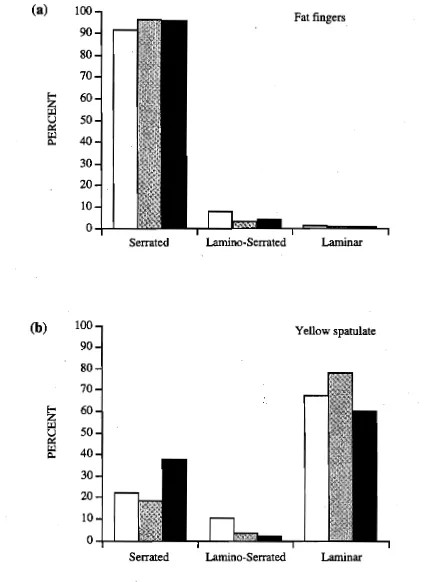
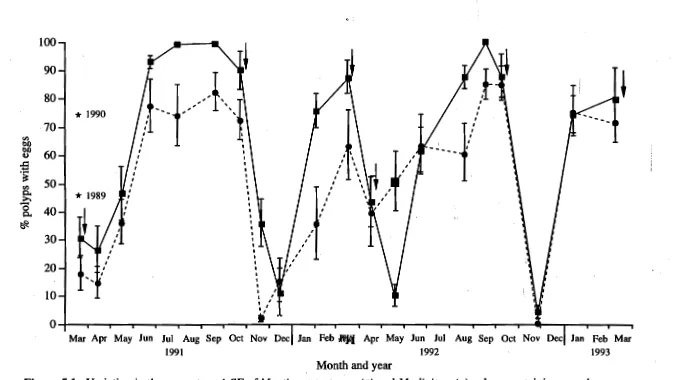
(17) List of Figures. Figure 1.1 2.1 2.2 2.3 2.4 2.5 2.6 2.7 2.8 3.1 3.2 3.3 3.4 3.5 4.1 4.2 4.3 4.4 4.5 4.6 5.1 5.2 5.3 5.4 5.5 5.6 5.7 5.8 5.9 5.10 5.11 5.12. Title. Page. 9 Drawing of Montipora tortuosa and M. digitata 13 Map of location of all study sites 16 Maps of Palm Islands and Low Isles study sites 24 Enzyme variants observed for LT 24 Enemy variants observed for LGG 26 Enzyme variants observed for PGM 26 Enzyme variants observed for MDH and ME 27 Principal coordinates plot for all unique 5-locus genotypes 34 Dendrogram of Nei's unbiased genetic distances 45 Grid outline for crosses within and between species 46 Experimental design for egg activation experiments 48 Summary of % fertilisation between M. digitata morphs 53 Summary of egg activation experiments 56 Comparison of % crosses working and percent fertilisation 66 Corallite-level measurements made for morphometric analysis 68 Branch-tip measurements made for morphometric analysis 74 Branch-tip comparison between M. tortuosa and M. digitata Canonical discriminant analysis plot ("good" FF and YS examples) 75 77 Canonical discriminant analysis plot (all colonies sampled) 78 Percentage of serrated, lamino-serrated and laminar septa 103 Comparison of % polyps containing eggs 104 Comparison of mean number of eggs per polyp 105 Comparison of mean egg size 106 Gametogenic cycle for 2 individual M. tortuosa colonies 107 Gametogenic cycle for 2 individual M. digitata colonies 109 Frequency histograms of No. eggs per polyp (1991-1993) 110 Frequency histograms of egg size in March-May 1992 113 Frequency distributions of testes size 115 Average egg production (mm 3/cm2; March 1991 to October 1993) 116 Spawning time comparison between M. tortuosa and M. digitata Comparison of % reproductive colonies between seasons and bays 120 121 Variation in breeding synchrony in March and April xi i.
(18) List of figures. 5.13 5.14 5.15 5.16 5.17 5.18 5.19 5.20 5.21. Variation in breeding synchrony in October and November Comparison of spawning time between sites and species Comparison of growth, and growth-reproduction trade-offs Growth-reproduction trade-offs (egg and testes size) % reproductive plate Montipora (comparing sites and seasons) % reproductive plate Montipora (comparing March and April) Comparison of spawning time between sites (plate Montipora) Average daily seawater temperature Dec-91 to Mar-94 Summary of physical conditions in relationto spawning dates. 121 122 124 125 127 129 129 130 132. N.B. Unless otherwise stated all titles refer to M. tortuosa and M. digitata. Plate refers to colonies of non-branching morphology..
(19) DECLARATION I declare that this thesis is my own work and has not been submitted in any form for another degree or diploma at any university or institution of tertiary education. Information derived from the published or unpublished work of others is acknowledged in the text and a list of references is given.. xiv.
(20) General Introduction The origins of taxonomy as a way of thinking have been lost in antiquity (Blackwelder 1967). In its most basic form taxonomy is the recognition and classification of "kinds". As a science it generally refers to the methods and principles of classification of any group of organisms (Simpson 1961). The need to classify organisms is so basic that it is claimed to be fundamental to intelligence and communication as man practices it (Blackwelder 1967), and it can be identified in other living organisms that can recognise their own kind, kinds that are dangerous to them and kinds that provide them with food. Species are the fundamental category of the taxonomic hierarchy (Stuessey 1990), and as such have received a great deal of attention. The number of species that have been described to date using Latin binomial names is unknown, but are probably in the order of 1.5-1.7 million (Wilson 1985, May 1988). This figure is insignificant in comparison to the tens of millions of species that are suspected to inhabit the earth (May 1988). Traditionally species have been defined on structural (morphological) grounds because structural data is often the only data available for identification purposes, and it is relatively easy to obtain (Blackwelder 1969). However taxonomy is a dynamic science that often draws on physiological, ethological, genetical and ecological data, amongst other things (Blackwelder 1969, Stuessey 1990). Any technique that identifies differences between species may be employed for taxonomic purposes. Closely associated with taxonomy is the study of systematics. Though at one time considered to be synonymous with taxonomy, systematics now has a broader meaning than taxonomy as it includes the study of evolution and phylogeny. Systematics is currently defined as "the scientific study of the kinds and diversity of organisms and of any and all relationships among them" (Simpson 1961). The aim of systematics is not just to describe pattern, but also to explain it, and as such is a natural extension that has evolved from the process of classification. 1.1 Systematics of scleractinian corals. The taxonomy of scleractinian corals is almost exclusively based on skeletal characters (Vaughan and Wells 1943, Veron and Pichon 1976), and different species 1.
(21) Chapter I: Introduction. "are expected to be separated from each other by distinct morphological gaps" (Lang 1984). These "morphological gaps" form the basis of the morphological species concept and still constitute the most accessible and widely used method for identifying species (Stuessey 1990). Though the morphological approach to species identification generally works well for most animal groups, its use becomes limited when morphological characters overlap between species. Overlap of morphological characters between species has often been reported for scleractinian corals, and consequently systematists have experienced great difficulty in delineating species boundaries in some genera (Lang 1984). Perhaps one of the most important factors promoting overlap of morphological characters is that species within many genera of scleractinian corals can exhibit high levels of skeletal variability (eg. Porites: Veron and Pichon 1982; Acropora: Veron and Wallace 1984). In extreme cases corallites within a single colony are so different that they_can be assigned to different species (Potts et al. 1993). Skeletal variation is governed by both environmental and genetic effects. Environmental conditions are known to affect the morphology of corals, both at the colony level (Willis 1985) and the corallite level (Foster 1977). There are two mechanisms by which coral morphology may vary with different environmental conditions. Corals may either change their growth form in response to the environment (phenotypic plasticity), or, genotype-environment associations may be determined by selection at the. recruitment stage, with adult colonies being unable to alter their growth form (genotypic polymorphism)(Willis 1985). Phenotypic plasticity has been demonstrated to occur in corals by means of transplant experiments (Foster 1979, Graus and Macintyre 1982, Oliver 1984, Willis 1985). It is thought that coral phenotypes can be influenced by environmental factors such as light intensity, sedimentation rate, water activity, and food availability (Foster 1979, Willis 1985). No study has yet demonstrated that environmental factors directly affect the distribution of corals with phenotypically stable morphs, but there is little doubt that morphological variation which is genetically based does occur (Foster 1979, Willis 1985, Willis and Ayre 1985), and environmental variation governs the distribution of different morphs of a wide variety of organisms (Begon 1990). There is indirect evidence suggesting environmental variability can govern the distribution of phenotypically stable coral morphs. For example, Willis (1985) found that phenotypically stable morphs of Pavona cactus tended to be associated with different depths, but there was a considerable amount of overlap in depth distributions between the two morphs. This observed distribution pattern, with different morphs occupying particular areas and overlap of morphs between the areas is expected for the active. 2.
(22) chapter. 1:. introauction. maintenance of genetic polymorphisms (Begon 1990). Variation in coral morphology that is not associated with environmental conditions can also occur. Genotypic polymorphism can result in morphological variation that is not environmentally correlated (eg. ecological interactions can affect the distribution of clover genotypes; Turkington and Harper 1979), and hybridisation between species can produce individuals of intermediate morphology. Recent research on corals has revealed that experimental hybridisation between species occurs readily (Willis et al. 1992, Miller 1994). If hybridisation is also common in the natural environment much morphological variation may be attributed to hybrids. The overlap of skeletal characters has always posed a problem to coral taxonomists. Early taxonomists were unable to cope with the extent of the skeletal variability, and consequently described every different specimen as a new species. The resulting taxonomy was extremely confused with too many species being described (Veron and Pichon 1977). Major oceanographic expeditions at the end of the nineteenth century, in particular the Challenger expedition of 1873-1876, marked a changing point for coral taxonomy. Larger coral collections became available to taxonomists, and variability of skeletal characters was recognised as a major problem (Veron and Pichon 1976). Most significantly, Quelch (1886) related intraspecific variation in skeletal characters to environmental conditions. Awareness of the influence environmental variability can have on coral skeletons has revolutionised coral taxonomy. The term "ecomorph" was introduced to the taxonomic literature in 1976 by Veron and Pichon to describe "intraspecific skeletal variations phenotypically and/or genotypically determined in response to specific ecological conditions". Thus this phenomenon was taken into account in subsequent monographic works (Veron and Pichon 1976, Veron et al. 1977, Veron and Pichon 1979, Veron and Pichon 1982, Veron and Wallace 1984). These taxonomic studies greatly reduced the confusion surrounding coral taxonomy as they strived to account for phenotypic plasticity and genetic polymorphism. The final outcome was a more streamlined taxonomy in which many species were synonymised. However, inevitably some true species are likely to have been synonymised on the assumption that they were ecomorphs, or examples of genetic polymorphism (Wallace and Willis 1994). It is also likely that within currently accepted species there will be instances of sibling species or pseudo-sibling species, as there is growing evidence that these may occur in corals (Knowlton 1993, Knowlton and Jackson 1994). Taxonomy of Indo-Pacific corals is now at the stage where many of the classification problems that earlier workers grappled with unsuccessfully have been. 3.
(23) Chapter 1: Introduction. resolved. A much needed framework on which to build and improve has been established by Veron and his co-workers. The task now is primarily one of identifying species that may have been mistaken as "ecomorphs" and synonymised, and to identify possible sibling species. Identification of these species is not an easy task, particularly as they have been synonymised, or simply not distinguished, due to the fact that their skeletal characters overlap. As traditional taxonomic techniques have not been able to delimit these species, there is general agreement that the best way to resolve taxonomic problems is by using a combination of alternative techniques (Lang 1984, Willis 1990, Gattuso et al. 1991, Garthwaite et al. 1994). The use of alternative techniques for coral taxonomy has been reviewed by Lang (1984), and further discussed by Willis (1990). Any feature that may differ between coral species can potentially be of use for species identification, be it morphological, biochemical physiological, behavioural or ecological (Lang 1994). In recent years studies have used morphometrics (Potts et al. 1993, Miller in press), allozyme electrophoresis (Ayre et al. 1991b, Knowlton et al. 1993, Garthwaite et al. 1994), physiological characteristics (Gattuso et al. 1991, Knowlton et al. 1993), nematocyst morphology (Hidaka 1992), reproductive compatibility experiments (Willis et al. 1992, Miller 1994), and live tissues (Potts et al. 1993) to investigate species boundaries of scleractinian corals. Alternative techniques are therefore gaining popularity, and will undoubtedly play an important part in delimiting species boundaries where traditional taxonomy has problems.. 1.2 The biological significance of morphological species. A major role of taxonomy is to identify biologically significant patterns of organisms (Szalay 1993). This is important as the ultimate goal of taxonomy is to systematise data on all the kinds of organism that exist, for the use of other disciplines (Blackwelder 1969). Discernment of biologically significant patterns of organisms is unlikely without an understanding of the biological mechanisms that create and maintain species (Szalay and Bock 1991). Therefore once a classification of species has been made on morphological grounds it is important to assess its biological significance. There is general agreement that species defined morphologically do correspond with species that are defined genetically (Michaux 1989, Jackson and Cheetham 1990). Traditionally it has been assumed that species are groups of reproductively isolated organisms (Mayr 1940, 1963, 1973), however, reproductive isolation is only suitable for describing species in sexually reproducing organisms, and can be unsuitable if sexually reproducing species hybridise extensively (Templeton 1989). In cases where species do hybridise extensively their identity may be maintained by demographic exchangeability, despite gene exchange between them. 4.
(24) Chapter 1: Introduction. (Templeton 1989). It is therefore important to study the biological basis for morphological groups, as the assumption that morphologically defined species correspond to reproductively isolated species is not always valid. The study of species boundaries is also paramount to the understanding of how species come to exist (speciation), how they relate to each other over time (phylogeny), their past history (evolution) and how they interact with each other (ecology). At present we know relatively little about the biological validity of coral species, how they are formed, and how the integrity of species is maintained. Until recently there has been a tacit acceptance that morphologically defined coral species are reproductively isolated (reviewed in Willis 1990). In many cases this assumption may be reasonable as most genetic studies have found evidence of reproductive isolation between morphologically defined species (Ohlhorst 1984, Ayre et al. 1991, Van Veghel and Bak 1993, Garthwaite et a/. 1994). However, recent research has cast serious doubts on the validity of this assumption, as experimental crosses between species in three of the most common coral genera have demonstrated that levels of interspecific hybridisation can be very high (Willis et al. 1992). It is now thought that morphologically-defined species may not always reflect reproductive isolation, though it still remains to be demonstrated that levels of experimental hybridisation also occur in the natural environment (Willis et al. ins). A further goal for coral research should therefore be to establish how widespread reproductive isolation and hybridisation is between coral species. This is important in order to establish the biological basis of morphologically defined coral species. The importance of determining the biological relevance of coral species defined by taxonomists has recently been highlighted by Jokiel (1987), who suggested that the morphological definition of Pocillopora damicornis is not sensitive enough to reflect evidence of .divergent evolution. Comparisons of populations of the same morphological species of P. damicornis from Hawaii with populations from Enewetak, Panama and south western Australia showed each population was very different in ecological terms, but not morphologically. The geographic differences in biology supported a hypothesis of divergent evolution, but morpological criteria expressed no such trend. This highlights the urgent need to determine how well coral species defined by taxonomy reflect groupings of organisms that are meaningful for questions about the ecology, evolution and speciation of corals. A major priority in the study of coral species should be to explore species boundaries using suitable alternative taxonomic techniques such as allozyme electrophoresis, crosses of gametes to test for evidence of reproductive isolation and ecological studies to determine whether different species are ecologically similar or not. 5.
(25) Chapter I: Introduction. This will also provide vital information (genetic, reproductive and ecological) for the study of most other aspects of coral biology and evolution. The coral genus Montipora has had a tortured taxonomic history (Veron and Wallace 1984). Taxonomic progress has been hampered largely due to small corallites, undeveloped corallite features and high levels of morphological variation typical of the genus (see section 1.3). This study aims to use alternative taxonomic techniques to clarify a taxonomic problem within the genus Montipora, to investigate possible species cohesion mechanisms between coral species, and to assess the biological significance of some species within this genus.. 1.3 Introduction to the genus Montipora de Blainville, 1830. The genus Montipora belongs to the family Acroporidae along with three other extant genera. Members of this family are characterised by having small corallites, rudimentary or no columellae and dissepiments, simple septa in two cycles or less, synapticulotheca, and polyps that divide by extra-tentacular budding (Veron and Wallace 1984). The family Acroporidae exhibits all growth forms known for hermatypic corals. Of the four genera in the Acroporidae the genus Astreopora is the only one that does not conform to these features, having larger corallites and relatively well developed septae. A systematic résumé of the Acroporidae is given in Table 1.1.. Phylum Cnidaria (Coelenterata) Class Anthozoa Subclass Hexacorallia (Zoantharia) Order Scleractinia Family Acroporidae Verrill, 1902 Acropora Ogen, 1815 Genera: Anacropora Ridley, 1884 _ Astreopora de Blainville 1830 Montipora de Blainville, 1830 Table 1.1. Systematic résumé of the family Acroporidae Within the Scleractinia the genus Montipora is the second largest in terms of numbers of species, having 211 nominal species and an unknown number of true species. In Australia alone there are 38 recognised species (Veron, 1986). Colonies of this genus often contribute significantly to overall coral cover of reefs (Wood 1983, pers. obs.). Despite these attributes the genus Montipora is the least studied of the. 6.
(26) Chapter 1: Introduction. major scleractinian genera (Veron 1986). This is probably due to the difficulties involved in identifying many of the species, and the fact that many of the species are inconspicuous, being encrusting or forming small plates (Veron 1986). The corallites of Montipora species are the smallest of all corals, which further adds to the difficulties involved in their identification. Members of the genus Montipora may form leafy, encrusting, plate-like, branching, or semi-massive colonies, with numerous intermediary forms. Size varies considerably, encrusting and massive forms tending to be relatively small, whereas foliaceous and plate-like forms may produce colonies several meters in diameter. Septal apparatus are poorly developed (a feature used to distinguish this genus from Porites), and they have a well developed coenosteum. Calices are approximately 0.5 mm in diameter and rarely greater than 1 mm. Columellae are absent, although occasionally septae may fuse to form a central column. There are typically six primary septae in the form of vertical rows of spines, the more conspicuous primaries occasionally being either continuously or interruptedly laminate, and secondary septae are also usually present. The coenosteum is porous and often highly elaborated with spinules, its development often overshadowing that of the corallites. Coenosteal features have thus been used for species identification. The coenosteum may be plain without elaborations of any kind or it may have developed elaborations in the form of tuberculae (if larger than the corallite) or papillae (if smaller than the corallite) or a combination of these (Veron and Wallace, 1984). It must however be noted that this definition is erroneous according to the earlier work of Bernard (1897) who states quite clearly that the papillae are large and the tubercles small. No costae or dissepiments are formed in the Montipora. Distribution of the genus is extensive, ranging from the Red Sea through to the Mid-Pacific region (extends East to the Marquesas, Hawaii and Pitcairn; North to Japan, the Arabian Gulf and the Red Sea; South to the Houtman Abrolhos Islands, Lord Howe Island and Durban), however this genus does not occur in the Eastern Pacific or the Caribbean.. 1.4 Montipora digitata: a case study. This study concentrates almost exclusively on the taxonomic status of two morphs of Montipora digitata. Montipora digitata is a distinctive small branching coral common on inshore reefs along the Queensland coast. Its distribution is primarily limited to the reef flat zone where it is often the most abundant coral species (Bull 1982). Colonies of M. digitata may be divided into several morphs. Veron and 7.
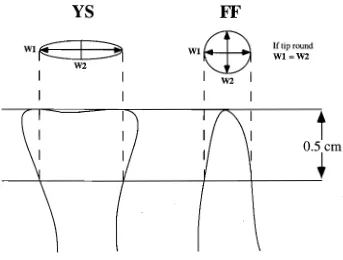
(27) Chapter 1: Introduction. Wallace (1984) recognise three distinct ecomorphs of this species. Many additional morphs were detected in the present study but only two morphs were easily identifiable and were detectable over a wide geographic area. One morph is grey-brown with cylindrical branches and round tips, the other, greenish yellow with round or laterally compressed branches that end in frond-like (spatulate) tips (Figure 1.1). For convenience these two morphs will be referred to as "fat fingers" (FF) and "yellow spatulate" (YS), respectively. Preliminary crosses of gametes from these two morphs indicated that they may be reproductively isolated (Willis et al. 1992), suggesting that further study of species boundaries was required.. 8.
(28) Fat fingers. Yellow spatulate. ■1). Figure 1.1. Typical morphology of fat fingers and yellow spatulate morphs of Montipora digitata..
(29) Chapter 1: Introduction. 1.5 Aims and Objectives. The aim of this study is to use several alternative taxonomic techniques to study the species status of two morphs of Montipora digitata, and to use the techniques to compare and contrast the results of traditional and alternative taxonomy. The ultimate goal is to determine the biological basis for the two morphs (or species). These aims were addressed using the following approaches: Are the two morphs different species? Allozyme electrophoresis is first used to determine whether there is evidence of gene flow between the two morphs. This technique can be used to demonstrate reproductive isolation between species, and is particularly useful for detecting sibling species. [Chapter 2] How do they maintain their species integrity? Breeding experiments are used as an independent test of the findings of the electrophoretic study, and then to investigate how species integrity is maintained. Breeding experiments are also used to assess reproductive compatibility both within the morphs, and between the morphs and other species in the genus Montipora. [Chapter 3] Could traditional taxonomic techniques be used to define the two species? A detailed morphometric study is carried out based on numerical taxonomic techniques to determine whether the two species can be distinguished morphologically or whether they should be considered sibling species. [Chapter 4] Is there evidence the two have diverged in their reproductive ecology and biology ? A detailed study of the reproductive ecology and growth of the two species is conducted to determine whether there is any evidence of divergence in these aspects of their life history and biology. The reproductive ecology of the two morphs is also compared to that of some other species within the genus Montipora. [Chapter 5] Finally the findings of this study are discussed in relation to the evolution of coral species, mechanisms of speciation, and the ecological relevance of species described by traditional taxonomy. [Chapter 6]. 10.
(30) Chapter 2 Genetic differentiation between two morphs of Montipora digitata (Dana 1846) using allozyme electrophoresis 2.1 Introduction Due to the high levels of intraspecific skeletal variation exhibited by corals, and the overlap of morphologial characters between species, traditional taxonomic techniques are not always sensitive enough to distinguish coral species (see Chapter 1). It has been recommended that several techniques be used simultaneously to determine species limits within the SCleractinia in order to maximise the likelihood of detecting species boundaries (Willis 1990). Numerical taxonomic techniques (Wallace 1974, Foster 1984), allozyme electrophoresis (Ohlhorst 1984), DNA hybridisation techniques (McMillan and Miller 1988) and inter-specific aggressive responses (Lang 1971, Knowlton et al. 1992) have all been used for determining the species status of corals. There are many other techniques that can be used for taxonomic purposes, but they have rarely been used (reviewed in Lang 1984). Of all the techniques available, molecular techniques have become particularly attractive to coral taxonomists. Molecular techniques provide a powerful means of detecting sibling species (Richardson et al. 1986), and the results they produce are not subject to the environmentally induced variation that can affect skeletal characters (Ohlhorst 1984, Ayala 1983). Allozyme electrophoresis is one such molecular technique that that has become extremely popular amongst taxonomists. As well as having been used extensively to detect sibling species on land (Richardson et al. 1986), allozyme electrophoresis has also been used for determining the species status of a wide range of marine taxa. These include sharks (Lavery and Shaklee 1991), bryozoans (Thorpe et al. 1978, Jackson and Cheetham 1990), molluscs (Hillis and Patton 1981, Munksgaard 1990, Morrow et al. 1992, Brickner et al. 1993, Backeljau et al. 1994, Yeatman and Benzie 1994), polychaetes (Grassle and Grassle 1976, Fong and Garthwaite 1994, Schmidt and Westheide 1994), crustaceans (Abdullah and Shukor 1993, Taylor and Herbert 1994) and cnidarians (Sole-Cava and Thorpe 1987, Sole-Cava and Thorpe 1992, Russo et al. 1994) to name a few. Allozyme electrophoresis is being used with increasing frequency to solve problems in coral taxonomy (Ohlhorst 1984, Ayre et al.. 11.
(31) Chapter 2: Genetics. 1991b, Knowlton et al. 1992, Van Veghel and Bak 1993, Brazeau and Harvell 1994, Garthwaite et al. 1994):— Results from allozyme electrophoresis have generally supported morphological interpretations of species boundaries (Ayre and Willis 1988, Ayre et al. 1991b, Van Veghel and Bak 1993, Garthwaite et al. 1994). Instances where allozyme electrophoresis contradicts the morphological results are rare (Knowlton-1992, Miller 1994), though this may be due to the relatively few electrophoretic studies carried out on corals to date. Allozyme electrophoresis has also been used for the study of coral population genetics (Stoddart 1984a, Ayre and Willis 1988, Ayre and Dufty in press), to clarify aspects of the reproductive biology of corals (Stoddart 1983, Stoddart et al. 1988), to construct phylogenies (Garthwaite et al. 1994), for testing the accuracy of histocompatibility methods to detect clones (Heyward and Stoddart 1985, Resing and Ayre 1985, Willis and Ayre 1985), and to study relative contributions of sexual and asexual reproduction (Hunter 1993, Ayre and Dufty in press). The aim of this study was to use allozyme electrophoresis to investigate the taxonomic status of Montipora digitata. Preliminary breeding trials suggested that the two morphs of M. digitata described in Chapter 1 were reproductively isolated (Willis et al. 1992). Allozyme electrophoresis offers an independent means of testing whether ° the populations of the two morphs are reproductively isolated. It was therefore hypothesised that sympatric populations of the two morphs were in fact sibling species, and should possess detectable fixed gene differences. A secondary objective of this study was to compare levels of asexual and sexual propagation between the two morphs. Mode of reproduction is an important life history trait that can also reflect species differences. Results of the electrophoresis study were also used to classify colonies into genetic groupings for subsequent reproductive and morphometric studies (chapters 3 and 4 respectively).. 2.2 Materials and methods. 2.2.1 Study sites For convenience all study sites used during the course of this work will be described here. Two main study locations, Magnetic Island and the Palm Islands, were chosen for this study. These two locations are only separated by approximately 65 kilometres, so a third location, Low Island, 275 Km north of the Palm Islands, was also used for part of this study (Figure 2.1). These locations were selected because M. digitata was abundant at all of them, and they were easily accessible. Both Magnetic Island and the Palm Islands are densely vegetated continental Islands (Hopley 1970) with fringing reefs, whereas the Low Isles are coral islands 12.
(32) ▪ Chapter 2: Genetics. 147°E. 146°E. II • 4.. •••61. ri. g. .• II 4,. ro. -16. - A 4 eh.. Low Isles. 4,„ •. •. 18°S. Palm Islands. I p. •. 19°S. •. Magnetic Island. Townsville 0 Km. 50. 100. t. Figure 2.1. Map showing the geographical location of study sites used during the course of this project.. 13.
(33) Chapter 2: Genetics. with extensive reef flats and large dense stands of mangrove. Two study sites, Nelly Bay (NB) and Geoffrey Bay (GB), were selected at Magnetic Island (19°10'S, 146°52'E). Geoffrey bay was the main study site (Plate 2.1). In both bays there are large stands of Montipora digitata on the reef flat and plate species of Montipora on the reef slope. The physical and biological setting at Magnetic Island is reviewed in detail by Morrissey (1980) and Bull (1982). In the Palm Islands the main study site was Orpheus Island (18°40'S, 146°30'E)(Figure 2.2a). Corals were sampled from Pioneer Bay (PB), Hazard Bay (HB) and North-East Reef (NER). Montipora digitata is abundant on the reef flat at Pioneer Bay and Hazard Bay, but not North-East Reef. Plate species are only found in abundance at North-East Reef. At the third site, Low Isles, corals were sampled from Low Island (Figure 2.2b) where M. digitata is again abundant on the reef flat. Supplementary sampling was carried out at Esk Island (Palm Island group, Figure 2.2a). Sampling for allozyme electrophoresis was carried out at all three locations. Two sites, Geoffrey Bay and Nelly Bay, were sampled at Magnetic Island. Three sites, Pioneer Bay, Hazard Bay and the northern tip of Esk island, were sampled in the Palm Islands. And one site, Low Island, was sampled in the Low Isles. 2.2.2 Sampling and storage. Sampling was carried out between October 1991 and April 1993 with 50% of the samples being collected between March and July 1992. All samples from Low Isles were collected in February 1993. An initial sample of two small FF colonies and two YS colonies was collected in June 1991. These samples were used during the initial screening procedure to determine which enzyme systems would work, and were also retained throughout the study period for use as electrophoretic markers. A total of 263 samples were collected for this study (FF n = 130, YS n = 133). Seventy percent of the samples were collected specifically for electrophoresis (total n = 185; GB = 40, NB = 40, PB = 20, HB = 25, ESK = 20, LI = 40). For these samples equal numbers of each morph were selected from as wide an area as possible at each site. No one colony was sampled less than five meters from another unless of differing morphology. The remainder of the samples were obtained from colonies used for breeding experiments (n = 78). All colonies used in the breeding experiments were sampled for electrophoresis, these samples were integrated into the main genetic analysis, and the outcome of the analysis was used to confirm identification for the breeding experiments (see Chapter 3). Good representatives of each morph (FF n = 109, YS n = 100) as well as intermediate morphs (n = 54) were represented in the final sample.. 14.
(34) 146°I50'E. MAGNETIC ISLAND Geoffrey Bay -19°10 S. Nelly Bay. Plate 2.1. Map of study sites at Magnetic Island and aerial photograph of main study site at Geoffrey Bay. Bpxed area indicates zone in which labelled colonies for gametogenic study were located..
(35) (a). (b). Figure 2.2. Maps of study sites in the Palm Islands (a), and at Low Isles (b)..
(36) Chapter 2: Genetics. Several branch tips were removed from each coral sampled using a pair of bone cutters. They were then placed in labelled 5 ml opaque plastic screw cap tubes (clear tubes shatter easily when frozen) and snap frozen in liquid nitrogen, or occasionally on dry ice. Branch tips were preferentially chosen as they rarely contained boring organisms, enzyme activity was good, and they were easier to crush in preparation for the loading of gels. All samples were stored in a -80°C freezer pending analysis. No sample, with the exception of markers, was stored for more than six months prior to analysis. 2.2.3 Screening for enzyme systems. Initial screening was carried out in order to determine which enzyme systems would be suitable to investigate the genetic structure of M. digitata morphs. The protocol used to develop such systems was based on the strategy outlined in Richardson et al. (1986). For initial screening both cellulose acetate (Cellogel®, Chemetron, Italy) and 12% starch gels were used. Laboratory equipment and methodology used to run cellulose acetate gels is given in Richardson et al. (1986), and that for starch gels is given in McDonald (1985) and Shacklee and Keenan (1986). Buffer solutions used to make the starch gels are detailed in the appendix. Three main buffers were used for screening of enzymes using cellulose acetate gels (TM, PHOS and CP). The main buffers used for screening enzymes on starch gels were TC8, TEC and TEB. All buffer and stain recipes are given in the appendix. During screening, Cellogel was cut into small strips about 4-5 cm wide before loading the same samples onto each strip. For starch gels the samples were repeated across the gel and then it was cut into strips after samples had been run. Using small pieces of each gel was an efficient and cost-effective way of assaying many different stains. Once a potentially useful system was detected and further improvement was required, alternative buffers were tested. For a list of buffers tested see tables 2.1 and 2.2. When improving systems, a larger number of samples was added to the gels in order to establish the degree of variation in the system, and to check that the same enzyme was not being observed in several stains. In cases where activity was clearly present, but none of the buffers provided adequate resolution, several other variables were manipulated. For example, in some cases where separation was insufficient, the concentration of buffer was reduced to increase the running distance of the proteins and hopefully increase separation. Alternatively running time was varied, pH altered, or samples centrifuged to obtain a "cleaner" supernatant.. 17.
(37) Chapter 2: Genetics. 2.2.4 Sample preparation. Pieces of coral 3-5 nun long were broken from the sample and placed in a labelled ceramic depression plate along with 1-2 drops of an 0.04% aqueous solution of b-mercaptoethanol. On thawing, the samples were ground using a stainless steel grinding rod. Up to three more drops of b-mecaptoethanol were added to samples during grinding if the samples were very dry. Ceramic plates were kept on ice both prior to, and after the grinding of samples. For loading Cellogel samples a small well was made in the crushed sample and fluid allowed to collect in it, a draftsman's pen was used to collect the sample and load it onto the Cellogel. For starch gels a square of tissue was placed on the ground samples (approximately 6 mm square piece of Kimwipes® followed by wicks made from chromatography paper; Whatman No. 3, 1.5*4mm) which were allowed to soak up the sample through the tissue. The tissue, acting as a crude filter, greatly reduced the amount of mucus on the wicks. This has been shown to reduce problems with smearing and warping (Benzie, 1990). Prior to loading starch gels wicks were blotted on a tissue and then inserted in order into a cut parallel to, and approximately one-sixth way from the gel base. A wick soaked in bromophenol blue was placed at the end of each gel in order to monitor the speed at which the samples moved through the gels. Marker samples were placed at intervals along all gels to allow cross correlation of enzyme bands between different gels. All polymorphic systems were screened using starch gel electrophoresis as none resolved well on Cellogel. Samples were run horizontally, either along the length of the gel (n = 18), or across the width of the gel (n = 28). Running time for gels was initially 5 hours at 200-400 volts depending on the buffer, but it was found more practical to run gels overnight (running 28 samples across the gel) for 17-18 hrs at 70120 volts. The longer running time did not reduce resolution or activity. Following electrophoresis, gels were sliced into 2-3 layers allowing as many enzyme systems to be assayed. The sections were laid out flat on a perspex board and stained using 10 ml of stain solution and 10 ml agar. The agar was kept liquid in a 60°C oven and added to the stain solution immediately prior to pouring over the gel surface. This is essential as once certain stains are mixed with the agar it sets very rapidly. Gels were scored as soon as they could be resolved, they were never left until they had overstained. Once all gels had been scored, a second score was made to reconfirm the first. This was particularly useful for checking any stains that were not clearly resolved during the first scoring. Normally all stains used could be scored within three hours of staining. 18.
(38) Chapter 2: Genetics. Out of a total of thirty-nine enzyme systems surveyed, a total of six were chosen for this study for reasons detailed in the results section. The final systems screened were peptidase EC 3.4.11* using leucyl tyrosine (LT) and leu-gly-gly (LGG) substrates and a LiOH buffer, phosphoglucomutase EC 2.7.5.1 (PGM) and malate dehydrogenase EC 1.1.1.37 (MDH) using a TEC 7.9 buffer (modified from recipe 2 of Soltis et al. 1983 by addition of EDTA), and malic enzyme EC 1.1.1.40 (ME) and Hexokinase EC 2.7.1.1 (HK) using a TC8 buffer. Superoxidase dismutase EC 1.15.1.1 (SOD) also appeared on HK stained gels and was scored. All stain recipes are given in the appendix. Enzyme nomenclature follows the format suggested by Shaklee et al. (1990), and details of all enzymes used during this study are given in Table 1 in the appendix. The actual distance travelled by proteins was scored for all gels. The marker samples were used to account for warping effects across the gels. To standardise all results the most common allele at each locus was used as , the standard "100" allele (always identified relative to the marker). Migration of this allele was measured from the base of the gel, and all other alleles were then scored relative to the "100" allele by measuring their migration differences in millimeters. Scored distances were subsequently related to the standard allele as follows: common allele = x/x * 100 = 100 other alleles = y/x * 100 = n where x is the distance travelled by the common allele, y the distance travelled by the allele being related to the common allele, and n a standardised value. This procedure is necessary to account for the differences in mobility of protein bands between runs. 2.2.5 Statistical analyses Individual colonies were first separated into genetic groups using principal coordinates analysis in the PATN pattern analysis package and applying the Gower metric algorithm (Belbin 1987), for which each allele was coded as a separate character, deleting those for which there was no variation in the total data set. Gene frequencies, basic statistics of genetic variability, tests for conformance to HardyWeinberg expectations, and clustering procedures were performed using the BIOSYS package (Swofford and Selander 1981). Tests for conformance of gene frequencies to those expected under conditions of Hardy-Weinberg equilibrium used the exact probabilities (Elston and Forthofer 1977) and significance values were adjusted for multiple simultaneous tests (Miller 1966). Weir and Cockerham's (1984) F-statistic was used to determine Fis (within-population variation) and FsT (differentiation among populations), and the statistical significance of Fis and FST was calculated using equations given in Waples (1987). 19.
(39) Chapter 2: Genetics Genotypic diversity expected for sexually reproducing populations (GE) was calculated with compensation for small sample size following Stoddart (1983). This is the expected genotypic diversity under Hardy-Weinberg equilibrium and linkage equilibrium. Observed genotypic diversity (G o) was calculated using the formula Go = 1/Epi2 (Stoddart and Taylor 1988). The overall effect of asexual reproduction was assessed as the ratio of Go to GE. A sexually reproducing population should display a Go :GE ratio of approximately one, whereas a genetically variable population with high levels of asexual recruitment should display a lower value (Ayre 1984).. 2.3 Results 2.3.1 Enzymes surveyed Many of the enzymes exhibited good activity and resolution on Cellogel (summarised in Table 2.1), but the results were never as good as for starch gels. In an attempt to improve the resolution and separation of EST, ENOL and ACON on Cellogel, centrifuged samples were tested as well as samples run on half concentration buffer. Centrifuging did improve resolution, but reducing the buffer concentration made it worse. It was therefore decided to run all systems on starch. The activity and resolution of all enzymes tested on starch gels is given in Table 2.2, along with an indication of whether the enzyme was variable or not, the buffers tested, and the buffer that gave the best results. Details of systems not used in the final study, but which could be made to work for future studies relatively easily are given in the appendix (Table 2). 2.3.2 Details of systems used in this study Enzyme systems LT , LGG and ME formed one-banded and three-banded phenotypes corresponding to dimeric homozygotes and heterozygotes, respectively, whereas PGM formed one-banded and two-banded phenotypes corresponding to monomeric homozygotes and heterozygotes, respectively (figures 2.3-2.6). SOD was also scored on gels stained for HK but was invariant; appearing only as one-banded homozygotes. Unfortunately HK could not be included in the final analysis as scoring was not consistent throughout the study due to problems with warping and inconsistencies in staining from day to day. LT showed two strongly staining loci, one of which was invariant (Figure 2.3 and Plate 2.2). In FF samples there appeared to be two alleles in the region of LT-2,. 20.
(40) Chapter 2: Genetics. ENZYME AAT(UV) AAT(Fast violet) ACON ADH AK CK DIAPH ENOL EST GDH G-6PD GPI HK IDH LDH MDH ME MPI NP Pep(LG) Pep(LP) Pep(LT) PGK PGM PK SOD SDH TPI. BEST BUFFER. ACTIVITY. RESOLUTION. VARIABLE?. +++ +++. ** **. Y. +++ ++ ++ +++ +++ ++. **. Y Y Y Y Y N. +++ +++ ++. ** ** **. Y. PHOS. Y. TM. +++ +++. *** **. Y Y. +++ +++ +++ +++ +++. * * ** **. *. N CP. TM, PHOS TM. Y. ** **. * ** **. Y Y. CP. Y Y. N. Table 2.1. Primary survey of all enzyme systems tested on cellogel using the buffers CP, PHOS and TM. Activity, (+): none; (-H-): some; (+-H-): good. Resolution, (*): inadequate; (**): has potential; (***): good. Variability, (Y):. yes; (N): none observed.. 21.
(41) Chapter 2: Genetics. Enzyme. Activity. Resolution. Variable?. Buffer TEB, 'TEC. TC6, TC8, LIOH. AAT(UV). TEB, TEC, TC7, POUL. ACON ACP. +. •. ADH. +. •. N. TC7, TEC, TEB. •. N. TEC, TEB, TC7. AK. +. TC6. TC8, TEL TEC. TEC. ALD ALP. +. •. CK. ++. •. TEB POUL, TEC,TEB. N. DIAPH. ++. •. ENOL. ++. •. Y. EST. ++. •. Y. EST (fluorescent). ++. •. Y. FBP. N. (TC8), TC6, LIOH, TEC, TC7, POUL (TC6), TC8, LIOH, TC7, POUL, TEC, TEB (TEB, TEC), TC6, TC8 (LIOH), 'TEC TC8. +. FUM. TC8, 'TEC. GA3PD. TEB. GDA. TEB. GDH. TC6, TEB, TEC, TC8, TC7, POOL. GLDH. TEB, TEC, TC8. •. +. TEB. G3PD G-6PD. +. GPI. ++. OFT. _. TEB, TEC, TC8. • Y. (TC8), LIOH, TC6, TC7 TC8. ++. *a. Y. HK. ++. •. Y. IDH. ++. •. Y. (LIOH), TC8, TC6, TC7, POOL, TEC,TEB TEB, TEC, TC7. LDH. +. •. N. TC7, TEC, TEB. MDH. ++. ••. Y. (TC8), TEB, TEC, TC7. ++. ••. Y. MPI. (TC8), TC6, LIOH, TEC, POUL, TC7 TC6, TC7, TC8. NP. TC6, TC8. GSR. TC8. HBOH. ME. TEB, TC8, TEB, LIOH. ++. ••. Y. (LIOH), TC8, TC6, TEC, TEB. Pep(LP). ++. •. Y. (LIOH). TC6, TC7, TC8, TEB, TEC. Peo(LT). ++. ••. Y. (LIOH), TC6, TC8, TEB, TEC. Pep(LG). TEB, TEC. PGK ++. •• •. Y. (TEC), TC8, TC6. SOD(ON HK). ++. ••. N. (TC8). TR. +. PGM. •. TC8, LIOH. Table 2.2. Primary survey of all enzyme systems tested on starch gels. Activity, (+): none; (++): some; (+++): good . Resolution, (*): inadequate; (**): has potential; (***): good. Variability, (Y): yes; (N): none observed . brackets indicate best buffer. 22.
(42) Chapter 2: Genetics. however they were extremely close together (1 mm apart) and were therefore scored as LT-2 *100. There was additional variation for YS samples in the LT-2 region, but although separation was often good, resolution was too poor to allow reliable scoring, so all alleles in this 1-2 cm wide region on the gel were therefore scored as LT-2 *55. The variation at LT-2 *55 never overlapped with that at LT-2 *100. LGG also showed two strongly staining loci, again one being invariant. Though resolution was not always good on LGG-2 there was little warping and scoring was considered reliable enough to avoid grouping alleles as for LT. Such scoring was not possible on other buffers tested as they produced considerable warp. Six allelic variants occurred at LGG-2 in the combinations shown in Figure 2.4. PGM stained very strongly and fast so gels had to be scored promptly. There were three allelic variants on one locus (Figure 2.5, Plate 2.3). Occasionally a second locus which was not scored would appear much higher up the gel (Figure 2.5). Scoring of PGM gels was unequivocal and consequently re-runs were rarely necessary. Both MDH and ME developed slowly and bands were often faint with poor separation of variable alleles. In both of these systems, however, the resolution was good, making scoring reliable. MDH would occasionally develop on ME stained gels above the ME locus, confirming that the two systems were not being confounded. Two allelic variants were detected on MDH-1, and three allelic variants on ME (Figure 2.6). 2.3.3 Survey results. Principal coordinates analysis of all unique genotypes detected in the populations demonstrated two distinct groupings (Figure 2.7). All colonies having an unequivocal FF morphology clustered together to the right of the PCA plot. All colonies having an unequivocal YS morphology clustered together on the left of the PCA plot. Morphologically intermediate specimens clustered at random into one of these two groups rather than forming a separate cluster, or occupying an intermediate position between the genetic groupings of FF and YS individuals. Clustering did not correlate with geographic location. There were some genotypes that separated from the main groupings of both morphs along the second PCA axis (Figure 2.7). These genotypes did not represent intermediate or identifiable morphologies and consisted of 5 unequivocal FF and 14 unequivocal YS morphotypes. Eighty-nine percent of the variation in the data series was accounted for by the first PCA axis. Only 10% was associated with the scatter along PCA axis 2, and 0.6% with PCA axis 3.. 23.
(43) Chapter 2: Genetics. FF. Mean Distanc travelled (cm). 6-. YS mom. 5 -. —. Elm. LT-1. 43LT-2*100. 21. LT-2*55. -. 0. 5-7. 2-2 3-3 3-4 4-4 4-6. 1-1. Figure 2.3. Enzyme variants observed for LT (LiOH buffer), showing the variants found for the FF and YS morphs of Montipora digitata, and the combinations of enzyme variants fused for these morphs as LT2*100 and LT 2 *55 respectively. -. Mean Distanc travelled (cm). 65 -. 11■1. •.T.A. LGG-1. 110. 4-. 102 100 95. 3-. 93. LGG-2. 82. 2-. 10. 1-1 1-3 3-3 3-6 1-4 2-2 2-5. Figure 2.4. Enzyme variants observed for LGG (LiOH buffer). Numbers on diagram are standardised allele numbers.. 24.
(44) Plate 2.2. Starch gel zymogram stained for LT (LiOH buffer), showing the variants found for the fat fingers (FF) and yellow spatulate (YS) morphs of Montipora digitata (see Figure 2.3). The variants at LT-2 *100 and LT-2 *55 were fixed for FF and YS morphs respectively. Note variability at LT-2 *55 that could not be scored due to poor resolution.. Plate 2.3. Starch gel zymogram stained for PGM (TEC 7.9 buffer), showing the variants found for the fat fingers (FF) and yellow spatulate (YS) morphs of Montipora digitata (see Figure 2.5). The unscored locus had not stained on this zymogram..
(45) Chapter 2: Genetics. 6-. 1•=1 Unscored locus. 125 MMIll MIMI MIN =MI 100 - 75. 0. 1-1 1-2. 2-2 2-3. 3-3. Enzyme variants observed for PGM (TEC 7.9 buffer). Numbers on diagram are standardised allele numbers.. Figure 2.5.. Mean Distanc travelled (cm). 6 5 -. ME. MDH 1001■I. 94. MDH-1. 43-. MDH-2. 107. 100=== 93. 2. 0. 1-1 1-2 2-2 2-3 3-3. Figure 2.6. Enzyme variants observed for MDH and ME (TC8 buffer).. Numbers on diagram are standardised allele numbers.. 26.
(46) ▪. Chapter 2: Genetics. +X —. 0. Principal coordinate axis 2. 0 0. •. 0. •• •. 0. ee. • • • II • ••. cb. •••. 0. •. 0. aso%. 0 00 0. •. Y. 0. -Y. +X. 0. .+X. O. •. •. •II •• • ••. 0. 0. o o o 0 02,. CD00. C10. • •• • • • •. 0. 0. •. O. • -Y -Y. 0. +X. Principal coordinate axis 1. Figure. 2.7. Principal coordinates plot of all unique 5-locus genotypes observed in the Montipora digitata populations sampled (n = 263). The first axis accounts for 89% of the variation, the second and third account for 10% and 0.6% respectively. • = YS, 0 = FF.. 27.
(47) Chapter 2: Genetics. The two groups separated on the PCA plot were distinguished by a fixed gene difference at LT-2 * where all FF individuals had allele *1 00, and all YS individuals had allele *55 (Table 2.3). There were also several major shifts in gene frequencies between YS and FF individuals. At LGG-2 *, allele *93 was the most common in YS morphs whereas allele *100 was most common in FF morphs (Table 2.3). LGG2 *111 was present in five of the six FF populations but absent in all YS populations. For PGM, YS individuals had almost equal numbers of *100 and *75 alleles whereas FF individuals had almost exclusively *100 alleles. Similarly, at ME, YS individuals predominantly had *100 and *107 alleles, whereas FF individuals had *100 and *93 alleles. The rare MDH-1*94 allele occurred only in two FF populations. All populations showed genetic variation, with 22.2 to 44.4% of the five loci polymorphic, and an average of 1.2 to 2.1 alleles per locus,(Table 2.4). Direct count heterozygosities ranged from 0.028 to 0.214 and the mean was 0.053 for FF populations and 0.142 for YS populations. Most of the observed heterozygotes had values lower than those expected under conditions of Hardy-Weinberg equilibrium, however all standard errors overlapped between observed and expected heterozygotes. More detailed tests of conformance of observed gene frequencies to those expected under conditions of Hardy-Weinberg equilibrium using the exact test showed five significant deviations (Table 2.5). Heterozygote deficits for ME* were observed in two populations of FF (GB heterozygotes Observed = 4, Expected = 14.6; homozygotes 0 = 44, E = 33.4, and HB heterozygotes 0 = 0, E = 5.3; homozygotes O = 12, E = 6.7), and two YS populations (GB heterozygotes 0 = 7, E = 17.4; homozygotes 0 = 55, E = 44.6, and LI heterozygotes 0 = 1, E = 9.3; homozygotes 0 = 22, E = 13.7). Heterozygote deficits for LGG* were observed in one FF population (HB heterozygotes 0 = 3, E = 6.2; homozygotes 0 = 9, E = 5.8). Genotypic diversity (G o) varied considerably between populations ranging from 2 to 7.8 in FF populations and from 4 to 9.9 in YS populations (Table 2.4). For FF populations the ratio of observed to expected genotypic diversity (G o: GE) varied between 0.61 and 1.16 with an average of 0.79, and for YS populations G o:GE ranged from 0.55 to 1.41 and averaged 0.86. Only two YS populations (NB and ESK) and one FF population (LI) had a G o :GE ratio greater than one. Populations of both morphs had low Go:GE ratios at GB, NB and HB (the NB yellow spatulate estimate is high but not considered valid due to the very small sample size it is based on), and values approaching one at PB. At Esk and Low Isles the ratios were quite different for the two morphs.. 28.
(48) Chapter 2: Genetics. Locus, allele. Yellow Spatulate. Fat Fingers Palm Islands. Magnetic Island GB. NB. PB. HB. Low. Magnetic. Isles. Island GB. ESK. Low. Palm Islands. Isles NB. PB. HB. ESK. LT-2* 100 55. 1.000 1.000 1.000 1.000 1.000 1.000 - 1.000 1.000 1.000 1.000 1.000 1.000. LGG-2*. 111. 0.417 0.148. -. 0.083 0.036 0.618. 102 100 95 93 82 PGM* 125 100 75 MDII-1* 100. 0.031 0.093 0.375 0.125 0.143. 94 ME* 107. 0.021 0.037. -. -. 0.315. 0.490 0.704 0.458 0.667 0.679 0.382 0.024 0.125 0.021. -. 0.065. -. -. 0.031 0.056 0.125 0.125. 0.010. 0.380 0.462 0.333 0.348. -. 0.042. -. 0.653 0.750 0.620 0.538 0.583 0.522. -. 0.008 0.125. 0.143. -. 0.104. -. 0.083 0.065. -. 0.083. 0.875 0.981 1.000 1.000 1.000 0.941 0.524 0.500 0.540 0.308 0.583 0.391 -. 0.021 0.019. 0.059 0.476 0.500 0.460 0.692 0.333 0.609. 0.979 0.963 1.000 1.000 1.000 1.000 1.000 1.000 1.000 1.000 1.000 1.000. -. 0.031. -. 0.169. 0.320 0.423 0.167 0.283. 100. 0.813 0.963 0.917 0.667 0.964 1.000 0.831 1.000 0.660 0.577 0.833 0.717. 93 (n). 0.156 0.037 0.083 0.333 0.036 48. 27. 12. 12. 14. -. 17. 62. 4. 0.200 25. 13. 6. 23. Table 2.3. Gene frequencies at five loci for fat fingers and yellow spatulate morphs of Montipora digitata at three sites on the Great Barrier Reef. Magnetic Island: Geoffrey Bay (GB), Nelly Bay (NB). Palm Islands: Pioneer Bay (PB), Hazard Bay (HB), Esk Island (ESK). One sample site only from Low Isles. -: gene frequency is zero; (n): Number of individuals screened.. 29.
(49) Yellow Spatulate. Fat Fingers Low Isles. Palm Islands. Magnetic Island. Low Isles. Palm Islands. Magnetic Island GB. NB. PB. HB. ESK. 1.2. 1.6. 1.3. 1.4. 1.3. 1.6. 1.6. (0.3). (0.1). (0.3). (0.2). (0.2). (0.2). (0.3). (0.3). 22.2. 22.2. 22.2. 33.3. 22.2. 33.3. 33.3. 33.3. 33.3. 0.037. 0.028. 0.048. 0.059. 0.133. 0.083. 0.147. 0.214. 0.167. 0.106. (0.045). (0.037). (0.028). (0.039). (0.046). (0.079). (0.059). (0.078). (0.115). (0.096). (0.069). 0.131. 0.074. 0.091. 0.112. 0.065. 0.067. 0.140. 0.115. 0.162. 0.163. 0.165. 0.168. (0.070). (0.052). (0.073). ∎3.074). (0.057). (0.054). (0.073). (0.077). (0.081). (0.082). (0.087). (0.086). Nc. 17. 6. 5. 4. 3. 4. 16. 4. 13. 6. 6. 11. GE. 10.43. 4.20. 4.49. 5.40. 3.30. 2.85. 11.04. 2.84. 10.68. 7.55. 4.87. 12.27. Go. 7.84. 3.02. 4.00. 3.27. 2.00. 3.32. 6.89. 4.00. 9.92. 4.83. 5.14. 6.70. Go Q E. 0.75. 0.72. 0.89. 0.61. 0.61. 1.16. 0.62. 1.41. 0.93. 0.64. 1.06. 0.55. GB. NB. PB. FIB. ESK. 2.1. 1.7. 1.4. 1.4. 1.4. (0.6). (0.3). (0.3). (0.3). Polymorphic loci (%) 44.4. 44.4. 22.2. 0.097. 0.049. (0.062). Mean No. of alleles per locus. •. Heterozygosity: Direct count. Expected. Table 2.4.. Mean genetic variability (±SE) for the six fat fingers and the six yellow spatulate populations of Montipora digitata. surveyed. A locus was considered polymorphic if more than one allele was detected. Expected heterozygosities are unbiased estimates following Nei (1978). Nc is the number of electrophoretically distinct 5-locus genotypes. Go and GE are observed and expected genotypic diversities respectively. G o :GE is the genotypic diversity ratio..
(50) Chapter 2: Genetics. Population. Locus LT. LGG-2. PGM. MDH-1. ME. 0.395. 1.000. 0.011. 0.000*. 2 FF NB. 0.165. 1.000. 0.019. 0.019. 3 FF PB. 0.005. 0.043. 4 FF HB. 0.001*. 0.001 *. 0.003. 1.000. 6 FF LI. 0.624. 1.000. 7 YS GB. 1.000. 0.201. 8 YS NB. 0.143. 1.000. 9 YS PB. 0.391. 0.688. 0.075. 10 YS HB. 0.006. 1.000. 1.000. 11 YS ESK. 0.152. 0.394. 1.000. 12 YS LI. 0.676. 0.208. 0.000*. 1 FF GB. 5 FF ESK. -. -. 0.000*. *<0.05; "<0.01 Table 2.5. Tests for conformance to Hardy-Weinberg equilibrium. Statistics (X 2 values) for all Montipora digitata populations calculated using exact probabilities. (Elston and Forthofer 1977) are shown. Significance values adjusted for multiple simultaneous tests (Miller 1966) are shown below the table.. 31.
(51) Chapter 2: Genetics. F-statistic analyses demonstrated highly significant differentiation between FF populations (mean FST = 0.045) but not between YS populations (mean F ST = 0.015) of M. digitata (Table 2.6). All polymorphic loci contributed to the significant mean FST value in FF populations. There was also a highly significant genetic inhomogeneity within the FF populations (mean FIS = 0.479). All polymorphic loci except PGM* contributed to this effect, and reflected the deviations from HardyWeinberg discussed above as well as the lower average genotypic diversity ratio (Go:GE). The mean F15 value was not significant for YS populations, although the value for ME* was significant (Table 2.6). Fat Fingers. Yellow Spatulate. Locus. FIS. FST. FIS. FST. LGG-2*. 0.229**. 0.123***. -0.095. 0.015. PGM*. -0.099. 0.047**. -0.005. 0.013. MDH-1*. 1.000***. 0.036*. ME*. 0.787***. 0.045**. 0.503***. Mean ± SE 0.479 ± 0.084 *** 0.063 ± 0.007** 0.135± 0.093. 0.160 0.063 ± 0.024. *<0.05; **<0.01; ***<0.001. Table 2.6. Summary F-statistic estimates of: within population variations (Fig), and between population variations (F ST) for both morphs of Montipora digitata. LT* is not. included as it was monomorphic for a different allele in each taxa. Genetic distances between populations of the same morph were an order of magnitude less than those between morphs (Table 2.7). Nei's unbiased genetic distance among FF populations averaged 0.014, and among YS populations averaged 0.007, while the average genetic distance between FF and YS populations was 0.237. There was no overlap between standard errors calculated for among population and between population genetic distances (e.g. Standard error for highest among population of 0.035 was 0.042, while that for the lowest between population genetic distance of 0.180 was 0.099: calculations of standard errors were made using formulae in Nei, 1987). Cluster analysis (Figure 2.8) clearly showed the separation between YS and FF populations, and greater separation among FF populations than among YS populations. 32.
(52) Population 1. FF GB. 2. FF NB. 3. FF PB. 4. FF HB. 1. 2. 3. 4. 5. 6,. 7 8. YS NB. 6. 9 10 11 12. L222 L240 YS PB ► 285 YS HB YS ESK 1.210 0.246 YS LI. Table 2.7.. 8. 9. 10. 11. 12. 0.009 0.019 0.008. 0.012 0.008 0.010 FF ESK 0.015 0.001 0.005 0.009 0.006 0.019 0.031 0.035 0.026 FF LI ).232 0.232 0.203 0.235 0.233 0.237 YS GB. 5. 7. 0.218 0.205 0.245 0.210 0.294 0.256 0.211 0.180 0.250 0.221. 0.230 0.220 0.222 0.003 0.239 0.245 0.250 0.001 0.016 0.288 0.294 0.297 0.013 0.035 0.004 0.215 0.210 0.216 0.000 0.000 0.000 0.013 0.251 0.249 0.255 0.003 0.013 0.000 0.000 0.000. -. Nei's unbiased genetic distance (Nei 1978) between each pair of Montipora digitata. populations. Shaded area indicates genetic distances between morphs..
Figure
+7
Related documents
Overall, the results of the research project appear to fit well with stress and coping theory and highlight the importance of considering personality-related variables (e.g.,
Upon completion of the field work it was intended that a combination of software would be used to firstly process each of the sites, and then secondly to analyse the body of data and
Perhaps because poetry is so rarely read and because it is written under such tight pressures I really want it to be something more, something that I feel really glad to have
Specific RNAi of hCycT1 and CDK9 expression in Magi cells was demonstrated by immunoblot analysis (Fig. 3A, lanes 3 and 4), and the inhibition of Tat transactivation correlated
In this puff-piece, Jennifer Hewett finds Turnbull has “a restless passion for participating in public life” (20); that beneath “the aggressive
In this study we have compared the distribution of E4, L1, and markers of viral oncogene activity (MCM, PCNA, and cyclin A) in productive papillomavirus infections (caused by HPV1,
The improvement in the level of consciousness as measured by CRSR, WHIM Total, WHIM Maximum, GOSE and RLA scores of patients in the intervention group was not
(ii) We have identified SV40 smt as a bona fide cochaperone and provided the first demonstration that a native mammalian DNA tumor virus protein can functionally replace a
