Complete citation:
Eley, Robert and Hegney, Desley and Buikstra, Elizabeth
and Fallon, Tony and Plank, Ashley and Parker, Victoria (2007). Aged care
nursing in Queensland – the nurses’ view.
Journal of Clinical Nursing
. ISSN
0962-1067.
This is the final manuscript of the paper at:
http://www.blackwellpublishing.com/journal.asp?ref=0962-1067&site=1
Aged care nursing in Queensland – the nurses’ view
Queensland aged care nurses workforce
Robert Eley BSc (Hons), MSc, PhD, MIBiol, CBiol, Senior Research Fellow, Centre for Rural and Remote Area Health, University of Southern Queensland, Toowoomba. eleyr@usq.edu.au, tel. +61 7 4631 5477, fax +61 7 4631 5452
*Desley Hegney RN, BA (Hons), DNE, PhD, FRCNA, FCN (NSW), Director, Centre for Rural and Remote Area Health, Faculty of Sciences, University of Southern
Queensland, Toowoomba and University of Queensland, Brisbane. hegney@uq.edu.au tel. +61 7 4631 5456, fax +61 7 4631 5452
Elizabeth Buikstra BSc (Hons) PhD,Research Fellow, Centre for Rural and Remote Area Health, University of Southern Queensland, Toowoomba,
buikstra@usq.edu.au, tel. +61 7 4631 5443, fax +61 7 4631 5452
Tony Fallon BSc (Hons) PhD,Research Fellow, Centre for Rural and Remote Area Health, University of Southern Queensland, Toowoomba
fallon@usq.edu.au, tel. +61 7 4631 5455, fax +61 7 4631 5452
Ashley Plank Dip.T, BSc, MSc (Hons), PhD, Statistics Coordinator SimStat, Department of Mathematics and Computing, Faculty of Sciences, University of Southern Queensland, Toowoomba.
plank@usq.edu.au, tel. +61 7 4631 5538, fax +61 7 4631 5452
Victoria Parker RN, BHSc, Grad. Dip. Critical Care, MN, MRCNA, Lecturer,
Department of Nursing, University of Southern Queensland, Toowoomba, Australia. parkerv@usq.edu.au tel +61 7 4631 2377, fax +61 7 4631 5452
Professor Desley Hegney
Centre for Rural and Remote Area Health University of Southern Queensland PO Darling Heights, Queensland 4350
Aged care nursing in Queensland – the nurses’ view
ABSTRACT
Aims and objectives: Through comparison of two studies undertaken three years apart the opinions of nurses working in aged care facilities in Queensland were determined. Results will support policy planning for the Queensland Nurses Union. Background: An ageing population in Australia is placing increased demands on residential aged care facilities. In Queensland the national situation is exacerbated by an influx of retirees from other states and territories. The ongoing problem of shortages of nurses in the workforce may be addressed by gaining further insight into the nurses’ own views of their conditions and experiences.
Methods: 1000 nurses working in public and privately owned residential aged care facilities were surveyed by postal questionnaire in 2004. Results were compared with data collected in an identical study in 2001.
Results: Respondents offered their opinions on working hours and conditions,
professional development and experiences in nursing. The predominately female aged care nursing workforce is aging. Reported work place violence has increased
substantially since 2001. Some improvements are reported in staff numbers, skill mix and workplace policies. Nurses expressed very serious concerns about pay, workload, stress, physical and emotional demands and staff morale.
Conclusion: Working conditions for nurses in the residential aged care sector in Queensland must be addressed in order to retain the current nurses and to encourage new nurses to replace those that retire.
Word count: 4122
Key words: Australia, nurses’ roles, elder care, workforce issues
INTRODUCTION
For the last five years Australia’s population has been increasing annually at 1.2% and in June 2004 stood at 20.1 million (Australian Bureau of Statistics 2005). Two States, Western Australia (1.7%) and Queensland (2.1%), are experiencing population increases at rates above the national average. Queensland’s population which was 3.37 million in 1996, and 4.0 million in January 2005, is expected to be between 4.7 and 5 million by 2021 and between 6 and 6.5 million by 2051 (Department of Primary Industries and Fisheries 2005).
Australia's population is also aging through a combined effect of sustained low levels of fertility and increasing life expectancy. The median age of the national population is rising by about 0.3 years per year (30.5 in 1984 to 36.4 in 2004) and nationally the number of persons aged 65 years and over now constitutes 13.0% of the population (Australian Bureau of Statistics 2005). From 1980 to 2000, the number of people in Queensland aged 85 years and over increased 179.8%, from 15,300 to 42,900, compared with a total population growth of 57.4% over the same period (Australian Bureau of Statistics 2005)
With the rise in age comes an increased demand for health services and assistance to older people in their daily living. These will be addressed in part by the services offered by residential aged care facilities and aged care community home care packages.
information about the current status and gaps in provision. In 2003 the Australian National Institute of Labour Studies (NILS) published a report entitled Who Cares for the Elders in which they compared workforce information from a variety of federal, state and independent sources (Healy & Richardson 2003). The study demonstrated that despite a large number of data sources reliable details of the aged care workforce are limited. A subsequent study by NILS provided national figures on workforce numbers, however no state/territory breakdown data were presented (Richardson & Martin 2004).
In 2001 the University of Southern Queensland (USQ) in conjunction with the Queensland Nurses’ Union (QNU) undertook a survey of nurses. The survey was repeated in 2004. The studies demonstrated that the working conditions and
experiences of nurses working in residential aged care facilities differed from those of nurses working in hospitals or community health (home care) (Hegney et al 2005). In this paper we look specifically within the aged care sector at the responses from the 2001 and 2004 studies of nurses. Nurses who work in non-government (for profit and not-for-profit – known in Australia as the private sector) facilities are compared with those who work in the government (known as the public sector) facilities.
AIMS
The combined studies aimed to identify the factors impacting upon nursing work in residential aged care facilities and to use the results to inform strategic planning of the Queensland Nurses Union.
METHODS
Sample and sampling design
inclusion were employment in residential aged care and paid membership of the QNU during the year of each respective study.
The survey instrument
The validated survey instrument used in 2001 is described in detail by Hegney, Plank & Parker (2003). In addition to background information about the respondents (age, education, ethnicity etc), sections in the questionnaire sought information on current employment (time in current job, sector of employment), working hours, working conditions (skill mix, workload, rostering practices and workplace violence), professional development (education and training) and experiences in nursing (perceptions of nursing, breaks from nursing).
In 2001 data were entered into SPSS manually. In 2004, instead of manual entry of the data, the questionnaire was formatted using the software program Verity Teleform Version 9 (Sunnyvale, California) as the platform for automated data entry. For the 2004 survey a few items from the 2001 questionnaire were reworded for clarity; two questions on nursing agency work were added and a question on work hours was divided into three. These modifications were pre-tested by independent experts. With only two exceptions questions (totalling 72 in 2001 and 77 in 2004) offered multiple choices requiring ticking or entering data into a box. There were two open questions.
Data analysis
Quantitative data from 2001 and 2004 were analysed for differences between the nurses employed in the public and private aged care facilities within year and within each sector between years. Descriptive and inferential statistical tools were used as appropriate to the scale of measurement involved. Cross tabulations with chi square tests for significance were used for dichotomous and categorical variables and the t-statistic for independent groups for continuous variables. A threshold level of 5% was used for significance.
Ethics
The study was approved by the Human Research and Ethics Committee of the University of Southern Queensland, Toowoomba, Australia.
RESULTS
Response rate
Of the 1000 participants to each survey 424 (42.4%) responded in 2001 and 405 (40.5%) responded in 2004.
Job classification
Nurses were classified as assistants in nursing (AIN), enrolled nurses (EN) and
registered nurses (RN levels 1-5). There were no differences in the distribution of job of the respondents across sectors for either year or within sector between years (Table 1). Insert Table 1 here
Age
2001 more private aged care sector nurses were 50 or over and fewer aged 40 - 49. (p = .027). The same, although non-significant, trend occurred in the public sector (Table 1).
Time in current nursing job
Almost 60% of respondents had been in their current nursing job for more than 5 years and over 20% more than 15 years. There were no differences between sectors within years or within sectors between years (Table 1).
Nurses’ status of employment
In both 2001 and 2004, nurses in public aged care facilities were more likely to be employed permanently full-time and less likely to be employed permanently part time compared to those private facilities. In both years publicly employed nurses were more likely than privately employed nurses to work all three shifts or be day shift workers (Table 1). There were no differences within sectors over the two surveys.
Complete work in the available work time
All nurses viewed their ability to complete work in the available time in the middle of the five point Likert scale; never (= 1), seldom (=2), sometimes (=3), mostly (=4) and always (= 5). There was a non significant trend (p = .051) for public sector nurses to be able to complete their work on time in 2004 than their colleagues in 2001. Moreover in 2004 nurses in public facilities were more able to complete their work on time than those in private facilities (Table 2).
Level of staffing to cover work needs
to always (= 5) (Table 2). There was some improvement since 2001 in both facilities although this was only significant in the private sector. Insert Table 2 here
Sufficiency of staff skill mix to meet patient needs
Opinions on staff skill mix did not differ between sectors within year, however opinions did differ across the years. In 2004, nurses from both public and private facilities stated that skill mix met patient needs better than it did in 2001 (Table 2).
Reasons for the inadequacy of staff skill mix
When asked for the reasons for skill inadequacy nurses proffered too many inexperienced staff, too few experienced staff and lack of funding as the principle reasons. Private sector nurses in 2004 also believed that too much use of casual staff and employer policy on skill mix were contributory factors.
Effectiveness of workload issues committees and process
Private sector nurses in 2001 had a greater belief in the effectiveness of processes to deal with workload issues than they did in 2004 (Table 2). A similar non significant trend occurred in the public sector. In both sectors and in both years the effectiveness of these committees and processes was at best considered to be sometimes effective.
Workplace violence
Nurses were asked if they had been subjected to workplace violence in the last three months. Violence was defined to include aggression, harassment and bullying. There was no difference between sectors within years (Table 3). Violence was reported by more public sector nurses in 2004 (68%) than in 2001 (49%, p = .037), with a similar but non-significant increasing trend in the private sector (56 versus 49%, p = .072).
As indicated in Table 3, clients/patients were the highest source of abuse with more than two thirds of nurses who reported abuse indicating this as a source. The incidence had not changed between or within sector across the years.
Other sources of violence had changed. In 2004 public sector nurses reported more abuse by other nurses and other staff than they did in 2001. Similarly private sector nurses more abuse by other nurses, visitors/relatives, nurse managers and other staff in 2004 than they did in 2001. InsertTable 3 here
Workplace policies to deal with aggressive behaviour and abuse
In 2004 87% of all nurses stated that their workplace had policies to deal with violence from other staff. The figures on existence of policies had increased by about 5% in both sectors since 2001. There was no difference between nurses employed in the two different sectors (p = .957 for 2001 and p = .559 for 2004). .
In both years 10-15% of nurses did not know whether policies existed or not. Slightly over 50% of nurses noted that policies were mostlyor always/nearly always adequate on a five point Likert scale of never, seldom, sometimes, mostly and always/nearly always.
Access to training
In 2001 84.3% of publicly employed nurses and 89.9% of privately employed nurses reported that they had access to training/professional development through their workplace. The figures for 2004 were 83.9% and 88.0%. No significant differences were detected across years or between the public and private sectors (p > .170 for all comparisons).
Barriers that prevent nurses from undertake training/education
Despite training/professional development opportunities being offered nurses indicated that there were barriers to their participation. As shown in Table 4 lack of time and the fees involved were the reasons given by the highest proportion of respondents. Distance to training, availability of relief staff and leave issues (cost or permission) were also prominent. In 2004, smaller proportions of nurse reported barriers than in 2001 and this reduction was significant for private sector nurses for most of the barriers to training. Insert Table 4 here
Current and expected years in nursing
Over 60% of respondents had been nursing for at least 15 years. There were no significant differences between sectors within years or within sectors across years. About 15% of nurses were unsure how long they would remain in nursing. Of those that were sure 44% in 2001 and 40% in 2004 expected to be in nursing for a further 10 or more years. No differences were detected between or across years (Table 5). Insert Table 5 here
Experiences in nursing
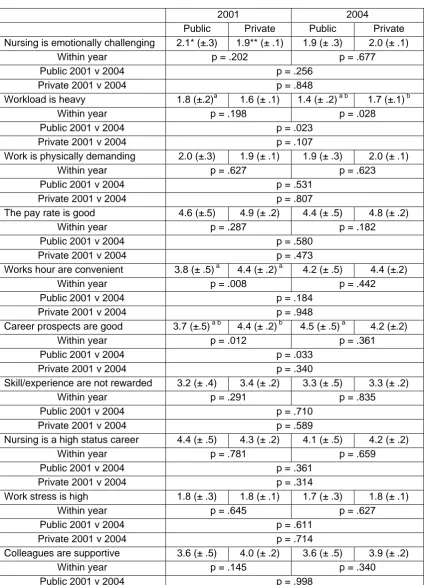
Results are given in Table 6. Overall nurses believed that nursing was emotionally challenging, physically demanding and highly stressful with a heavy workload and marginal rewards of status, pay and career prospects. Although nursing was seen to be valued by the health system and particularly the community, staff morale was
considered to be deteriorating.
Comparing sectors three items were significant; in 2001 publicly employed nurses believed their work hours were more convenient and their career prospect better than those employed in the private sector. In 2004 public sector nurses believed work load was heavier than did nurses in the private sector.
Two within sectors significant differences were found for publicly employed nurses. In 2004 nurses in public facilities perceived workload as being even heavier than they did in 2001. In 2004 public sector nurses indicated that their career prospects had
deteriorated since 2001 and were the same as the private sector nurses. There were no difference between 2001 and 2004 for any of the experiences for private sector nurses. Insert Table 6 here
DISCUSSION
Limitations to study
The percentage of respondents from the public sector (16.5% and 14% for 2001 and 2004, respectively) is slightly higher than might have been expected as the number of public aged care facilities is only 8% of all aged care facilities in Queensland
The proportion of assistants in nursing working in aged care who are members of the QNU in 2006 is 52% which is 10% less than the 2004 national nursing workforce average (Richardson and Martin 2004). The assistants in nursing who responded to this study in 2001 were 40% and in 2004 44%. Consequently, although the study is quite representative of the QNU membership this cadre of nurse are under-represented when compared to the total age care workforce.
The number of aged care nurses working part time (nationally about 66%, this study 77%) and full time (nationally 11%, this study 16%) are slightly higher than National Institute of Labour Studies figures (Richardson & Martin 2004). In that study casual and contract staff accounted for 19% of the aged care nursing workforce as compared to figures less than 10% in this study. The results therefore suggest that contract and casual staff particularly in the private sector may either be under-represented in the members’ database or chose not to respond to the survey.
Despite these small limitations, when age and other demographic details of
respondents are compared with the QNU member database the results from the two study are deemed to be largely representative of the QNU workforce. Furthermore as approximately 70% of nurses working Queensland are members of the Union the results paint a good picture a large proportion of the entire nursing workforce and thus will be of value to policy makers and nurse managers state-wide.
Response rate
Age
The aged care nursing workforce is ageing. In 2001 the Australian Bureau of Statistics estimated that 57% of aged care nurses were above 45 years of age (Richardson & Martin 2004) as compared to the 48% in our 2001 data set who were older than 50 years. By 2004 the proportion over 50 had risen to 58%. On average Queensland nurses in residential aged care are six years older than those employed in hospital or community health sectors (Hegney et al 2005). These data are consistent with those published by AIHW (Australian Institute of Health and Welfare 2005).
Employment
Aged care workers are far more likely to work on a part time basis than the nurses from other sectors (Hegney et al. 2005). Within the aged care sector in Queensland nurses in the public facilities are twice as likely to be employed full time and on continuous or day shifts as nurses in the private sector. The part time employment on other shifts in the private sector demonstrates a greater degree of flexibility perhaps as a balance against lower remuneration in this sector.
Working conditions
Both public and private residential aged care nurses consider their jobs to be poorly rewarded, with a heavy workload, physically demanding, emotionally challenging and stressful. Furthermore they report that they cannot complete their job to their
Additional comments were given by 134 aged care nurses in 2004. The highest number of comments (63, 47%) related to workload and the second highest number (30, 22%) mentioned that there was far too much paperwork involved in their daily activities.
This work situation is attributed by the nurses to employer policy on staffing with employment of too few experienced staff and too many casuals. These results support those of Richardson and Martin who reported that 75% of nurses and 65% of carers considered that they were unable to spend enough time with each resident (Richardson & Martin 2004). This situation may create a fall in job satisfaction which in turn can affect morale and retention of nurses in the profession.
It is encouraging to note that nurses in both public and private aged care facilities reported greater satisfaction with staff numbers and skill mix than they did in 2001. However there was deterioration in the proportion of private facility nurses who considered that workload issues were dealt with efficiently and this should be addressed.
In many of the parameters noted above nurses in the aged care sector reported more unfavourable conditions than did those in the hospital or community care sectors (Hegney et al. 2005). These other sectors may thus be seen to be preferential places of employment to some nurses. These results emphasise the importance in addressing the current situation if the future aged care work force is going to meet demands placed upon it.
Violence
violence from visitors/relatives, doctors or nursing management (Hegney et al, 2005). In that study within the hospital and community health sectors privately employed nurses reported the lowest incidence in violence. Within the aged care sector the same albeit non-significant trend was found between public and private facilities with nurses in private facilities reporting less violence.
Of interest is that the public aged care sector nurses demonstrated a far greater increase in reporting violence since 2001 than did those in the private sector. It is possible that this is a reflection of the awareness campaigns such as ‘zero tolerance to violence’, promoted by Queensland Health. The source of abuse increased from other nurses and other staff in both public and private facilities from 2001 to 2004 and also by visitors and relatives upon private facility nurses.
In addition to the possibility of actual increase in violence these reported increases perpetrated by fellow employees may be a result of greater knowledge of workplace policies or of the wider definition of violence that includes bullying, verbal abuse and sexual harassment. Regardless of the reasons for the reported increase, this aspect of the work environment must be addressed. It is encouraging that in both public and private aged care facilities nurses were more likely to report the existence of policies to address violence in 2004 as compared to 2001. Concern must be expressed however for the considerable number of nurses (ranging from 8 to 19%) who continue to be unaware of whether such policies existed or not.
Training and education
information technology from a nationwide study of Australian nurses (Hegney et al 2006).
Nurses reported fewer barriers in 2004 than they did in 2001. In 2004 the Department of Health and Ageing announced that up to 15,750 personal care workers would eligible for government support to upgrade their vocational education and training (Department of Health and Ageing 2004). This included training towards Certificate Level III or IV in aged care work up to an enrolled nurse qualification. It is possible that this training initiative influenced the response.
Time in nursing
The figures for length of time in nursing and in their current job indicated that the
retention of nurses in aged care facilities is relatively high. These data support those for other sectors of nursing that indicated although mobile within the profession and
despite breaks usually for family reasons, nurses are retained in the profession (Hegney et al. 2005). Additional evidence comes from a national study commissioned by the Department of Health and Ageing that surveyed nurses who allowed their registration to elapse in 1999/2000. The major reason for departure was family commitments and over 50% of the nurses who had worked in aged care stated they would return with a preference for part-time work (Australian Centre for Evidence Based Residential Aged Care 2002).
have longer breaks; both factors affected by the older age cohort than in other sectors. Furthermore in the past there was no retraining/re-entry into the hospital sector and therefore if a nurse had a long break they usually could only get work in the aged care sector. This situation has now changed with the government training opportunities noted above and with some states offering retraining incentives as a major strategy to encourage nurses to return to work in all sectors.
Experiences in nursing
The responses of the aged care nurses to statements related to work experiences suggest that there are some very serious issues to be addressed. For example publicly employed aged care nurses in 2004 considered workload to be heavier than they did in 2001 and that their career prospects were lower. As the workforce ages and
subsequently retires replacements are essential and working conditions must be conducive to recruitment.
In this study aged care nurses have expressed very serious concerns about pay, workload, stress, physical and emotional demands and staff morale; none of which will aid recruitment. Furthermore these factors can affect retention. In a survey of
registered and enrolled nurses who had left nursing in 2000, work hours, pay and staff shortages were the major work related reasons for leaving the profession (Australian Centre for Evidence Based Residential Aged Care 2002)
It is interesting to note that despite criticism by nurses of many aspects of their working conditions the Australian nurses in Richardson and Martin (2004) study stated that they were quite satisfied with their job. A specific question on job satisfaction was not asked in the survey of Queensland nurses. Working opportunities are far greater now than they were when the predominantly female and soon to be retiring nurses joined the profession. It is suggested that job satisfaction of future generations of nurses may not outweigh negative aspects and will be reflected in recruitment and retention figures.
CONCLUSION
Our results for nurses employed in aged care facilities in Queensland demonstrate that replacement staff for the aging work force is a major priority. Nurses in both public and private residential aged care sectors are far from satisfied with their employment conditions mainly due to staff numbers, skills and experience. Overall staff morale is declining and there are major complaints regarding pay and inability to spend enough time with residents/clients. Although some small improvement in working conditions have been seen since 2001 much more is needed to avert major staff shortages of nurse working in aged care in Queensland.
ACKNOWLEDGEMENTS.
The project team would like to recognise the nurses who completed the survey and the Queensland Nurses Union for financial support.
REFERENCES
Albert Research. (2004). Results of research into the residential Aged Care Industry's use of computers and the Internet. Canberra: Department of Health & Ageing
Australian Bureau of Statistics (2005) Australian Population by Age and Sex, 3201.0.
Australian Centre for Evidence Based Residential Aged Care (2002) Recruitment and Retention of Nurses in Residential Aged Care, La Trobe University.
Australian Institute of Health and Welfare (2005) Nursing and Midwifery Labour Force 2003, Canberra.
Department of Health and Ageing. (2004). Investing in Australia's Aged Care: More Places, Better Care. Retrieved 6 February, 2006, from
http://www.health.gov.au/internet/wcms/publishing.nsf/Content/health-investinginagedcare-book-future.htm
Department of Primary Industries and Fisheries (2005) The Effects of Consumer Trends on the Lifestyle Horticulture Industry in Queensland, QueenslandGovernment. Available at: http://www.dpi.qld.gov.au/businessservices/12817.html (accessed 15 October 2005).
Healy J & Richardson S (2003) Who Cares for the Elders? What we Can and Can't Know from Existing Data., The National Institute of Labour Studies, FlindersUniversity, Adelaide.
Hegney D, Plank A & Parker V (2003) Workplace violence in nursing in Queensland Australia: A self-reported study. International Journal of Nursing Practice 9, 261-268.
Hegney DP, Buikstra E, Eley R, Fallon T, Gilmore V and Soar J (2006) Nurses and information technology. Report submitted to the Department of Health and Ageing. University of Southern Queensland, Toowoomba.
Richardson S & Martin B (2004) The Care of Older Australians - A picture of Residential Aged Care Workforce. The National Institute of Labour Studies Flinders University, Adelaide.
Stanton, P., Bartram, T. & Gareffa, T. (2005). The rise and rise of the Victorian nurses union. Melbourne: La Trobe University
Table 1. Job classification, age and employment characteristics of aged care nurses
Year of study
2001 2004
Public Private Public Private
n (%) n (%) n* (%**) n (%)
Total responses 70 (16.5) 354 (83.5) 57 (14.0) 348 (85.9) Classification AIN 26 (37.7) 135 (39.2) 24 (48.0) 149 (43.3)
EN 13 (18.8) 41 (11.9) 10 (20.0) 43 (12.5)
RN 28 (40.6) 162 (47.1) 16 (32.0) 149 (43.3)
Other 2 (2.9) 6 (1.7) 0 (0) 3 (0.8)
Within year p = .378 p = .121
Public 2001 v 2004 p = .522
Private 2001 v 2004 p = .533
Age (years) less than 30 0 (0.0) 10 (2.3) 1 (1.8) 13 (3.8) 30 - 39 10 (15.2) 33 (9.6) 7 (12.3) 34 (9.8) 40 - 49 28 (42.4) 132 (38.4) a 17 (29.8) 96 (27.7) a 50 and above 28 (42.4) 169 (49.1) b 32 (56.1) 203 (58.7) b
Within year p = .231 p = .805
Public 2001 v 2004 p = .278
Private 2001 v 2004 p = .027
Years in position less than 5 24 (34.3) 132 (37.5) 23 (40.4) 147 (42.2) 5 - 14 23 (32.9) 147 (41.8) 21 (36.8) 123 (35.3) 15 and above 23 (32.9) 73 (20.7) 13 (22.8) 78 (22.4)
Within year p = .079 p = .963
Public 2001 v 2004 p = .455
Private 2001 v 2004 p = .214
Employment Full-time permanent 23 (33.0)a 60 (17.0)a 15 (28.3) b 47 (14.6)b Part-time permanent 38 (55.1)a 277 (78.7)a 33 (62.3) b 255 (79.4)b Other 8 (11.6) 15 (4.3) 5 (9.4) 19 (5.9)
Within year p < .001 p = .021
Public 2001 v 2004 p = .726
Private 2001 v 2004 p = .464
Type of shift All three shifts 15 (22.1)a 27 (7.7)a 11 (21.2) b 36 (11.4)b Day 15 (22.1)a 55 (15.8)a 13 (25.0) b 51 (16.1)b Morning/evening 23 (33.8) 148 (42.4) 17 (32.7) 114 (36.1) Other 15 (22.1) 119 (34.1) 11 (21.2) 115 (36.4)
Within year p = 001 p =036
Public 2001 v 2004 p = .986
Private 2001 v 2004 p = .232
*n=number of responses,
**(%) = percentage of total responses
Table 2. Opinions of nurses on work load, staff numbers, staff skills and management
response
Year of study
2001 2004
Public Private Public Private
Mean rating* Mean rating Mean rating Mean rating Job completed in time available 2.9 2.9 3.4 a 3.0 a
Within year p = .589 p = .047
Public 2001 v 2004 p = .051
Private 2001 v 2004 p = .097
Sufficient staff to cover needs 2.5 2.5 a 2.8 2.8 a
Within year p = .895 p = .740
Public 2001 v 2004 p = .179
Private 2001 v 2004 p = .017
Sufficient skill mix of staff 2.7 a 2.9 b 3.3 a 3.2 b
Within year p = .139 p = .609
Public 2001 v 2004 p = .008
Private 2001 v 2004 p = .012
Committee or process effective 2.8 3.0 a 2.5 2.8 a
Within year p = .347 p = .338
Public 2001 v 2004 p = .369
Private 2001 v 2004 p = .045
* Higher the mean the more frequent the occurrence
a a, b b
Table 3. Sources of violence against nurses
Year of Study
2001 2004
Public Private Public Private
n (%) n (%) n (%) n (%) Subject to violence in last 3 months 70 (49.3) 354 (49.4) 57 (67.9) 348 (56.3)
Within year p = .982 p = .103
Public 2001 v 2004 p = .037
Private 2001 v 2004 p = .072
Source of abuse*
Clients/patients 23 (67.6) 128 (74.4) 26 (65.0) 157 (77.3)
Within year p = .415 p = .098
Public 2001 v 2004 p = .810
Private 2001 v 2004 p = .509
Visitors/relatives 2 (5.9) 22 (12.8)a 8 (20.0) 50 (24.6)a
Within year p = .251 p = .530
Public 2001 v 2004 p = .077
Private 2001 v 2004 p = .004
Other nurses 6 (17.6)a 30 (17.2)b 17 (42.5) a 74 (36.5)b
Within year p = .954 p = .470
Public 2001 v 2004 p = .021
Private 2001 v 2004 p = .000
Nurse managers 7 (20.6) 28 (16.3)a 12 (30.0) 54 (26.6)a
Within year p = .541 p = .659
Public 2001 v 2004 p = .356
Private 2001 v 2004 p = .016
Other managers 3 (8.8) 17 (9.8) 0 (0.0) 14 (6.9)
Within year p = .856 .087
Public 2001 v 2004 p = .055
Private 2001 v 2004 p = .303
Doctors 3 (8.8) 5 (2.9) 2 (5.0) 10 (4.9)
Within year p = .103 p = .984
Public 2001 v 2004 p = .514
Private 2001 v 2004 p = .320
Allied health professionals 1 (2.9) 1 (0.6) 1 (2.5) 6 (3.0)
Within year p = .200 p = .875
Public 2001 v 2004 p = .907
Private 2001 v 2004 p = .091
Other staff 0 (0.0)a 8 (4.7)b 6 (15.0) a 29 (14.3)b
Within year p = .200 p = .906
Public 2001 v 2004 p = .018
Private 2001 v 2004 p = .002
a a, b b
Figures in a row with the same superscript differ from each other (p<.05)
Table 4. Barriers to accessing training
Year of Study
2001 2004
Public Private Public Private
n (%) n (%) n (%) n (%) Lack of time 20 (37.7*) 93 (33.1)b 17 (30.4)a 52 (15.6)ab
Within year p = .513 p = .008
Public 2001 v 2004 p = .416
Private 2001 v 2004 p = .000
Lack of information 5 (9.4) 31 (11.0) 5 (8.9) 32 (9.6)
Within year p = .731 p = .872
Public 2001 v 2004 p = .927
Private 2001 v 2004 p = .563
Couldn’t afford fees 21 (39.6) 109 (38.6)a 18 (32.1) 78 (23.4)a
Within year p = .909 p = .161
Public 2001 v 2004 p = .416
Private 2001 v 2004 p = .000
Could afford to take unpaid leave 13 (24.5) 77 (27.4)a 16 (28.6) 59 (17.7)a
Within year p = .665 p = .057
Public 2001 v 2004 p = .633
Private 2001 v 2004 p = .000
Family commitments 9 (17.0) 56 (19.9)a 5 (8.9) 39 (18.7)a
Within year p = .619 p = .542
Public 2001 v 2004 p = .209
Private 2001 v 2004 p = .005
Distance was a barrier 14 (26.4) 65 (23.1)a 9 (16.1) 30 (9.0)a
Within year p = .606 p = .104
Public 2001 v 2004 p = .186
Private 2001 v 2004 p = .000
Relief staff not available 14 (26.4) 65 (23.1)a 7 (12.5) 44 (13.2)a
Within year p = .606 p = .884
Public 2001 v 2004 p = .066
Private 2001 v 2004 p = .001
Employer would not permit leave 11 (20.8)a 23 (8.2)a 6 (10.7) 25 (7.5)
Within year p = .006 p = .412
Public 2001 v 2004 p = .149
Private 2001 v 2004 p = .755
a a, b b
Figures in a row with the same superscript differ from each other (p<.05)
Table 5. Year worked and anticipated future years of work in nursing.
2001 2004
Public Private Public Private n (%) n (%) n (%) n (%) Years in nursing
Less than 5 7 (10.0) 34 (9.7) 8 (14.0) 43 (12.5) 5 - 9 7 (10.0) 44 (12.6) 6 (10.5) 52 (15.1) 10 - 14 6 (8.6) 49 (14.0) 8 (14.0) 38 (11.0) 15 - 24 21 (30.0) 83 (23.8) 10 (17.5) 68 (19.8) 25 - 34 22 (31.4) 91 (26.1) 18 (31.6) 86 (25.0) 35 and above 7 (10.0) 48 (13.8) 7 (12.3) 57 (16.6)
Within year p = .577 p = .748 Public 2001 v 2004 p = .653
Private 2001 v 2004 p = .381 Future years in nursing
Less than 2 5 (7.2) 30 (8.6) 2 (3.5) 31 (8.9) 2 – 4 9 (13.0) 60 (17.3) 8 (14.0) 67 (19.3) 5 – 9 14 (20.3) 81 (23.3) 15 (26.3) 82 (23.6) 10 – 14 17 (24.6) 80 (23.1) 9 (15.8) 67 (19.3) 15 and above 12 (17.4) 52 (15.0) 10 (17.5) 48 (13.8) Unsure 12 (17.4) 44 (12.7) 10 (17.5) 52 (15.0)
Within year p = .818 p = .381 Public 2001 v 2004 p = .708
Table 6. Experiences in nursing
2001 2004
Public Private Public Private Nursing is emotionally challenging 2.1* (±.3) 1.9** (± .1) 1.9 (± .3) 2.0 (± .1)
Within year p = .202 p = .677
Public 2001 v 2004 p = .256
Private 2001 v 2004 p = .848
Workload is heavy 1.8 (±.2)a 1.6 (± .1) 1.4 (± .2) a b 1.7 (±.1)b
Within year p = .198 p = .028
Public 2001 v 2004 p = .023
Private 2001 v 2004 p = .107
Work is physically demanding 2.0 (±.3) 1.9 (± .1) 1.9 (± .3) 2.0 (± .1)
Within year p = .627 p = .623
Public 2001 v 2004 p = .531
Private 2001 v 2004 p = .807
The pay rate is good 4.6 (±.5) 4.9 (± .2) 4.4 (± .5) 4.8 (± .2)
Within year p = .287 p = .182
Public 2001 v 2004 p = .580
Private 2001 v 2004 p = .473
Works hour are convenient 3.8 (± .5)a 4.4 (± .2)a 4.2 (± .5) 4.4 (±.2)
Within year p = .008 p = .442
Public 2001 v 2004 p = .184
Private 2001 v 2004 p = .948
Career prospects are good 3.7 (±.5)a b 4.4 (± .2)b 4.5 (± .5) a 4.2 (±.2)
Within year p = .012 p = .361
Public 2001 v 2004 p = .033
Private 2001 v 2004 p = .340
Skill/experience are not rewarded 3.2 (± .4) 3.4 (± .2) 3.3 (± .5) 3.3 (± .2)
Within year p = .291 p = .835
Public 2001 v 2004 p = .710
Private 2001 v 2004 p = .589
Nursing is a high status career 4.4 (± .5) 4.3 (± .2) 4.1 (± .5) 4.2 (± .2)
Within year p = .781 p = .659
Public 2001 v 2004 p = .361
Private 2001 v 2004 p = .314
Work stress is high 1.8 (± .3) 1.8 (± .1) 1.7 (± .3) 1.8 (± .1)
Within year p = .645 p = .627
Public 2001 v 2004 p = .611
Private 2001 v 2004 p = .714
Colleagues are supportive 3.6 (± .5) 4.0 (± .2) 3.6 (± .5) 3.9 (± .2)
Within year p = .145 p = .340
Public 2001 v 2004 p = .998
Private 2001 v 2004 p = .496
The workplace is safe 3.0 (± .4) 2.7 (± .2) 2.8 (± .4) 2.8 (± .2)
Within year p = .156 p = .982
Public 2001 v 2004 p = .469
Private 2001 v 2004 p = .521
Autonomy encouraged
Within year p = .978 p = .851
Public 2001 v 2004 p = .657
Private 2001 v 2004 p = .380
Staff morale is good 4.7 (± .5) 4.8 (± .2) 4.4 (± .5) 4.5 (± .2)
Within year p = .695 p = .828
Public 2001 v 2004 p = .529
Private 2001 v 2004 p = .067
Staff morale is deteriorating 2.9 (± .4) 3.1 (± .2) 3.2 (± .5) 3.0 (± .2)
Within year p = .640 p = .495
Public 2001 v 2004 p = .472
Private 2001 v 2004 p = .739
Workplace is well equipped 3.4 (± .4) 3.4 (± .2) 3.3 (± .5) 3.3 (± .2)
Within year p = .858 p = .864
Public 2001 v 2004 p = .620
Private 2001 v 2004 p = .598
Nursing is valued by community 2.6 (± .4) 2.8 (± .2) 2.4 (± .4) 2.7 (± .2)
Within year p = .295 p = .212
Public 2001 v 2004 p = .497
Private 2001 v 2004 p = .201
Nursing is valued by health system 3.5 (± .5) 3.7 (± .2) 3.4 (± .5) 3.7 (± .2)
Within year p = .331 p = .227
Public 2001 v 2004 p = .857
Private 2001 v 2004 p = .957
a a, b b
Figures in a row with the same superscript differ from each other (p<.05)
*means and 95% confidence intervals (95% CI)