The structure and dynamics of spawning aggregations of coral reef fish
87
0
0
Full text
(2) 2 been conducted in the context of management of commercially exploited species, understanding the fundamental basis of why, where and when spawning aggregations occur is likely to apply to all species.. 1.1.1 Definition of spawning aggregations For the purposes of this dissertation the definition of spawning aggregations proposed by Claydon (2004) has been adopted: - spawning aggregations are any temporary aggregations formed by fishes that have migrated for the specific purpose of spawning. Detailed justification for this definition is given in Chapter 2.. 1.1.2 Gaps in knowledge of spawning aggregations: Randall & Randall (1963) conducted the first study on spawning aggregations of coral reef fish. Since then, over 240 species of reef fishes from 29 families have been documented forming spawning aggregations (see Table 2.1, Chapter 2). However, spawning aggregations of reef fish remain poorly understood. For the majority of these species, little is known of their reproductive behaviour beyond the fact that they have been recorded forming spawning aggregations. Relatively few publications have dealt directly with spawning aggregations of reef fish, and a disproportionate number of the species known to form spawning aggregations come exclusively from two sources, Johannes (1981) and Squire & Samoilys (unpubl.).. A number of factors have hindered progress into research on spawning aggregations. Research has focussed on commercially important species, and primarily concentrated on just two: the Nassau grouper, Epinephelus striatus, in the Caribbean and Western Atlantic (Smith 1972, Olsen & LaPlace 1978, Colin et al. 1987, Colin 1992, Tucker et al. 1993, Aguilar-Perera 1994, Carter et al. 1994, Aguilar-Perera & Aguilar-Davilá 1996, Bolden 2000, Whaylen et al. 2004), and, to a lesser extent, the common coral trout, Plectropomus leopardus, in the Indo-Pacific (Samoilys & Squire 1994, Samoilys 1997, Zeller 1998, Fulton et al. 2000). Most commercially important species form spawning aggregations for a few days only once a month over a limited spawning season, and spawn at dusk or.
(3) 3 during the night (see Chapter 2, Domeier & Colin 1997, and Claydon 2004). Individuals of some species are known to migrate to spawning aggregation sites from home ranges over 100km away (Carter et al. 1994, Bolden 2000). Thus, annually, there are few days over which data can be collected from spawning aggregations themselves. Spawning itself may occur at times of the day/night that are most difficult to document. When not forming spawning aggregations, the populations of fish are spread over large and usually undefined areas of reef. The study of spawning aggregations of commercially important species is logistically difficult, potentially expensive and data inefficient. Accordingly, studies rarely focus on more than one species at more than one spawning aggregation site.. Whilst the study of spawning aggregations of smaller more frequently spawning fish that migrate shorter distances is logistically easier, research has concentrated on spawning aggregations of just one such species: the bluehead wrasse, Thalassoma bifasciatum (Warner & Hoffman 1980, Warner 1988b, Fitch & Shapiro 1990, Warner 1990b, a, 1995), in the Caribbean and Western Atlantic. Spawning aggregations of this species are better understood than those of any other coral reef fish, yet rarely have lessons learned from T. bifasciatum or other smaller-bodied aggregative spawners been employed to improve the understanding of their larger commercially important counterparts or vice versa. This is in part due to the artificial distinction between species that form “transient” and “resident” spawning aggregations (Domeier & Colin 1997). These terms merely denote the scale of migrations and the frequency with which spawning aggregations are formed, yet “transient” and “resident” spawning aggregations are often wrongly perceived as two different phenomena (see Chapter 2 and review in Claydon 2004).. One fundamental question that remains unanswered is: how widespread is spawning aggregation formation? Whilst this question can be answered in terms of the number of species of reef fish known to form spawning aggregations globally, it is usually not possible to answer this question in terms of the number of species that form spawning aggregations within a single reef system, single reef or even small area within a reef. Nor can this question be answered in terms of the number of individuals involved or the.
(4) 4 spatial distribution of spawning aggregation sites. Our understanding is further limited by not knowing how widespread spawning aggregation formation is as a trait amongst conspecifics both within and between populations.. 1.1.3 Hypotheses relevant to thesis: A number of hypotheses have been proposed to explain why spawning aggregations are formed, and where and when they are formed (see Chapter 2 and Claydon 2004). Whilst largely complementary, these hypotheses can be separated into those that identify the intrinsic benefits of spawning in aggregations and those that identify the intrinsic benefits of the location and timing of spawning. Although hypotheses are explored in greater detail in the relevant chapters, it is useful to present a brief overview of the hypotheses that form the conceptual framework of this thesis.. Most of the hypotheses pertinent to this thesis describe strategies that reduce the predatory threats to spawning adults and their eggs during reproductive activities. Spawning in aggregations is proposed to limit this predation by means of predator satiation/saturation: the more potential prey (i.e. the larger the aggregation), the less likely any prey item (either an egg or an adult) will be consumed (Johannes 1978). Additionally, the location and timing of aggregative spawning are believed to reduce predation on spawning adults and/or their eggs in a number of ways: •. spawning at sites and times of reduced predator densities and/or predatory efficiency (Shapiro et al. 1988);. •. spawning at sites where the substratum affords spawning adults greater refuge from predation (Shapiro et al. 1988);. •. spawning at sites and times where and when currents sweep pelagically spawned eggs more rapidly away from reefs and into waters of reduced planktivore densities (Johannes 1978, Lobel 1978);. •. spawning at sites and times coinciding with faster currents that disperse gamete clouds more rapidly and reduce the efficiency with which planktivorous fish can prey on eggs..
(5) 5 Alternatively, the location and timing of spawning may have no intrinsic advantages beyond their clarity as cues that synchronise aggregative spawning (Lobel 1978, Moyer & Zaiser 1981, Colin & Clavijo 1988, Colin & Bell 1991). The benefits of spawning in aggregations may include reduced predatory threats by means of predator satiation/saturation, increased mate choice, and the facilitation of important social interactions, such as those proposed to enable more informed decisions concerning sex change amongst sequential hermaphrodites (Shapiro et al. 1993). Due to a lack of comparative studies, most hypotheses remain largely untested, being supported anecdotally or merely by speculation (see Chapter 2 and Claydon 2004).. 1.2 Thesis outline The broad objective of this dissertation is to improve the general understanding of the structure and dynamics of spawning aggregations of reef fish. The specific aims are to identify and characterise (1) the species of reef fish forming spawning aggregations, (2) the locations where these aggregations are formed, (3) the times when they are formed, and (4) individuals’ patterns of migration to spawning aggregation sites. The thesis contains a literature review chapter (Chapter 2), 4 data chapters that address the specific aims of the thesis (Chapters 3 to 6), and a general discussion that synthesises general themes and concepts arising from the thesis as a whole, and discusses directions for future research (Chapter 7). The outlines to data chapters are as follows: Chapter 3: Spawning aggregations: species, location, and timing The first data chapter identifies the species forming spawning aggregations on the inshore reefs of Kimbe Bay, New Britain, Papua New Guinea, the sites where these aggregations are formed, and the periodicity with which species form them. This chapter investigates the prediction that spawning aggregations are more likely to be formed by larger, pelagically spawning species found in larger more dense populations. Whether the temporal patterns of aggregative spawning fit a pattern dictated by synchrony with environmental variables or by a species-specific trade-off between piscivory and.
(6) 6 planktivory is also investigated. Identifying the location and timing of spawning aggregation formation was essential in order to proceed with subsequent chapters. Chapter 4: Spawning aggregations sites: physical and biotic characteristics This chapter attempts to characterise spawning aggregation sites with regard to physical and biotic parameters. Specifically, this chapter investigates the role of predation on the location and timing on aggregative spawning, testing 2 hypotheses: 1. The physical characteristics of spawning aggregation sites help to reduce predation on spawning adults and their eggs. 2. Aggregative spawning occurs at sites and times where and when the densities of predators (of both spawning adults and eggs) are low. The degree to which the reef projected seawards, the incline of the reef slope, the potential refuge from predation (topographic complexity and number of holes in the substratum), and coral cover were compared between spawning aggregation sites and alternative sites. Similarly, the abundance of piscivores and planktivores was also compared between spawning aggregation sites and alternative sites, but also compared within sites between times when spawning aggregations were formed and at times of no such aggregations. Chapter 5: Spawning aggregation formation and currents This chapter continues on from Chapter 3, investigating the role of currents in the timing and location of aggregative spawning. Specifically, this chapter investigates whether aggregative spawning occurs at sites and times coinciding with currents that reduce the loss of pelagically spawned eggs to planktivorous predators. Currents were measured using low-tech purpose built devices. The speed and direction of currents were compared both between spawning aggregation sites and alternative sites and between times of aggregative spawning and times of no spawning within spawning aggregation sites themselves..
(7) 7 Chapter 6: Patterns of migration to spawning aggregations This chapter investigates individuals’ patterns of migration to spawning aggregations. Specifically, the influence of an individual’s size and sex, the distance of its home range from spawning aggregation sites, and the size of the spawning aggregation are investigated. Four hypotheses were tested: 1. Individuals with home ranges closer to spawning aggregation sites will migrate more frequently than those with home ranges further away. 2. Larger individuals are able to migrate further and more frequently than smaller individuals 3. Males migrate more frequently to spawning aggregations than females 4. Individuals will migrate further to spawn in aggregations with greater numbers of conspecifics. This was achieved by tagging over 400 individuals of the surgeonfish, Ctenochaetus striatus, on three reefs and then documenting individuals’ home ranges, the locations where individuals spawned in aggregations, and the frequency with which they spawned. Fieldwork was carried out on the inshore reefs of Kimbe Bay (5o30’S 150o6’E), New Britain, Papua New Guinea (see Figures 2.1 to 2.7). All maps of reefs were constructed from aerial photographs taken from a helicopter in 2004. Data was primarily collected using snorkel or SCUBA. In total, over 2000 hours of observations were made, spanning 190 days between June 2001 to May 2004, and ranging from before dawn to after dusk.. 1.3 Publications arising: Whilst Chapters 3 to 6 have been submitted for peer-reviewed publication, the following paper arising during the PhD project has been published, and is reproduced in full in the Appendices:. Claydon, J. A. B. 2004 Spawning aggregations of coral reef fishes: characteristics, hypotheses, threats and management. Oceanography and Marine Biology: An Annual Review 42, 265-302..
(8) 8 CHAPTER 2: SPAWNING AGGREGATIONS: REVIEW OF THE LITERATURE 2.1 Introduction Migration in marine animals is a well-documented phenomenon. For many of these animals, such migrations culminate in the formation of conspecific breeding aggregations, such as the mass egg-laying arribadas formed by olive ridley turtles (Eckrich & Owens 1995, Plotkin et al. 1997), the aggregations formed by anadromous salmonids returning to breed in home streams (Groot & Margolis 1991), and the aggregations formed by giant cuttlefish that migrate to the same location to spawn (Hall & Hanlon 2002). Despite being typically regarded as site-attached, sedentary and territorial (Sale 1971, Robertson & Lassig 1980, Fautin & Allen 1992, Patton 1994, Munday et al. 1997), many species of coral reef fishes have also been documented migrating to form breeding aggregations (Domeier & Colin 1997, Claydon 2004). Artisanal fishing in the tropics has exploited some spawning aggregations for centuries (Johannes & Riepen 1995), and studies date back to Randall & Randall (1963). However, research has only recently focussed on spawning aggregations since the recorded disappearance and reduction in size of aggregations targeted by commercial fishing (Sadovy 1994, Aguilar-Perera & Aguilar-Davilá 1996, Sadovy 1996). Whilst the majority of literature concerns these commercially important species, many species of coral reef fishes that are not fished commercially also form spawning aggregations (see Domeier & Colin 1997).. The broad aim of this chapter is to present a review of the literature that addresses spawning aggregations of coral reef fishes. The specific objectives of this review are to: (1) define spawning aggregations of coral reef fish (2) identify which species of coral reef fish form spawning aggregations, (3) identify any unifying characteristics these species may have, (4) critically assess the hypotheses explaining why, when and where spawning aggregations are formed. Extensive descriptions of individual species will not be made as this has been performed comprehensively by Domeier and Colin (1997)..
(9) 9 2.2 What are spawning aggregations? Defining spawning aggregations is problematic and to some extent arbitrary. In a review by Domeier and Colin (1997) a spawning aggregation was defined as "a group of conspecific fish gathered for the purpose of spawning with fish densities or numbers significantly higher than those found in the area of aggregation during non-reproductive periods". Albeit a practical and broadly accepted definition, it may be unnecessarily restrictive. It is based around the assumption that aggregative spawners will be present in greater numbers or higher densities than at non-reproductive times, and will exclude species whose behavioural ecology contradicts this assumption. Whether species are categorised as forming spawning aggregations by this definition will also vary greatly depending on the scale at which fish densities and numbers are measured. The scale of measurement will need to be appropriate for each species in question. In order to circumvent these complications and for the purposes of this thesis, a more simple definition has been adopted: - spawning aggregations are any temporary aggregation of fish that have migrated for the specific purpose of spawning.. Domeier & Colin (1997) identified two types of spawning aggregation: resident and transient. Resident aggregations are typified by smaller species of locally abundant populations from the same reef (e.g. Thalassoma bifasciatum). Transient aggregations are typified by commercially important species of disperse populations that migrate between reefs (e.g. Epinephelus striatus). However, this distinction is somewhat artificial. All spawning aggregations are “resident” in that all the constituent individuals migrating to an aggregation are, by definition, “resident” to the spawning aggregation’s catchment area. All spawning aggregations are “transient” because the aggregations are formed briefly during a period of reproductive activity, and dissipate afterwards. The distinction between “resident” and “transient” in sensu Domeier and Colin (1997) is simply a matter of scale and whether species migrate between reefs or not. In fact, the same species could be said to form a “transient” spawning aggregation at one site, but a “resident” one at another. This could arise simply because the former’s catchment area consists of multiple, small, connected reefs (separated by small distances and shallow depths), whilst the latter’s catchment area consists of one large reef isolated by great distance and depth.
(10) 10 from any others. This, not unlikely, scenario helps to illustrate that whilst the terms “resident” and “transient” may serve to create an artificial distinction between spawning aggregations, they are not intrinsically different. Whether “resident” or “transient” and regardless of the scale of the migration or the periodicity of spawning aggregation formation, the underlying processes are identical: fish migrate to form temporary aggregations for the specific purpose of spawning.. In addition to defining spawning aggregations, it is also necessary to define what group of fishes are classed as coral reef fishes. This is also problematic, but for the purposes of this thesis, coral reef fishes are defined as both “those fishes that have obligate associations with coral reef biota” (Choat & Bellwood 1991) and those that are reefassociated, sensu Choat and Bellwood (1991).. 2.3 Which species spawn in aggregations? 2.3.1 Phylogenetic distribution Globally, 243 species of reef fish from 29 families have been identified as forming spawning aggregations (see Table 2.1). The highest numbers of aggregatively spawning species are found in the Serranidae, Labridae, Scaridae, Lutjanidae, and Acanthuridae (see Table 2.1 and Figure 2.1a). However, spawning aggregation formation appears to be an uncommon characteristic relative to the total numbers of coral reef species within these families (see Figure 2.1b). Similarly, most species known to form spawning aggregations are found within families represented by proportionally few aggregative spawners (see Figure 2.1b). Whilst all coral reef species of Chanidae spawn in aggregations, this family is only represented by one such species (see Table 2.1 and Figure 2.1b)..
(11) 11 Table 2.1. Species of coral reef fish known to form spawning aggregations (updated from Claydon 2004). ACANTHURIDAE Acanthurus bahianus1,2,3. Acanthurus olivaceus9. Naso lituratus14. Acanthurus coeruleus1,2,3. Acanthurus triostegus6,8,12,13. Naso lopezi15. Acanthurus guttatus4. Acanthurus xanthopterus9. Naso unicornis14. Acanthurus lineatus5,6,7,8. Ctenochaetus striatus6,7,13. Naso vlamingii9. Acanthurus mata5. Ctenochaetus strigosus10,11. Zebrasoma flavescens10,11. Acanthurus nigricauda9. Naso brevirostris5,9. Zebrasoma scopas13. Acanthurus nigrofuscus6,7. Naso hexacanthus5. Zebrasoma veliferum9. Acanthurus nigroris10,11 ALBULIDAE Albula vulpes5 BALISTIDAE Canthidermis sufflamen16. Pseudobalistes flavimarginatus17. CAESIONIDAE Caesio teres18. Pterocaesio digramma19. CARANGIDAE Caranx bartholomaei16. Caranx melampygus5. Elagatis bipinnulata5. Caranx ferdau5. Caranx ruber16. Gnathanodon speciosus5. Caranx ignobilis5. Caranx sexfasciatus15. Megalaspis cordyla9. Caranx latus16. Caranx tille15. Selar boops5. Caranx lugubris16. Decapterus macarellus16. Selaroides sp. 15. Chaetodon auriga9. Chaetodon ornatissimus10,11. Chaetodon unimaculatus9. Chaetodon ephippium9. Chaetodon rafflesi9. Chaetodon vagabundus9. Chaetodon kleinii9. Chaetodon semeion9. Heniochus singularis9. Chaetodon lineolatus9. Chaetodon trifasciatus9. Heniochus varius9. Gerres erythrourus5. Gerres oblongus5. Diagramma pictum9. Plectorhinchus chrysotaenia9. Plectorhinchus lineatus9. Haemulon album20. Plectorhinchus flavomaculatus9. Plectorhynchus obscurus5. Plectorhinchus chaetodonoides9. Plectorhinchus gibbosus9. Plectorynchus goldmani5. CHAETODONTIDAE. Chaetodon melannotus9 CHANIDAE Chanos chanos5 EPHIPPIDAE Platax orbicularis9 GERREIDAE Gerres argyreus5 HAEMULIDAE.
(12) 12 Table 2.1 continued. HEMIRAMPHIDAE Rhynchorhamphus goergii5 KYPHOSIDAE Kyphosus bigibbus15. Kyphosus cinerascens15. Kyphosus vaigensis15. Bodianus loxozonus9. Epibulus insidiator9. Stethojulis interrupta21. Cheilinus chlorourus9. Halichoeres hortulanus9. Stethojulis trilineata23. Cheilinus fasciatus9. Halichoeres prosopeion9. Thalassoma amblycephalum21. Cheilinus undulatus9. Halichoeres tenuisipinis21. Thalassoma bifasciatum23,24,25,26. Choerodon anchorago5. Hemigymnus melapterus9. Thalassoma hardwicke23. Cirrhilabrus punctatus9. Lachnolaimus maximus15. Thalassoma lutescens22. Clepticus parrae2. Macropharyngodon ornatus9. Thalassoma purpureum9. Coris aygula9. Oxycheilinus unifasciatus10,11. Thalassoma quinquevittatum22. Coris gaimard10,11. Pseudocoris yamashiroi22. LABRIDAE. LETHRINIDAE Lethrinus atkinsoni9. Lethrinus mahsena27. Lethrinus olivaceus15. Lethrinus crocineus27. Lethrinus miniatus5. Lethrinus xanthochilus15. Lethrinus harak5. Lethrinus nebulosus1,28,29. Monotaxis grandoculis5. Aprion virescens5. Lutjanus cyanopterus40. Lutjanus sanguineus27. Lutjanus adetii30. Lutjanus gibbus5,14. Lutjanus sebae5. Lutjanus analis 31,32,33,34,35,36. Lutjanus griseus36. Lutjanus synagris42. Lutjanus apodus37. Lutjanus jocu40,41. Lutjanus vitta15. Lutjanus argentimaculatus5. Lutjanus kasmira9. Macolor niger43. Lutjanus argentiventris38. Lutjanus malabaricus5. Ocyurus chrysurus37. Lutjanus bohar5,14. Lutjanus novemfasciatus38. Symphorichthys spilurus5. Lutjanus campechanus39. Lutjanus rivulatus30. Symphorus nematophorus5. Lethrinus lentjan5 LUTJANIDAE. Lutjanus carponotatus9 MONACANTHIDAE Amanses scopas9. Oxymonacanthus longirostris9. MUGILIDAE Crenimugil crenilabis5,44. Liza vaigiensis5. Neomyxus leuciscus15. Liza macrolepis5,45. Mugil cephalus15. Valamugil seheli45. Mulloidichthys flavolineatus15. Parapeneus bifasciatus10,11,15. Pseudupeneus maculatus45. Mulloidichthys vanicolensis9. Parapeneus multifasciatus10,11. MULLIDAE.
(13) 13 Table 2.1 continued. MURAENIDAE Unidentified sp.47 OSTRACIIDAE Ostracion meleagris10,11 POMACANTHIDAE Centropyge bicolor9. Pomacanthus sexstriatus9. Pygoplites diacanthus9. Pomacanthus imperator9 POMACENTRIDAE Chromis cinerascens9. Chromis viridis48. PRIACANTHIDAE Heteropriacanthus cruentatus15. Priacanthus hamrur9. SCARIDAE Bolbometopon muricatum14. Scarus altipinnis9. Scarus microrhinos9,22. Calotomus carolinus10,11. Scarus chameleon9. Scarus niger9. Cetoscarus bicolor9. Scarus dimidiatus9. Scarus oviceps9. Chlororus gibbus5. Scarus forsteni9. Scarus prasiognathos15. Chlorurus bleekeri9. Scarus frenatus9. Scarus psittacus10,11. Chlorurus frontalis15. Scarus ghobban9. Scarus rubroviolaceus9. Chlorurus sordidus9,49. Scarus globiceps9. Scarus schlegeli9. Hipposcarus harid 46,50. Scarus iseri 23,46,51. Sparisoma rubripinne 23,51,52. Grammatorcynus bicarinatus5. Rastrelliger kanagurta15. Epinephelus fulvus15. Epinephelus. Hipposcarus longiceps9 SCOMBRIDAE Scomberomorus commersoni5 Acanthocybium solandri5 SERRANIDAE Anyperodon leucogrammicus9 15. 5. Cephalopholis argus. Epinephelus fuscoguttatus. Cephalopholis boenak15. Epinephelus. Cephalopholis cruentata53. striatus 53,62,63,64,65,66,67,68,69,70 Epinephelus trimaculatus15. guttatus 3,31,54,55,56,57,58,59,60,61. Epinephelus tukula27. Cephalopholis miniata15. Epinephelus itajara 3,31,65. Gracila albomarginata9. Cephalopholis sexmaculata15. Epinephelus lanceolatus15. Mycteroperca bonaci 41,65,66,71. Cephalopholis sonnerati15. Epinephelus maculatus15. Mycteroperca microlepis 67,72,73,74. Cephalopholis urodeta15. Epinephelus malabracus9. Mycteroperca phenax 67,72,73,74. Epinephelus adscencionis54. Epinephelus merra5. Mycteroperca tigris66,75,77. Epinephelus chlorostigma27. Epinephelus multinotatus15. Mycteroperca. 15. 15. venenosa 57,58,65,66,67,70,71,76,77. Epinephelus coioides. Epinephelus ongus. Epinephelus corallicola15. Epinephelus polyphekadion14. Paranthias furcifer71. Epinephelus cyanopodus15. Epinephelus spilotoceps15. Plectropomus areolatus78.
(14) 14 Table 2.1 continued. SERRANIDAE continued Plectropomus laevis15. Plectropomus maculatus15. Pseudanthias pleurotaenia9. Plectropomus leopardus5,78,79,80. Plectropomus oligacanthus15. Pseudanthias tuka9. Siganus argenteus5. Siganus puellus15. Siganus randalli15. Siganus canaliculatus5,29. Siganus punctatus5. Siganus spinus5. Siganus guttatus15. Siganus sutor27. Siganus vermiculatus15. Acanthopagrus berda82. Pagrus auratus15. SIGANIDAE. Siganus lineatus5 SPARIDAE Acanthopagrus australis81 SPHYRAENIDAE Sphyraena barracuda5. Sphyraena genie5. Note: 1Colin 1985; 2Colin & Clavijo 1988; 3Colin 1994; 4Craig 1998; 5Johannes 1981; 6Robertson 1983; 7. Myrberg et al. 1988; 8Randall et al. 1990; 9Squire and Samoilys unpubl.; 10Sancho et al. 2000a; 11Sancho et. al. 2000b; 12Randall 1961a; 13Randall 1961b; 14Johannes et al. 1999; 15SCRFA 2004; 16Whaylen et al. 2004; 17. Gladstone 1994; 18Bell & Colin 1986; 19Thresher 1984; 20Claro & Lindeman 2003; 21Nakazono 1979;. 22. Colin & Bell 1991; 23Randall & Randall 1963; 24Warner & Robertson 1978; 25Warner & Hoffman 1980;. 26. Warner 1988; 27Robinson et al. 2004; 28Ebisawa 1990; 29Hasse et al. 1977; 30Johannes & Hviding 2000;. 31. Schroeder 1924; 32Rojas 1960; 33Craig 1966; 34Claro 1981; 35Mueller 1994; 36Domeier et al. 1996;. 37. Lindeman et al. 2000; 38Sala et al. 2003; 39Moe 1963; 40Domeier & Colin 1997; 41Carter & Perrine 1994;. 42. Reshetnikov & Claro 1976; 43Myers 1989; 44Helfrich & Allen 1975; 45Johannes & Yeeting 2001; 46Colin. & Clavijo 1978; 47Kuiter & Debelius 1994; 48Lewis 1997; 49Yogo et al. 1982; 50Gladstone 1996; 51Colin 1978; 52Colin 1996; 53Sala et al. 2001; 54Colin et al. 1987; 55Burnett-Herkes 1975; 56Garciá-Moliner 1986; 57. Beets & Friedlander 1992, 1998; 58Bullock et al. 1992; 59Shapiro & Rasotto 1993; 60Shapiro et al. 1993;. 61. Sadovy et al. 1994a; 62Smith 1972; 63Carter 1988a; 64Carter 1988b; 65Carter 1989; 66Fine 1990; 67Colin. 1992; 68Tucker et al. 1993; 69Aguilar-Perera 1994; 70Carter et al. 1994; 71Fine 1992; 72Gilmore & Jones 1992; 73Coleman et al. 1996; 74Koenig et al. 1996; 75Sadovy et al. 1994b; 76Olsen & LaPlace 1979; 77. Bannerot 1984; 78Johannes 1988; 79Samoilys & Squire 1994; 80Samoilys 2000; 81Pollock 1984; 82Sheaves. et al. 1999..
(15) an La idae br i Sc dae a Lu rida t Ac jan e an ida th e Ca urid Ch ra ae ae ng to ida do e H ntid ae m ae u Si lida ga e Le nid th ae rin M ida ug e ili Po M dae u m lli ac da a e Sc nthi om dae b G rida er e Ky rei ph dae os i Sp dae a C ri M aes i dae on on a i Po c an dae m thi ac d Pr ent ae iac rid Sp ant ae hy hid ra ae en Ba ida lis e Al tida bu e l Ch idae a n H Eph ida em ip e ira pid m ae M phid ur ae a O enid s tr a ac e iid ae. Se rr. % species in family. Frequency. (a) 40. (b) 30. 20. 10. 0 100. 75. 50. 25. 0. Figure 2.1.(a) The numbers of species of coral reef fishes known to form spawning aggregations from the 29 families identified in Table 2.1. (b) The percentage of coral reef fishes in each family known to form spawning aggregations. Data were compiled from Nelson (1994) and Froese & Pauly (2000).. 15.
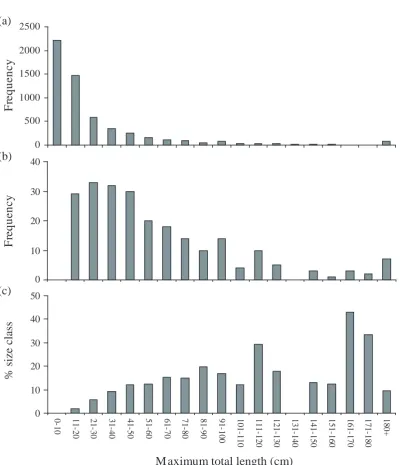
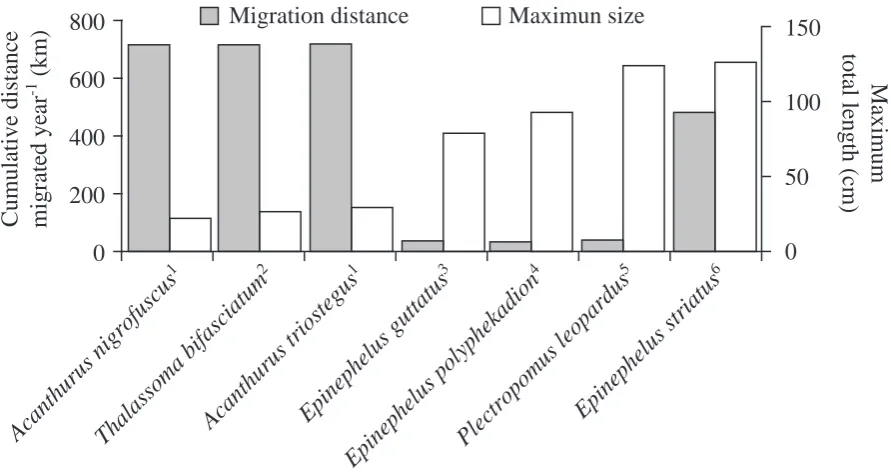
(16) 16. 2.3.2 Body size Although around 50% of species forming spawning aggregations are less than 50cm in maximum total length, the relative proportion of larger reef fish spawning in aggregations is greater than that of smaller reef fish, and no species with a maximum total length of less than 10cm spawn in aggregations (see Figure 2.2). The absence of species from the smallest size class (<10cm total length) has been attributed to a hypothesised correlation between size and ability to migrate to form spawning aggregations, with smaller species being less able to afford either the energetic cost of migration (energy spent in movement, and time not spent feeding in preferred areas) or the increased risk of predation associated with migration (Domeier & Colin 1997). However, this opinion may attribute too much to the cost of migration. Many small species of fish, especially planktivorous and opportunistic scavenging species, spend the majority of the day moving. Species like the large serranids (e.g. Epninephelus striatus) are relatively sedentary fish and migrations will represent a considerable proportion of their energetic budget. Additionally, while many small wrasses migrate daily (e.g. Thalassoma bifasciatum, Warner 1995), the larger species may migrate monthly during a limited spawning season. The cumulative distances migrated annually by smaller daily spawning species can be equal to or higher than that of their larger counterparts (see Figure 2.3). Whilst the ability to migrate is an important prerequisite for spawning in aggregations, a species' size may not be a good determinant of this ability.. The prevalence of larger species may be attributable to sampling artefact. Information about spawning aggregations has originated primarily from fishermen (see Johannes 1981). Therefore, it is to be expected that most species identified as being aggregative spawners are commercially or artisanally important, and thus tend to be larger fish. More non-commercial species of aggregative spawner are likely to be identified in the future as research continues (Domeier & Colin 1997)..
(17) 17 (a) 2500 Frequency. 2000 1500 1000 500. Frequency. (b). % size class. (c). 0 40 30 20 10 0 50 40 30 20 10 180+. 171-180. 161-170. 151-160. 141-150. 131-140. 121-130. 111-120. 101-110. 91-100. 81-90. 71-80. 61-70. 51-60. 41-50. 31-40. 21-30. 11-20. 0-10. 0. Maximum total length (cm) Figure 2.2.(a) Size-frequency distribution of coral reef fishes. (b) Size-frequency distribution of coral reef fishes known to form spawning aggregations. (c) The proportion of each size class represented by species known to form spawning aggregations. The total length data were compiled from sources too numerous to list, but all data can be found in Froese & Pauly (2000)..
(18) Migration distance. 800. Maximun size. 600. 100. 400 50. 200. 0. al as so m. Th. an. th u. ru s. ni gr of us cu s1 a bi fa Ac sc an ia tu th m2 ur us tri Ep os te in gu ep s1 Ep he lu in sg ep he ut lu ta sp tu s3 ol yp Pl he ec ka tro di po on 4 m us le op Ep ar in du ep s5 he lu ss tri at us 6. 0. Ac. 150 Maximum total length (cm). Cumulative distance migrated year-1 (km). 18. Figure 2.3. The estimated annual cumulative distance migrated by reef fishes with known migration distances to spawning aggregation sites. Cumulative distance was calculated by doubling the maximum distance that species were known to migrate to spawning aggregations, to account for return journeys, and then by multiplying this distance by the annual frequency with which species were known to form spawning aggregations. 1Robertson (1983); 2Warner (1995); 3. Burnett-Herkes (1975); 4Johannes et al. (1999); 5Zeller (1998); 6Carter et al. (1994).. 2.3.3 Spawning mode The lack of species from the smallest size class (<10cm maximum total length) forming spawning aggregations may be more a reflection of the spawning mode of fish rather than the larger species’ ability to migrate further distances under lower predation pressure. The majority of species known to form spawning aggregations spawn pelagically. Only 3 species exhibit a different mode of spawning: two Balistidae (Canthidermis sufflamen and Pseudobalistes flavimarginatus), and one Pomacentridae (Chromis viridis) have been documented laying demersal eggs in spawning aggregations (Gladstone 1994, Lewis 1997, Whaylen et al. 2004). Apart from the eggs spawned by the Siganidae which are negatively buoyant, adhesive, and demersal (Thresher 1991), fertilised pelagically spawned eggs are buoyant and remain in the water column..
(19) 19 Pelagic spawning appears to be a trait associated with larger species (Munday & Jones 1998). With the exception of the pelagically spawning Callionymidae, the majority of smaller species of reef fish are either brooders or demersal spawners (Munday & Jones 1998) and thus may be precluded from forming spawning aggregations. The only relatively small species (<15cm maximum total length) known to form spawning aggregations are members of the Labridae, Monacanthidae and Serranidae. Labridae and Serranidae are all pelagic spawners (Thresher 1984). Monacanthidae is represented by pelagic spawning and egg laying species (Thresher 1984, Nelson 1994). All three families are represented by species from a wide size range (<10cm to >100cm). The majority of small species (<10cm) come from families that are represented exclusively by small species (see Munday & Jones 1998).. The idea that pelagic spawning is a prerequisite for forming spawning aggregations appears to be supported by the conspicuous absence of all but two of the Balistidae. The Balistidae are relative large and abundant on many coral reefs but are demersal spawners (Thresher 1984, 1991). However, historically, only pelagically spawning species have been recognised as forming spawning aggregations (see Domeier & Colin 1997), and this may have inhibited species with other spawning modes from being considered. In the future, as the reproductive ecology of non-pelagically spawning species becomes better understood, more species with these modes of spawning, particularly the Balistidae, are likely to be recognised as forming spawning aggregations.. 2.3.4 Population density Although only a small proportion of all coral reef fish are known to form spawning aggregations, the species that form spawning aggregations can be among those with the highest densities within their size classes on reefs (with the exception of the smallest size classes, see Figure 2.2) and thus may represent a more common phenomenon, than is reflected by the number of species alone. A species' ability to form spawning aggregations may rely on a combination between its density and its ability to overcome the costs of migration. On average, for species that form spawning aggregations, those.
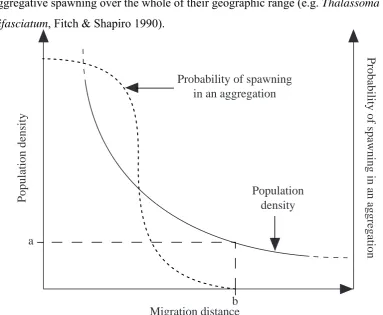
(20) 20 with lower densities will have to travel further to form a spawning aggregation of the same size. Therefore, it is to be expected that, below a species-specific threshold density, migration distance will become prohibitively high (see Figure 2.4). Thus, rare or locally uncommon species are unlikely to form spawning aggregations. This may also explain why species known to form spawning aggregations at one location may not display aggregative spawning over the whole of their geographic range (e.g. Thalassoma bifasciatum, Fitch & Shapiro 1990).. Population density. Population density. a. Probability of spawning in an aggregation. Probability of spawning in an aggregation. b Migration distance Figure 2.4. The hypothetical interrelationship between population density (full line), migration distance, and the probability that a population will form spawning aggregations (dotted line). When the population density becomes too low (a) the migration distance becomes prohibitively high (b) and spawning aggregations will not be formed.. Whilst population density and ability to migrate further distances under reduced predation pressure may be important in determining whether species spawn aggregatively, both these factors may be related to body size and subsequently phylogeny. Smaller species tend to live at higher densities (Munday & Jones 1998), and larger species are considered, not unequivocally, to be more capable of overcoming the costs of migration (Domeier & Colin 1997, but see Figure 2.3). This may explain why many of the larger predatory species typically found at low densities are also known to form spawning aggregations (see Table 2.1) Unfortunately, the phylogenetic relationships.
(21) 21 within families of coral reef fish are not presently well described. Until such a time as they are, it will not be possible to assess the relative importance of the interrelated factors of phylogeny, body size, spawning mode and population density in determining whether species form spawning aggregations.. 2.4 Where are spawning aggregations formed? Known spawning aggregations are spatially predictable, being found at the same location over successive spawning seasons (see Domeier & Colin 1997). It is commonly asserted that spawning aggregations are always found at sites on reefs in association with particular physical characteristics, especially promontories, channels and off-reef currents. However, this misconception was highlighted by Domeier et al. (2002), and of the few spawning aggregations with adequately described physical characteristics, only 23% were found on promontories or bommies and only 19% on the down-current margin of reefs, with 54% found on outer reef edges, 47% in channels or passages, and 7% on seaward projections or peninsulas (see Table 2.2). Larger species appear to form spawning aggregations at greater depths than smaller one (15 to <40m compared with <15m, see Table 2.2). Apart from Epinephelus polyphekadion which is recorded as forming spawning aggregations exclusively in channels or passages, the physical characteristics of spawning aggregations are not consistent within families or for species where data on multiple sites exist (see Table 2.2 and Domeier et al. 2002). However, it is difficult to make a critical assessment because of the subjective nature of descriptions and the general absence of detailed descriptions of spawning aggregation sites in much of the literature.. The common assertion that spawning aggregations are found in association with particular reef features may derive from the fact that any site is likely to fall into one of very few broad categories. Four reef structures encompass almost all possible reef structures: (1) channels and passages, (2) walls, (3) promontories, and (4) reef slopes. All of the terminology is subjective and greatly dependent on scale. For example, by what distance do two reefs have to be separated before the space between them is no longer.
(22) 22 considered a channel or a passage? How steep does the incline of a reef have to be in order that it be termed a wall rather than a reef slope? Additionally, the term promontory can be used to encompass a whole range of reef features: projections from the sea floor, sea-mounts, bommies, horizontal projections or penisulars of reef, and submerged plateaus..
(23) 23. Table 2.2. Reef features documented where spawning aggregations are formed. Reef Feature Species ACANTHURIDAE Acanthurus guttatus Acanthurus guttatus Acanthurus lineatus Acanthurus lineatus Acanthurus lineatus Acanthurus lineatus Acanthurus mata Acanthurus nigrofuscus Acanthurus nigrofuscus Acanthurus nigrofuscus Acanthurus nigrofuscus Acanthurus triostegus Acanthurus triostegus Acanthurus triostegus Acanthurus triostegus Ctenochaetus striatus Ctenochaetus striatus Ctenochaetus striatus Ctenochaetus striatus Naso brevirostris Naso hexacanthus Naso unicornis Paracanthus hepatus Zebrasoma scopas. Depth. Outer Reef. Channel/. Promontory/. Down-Current. Seaward. (m). Edge. Passage. Bommie. Margin. Projection. / 4-7 3-7 3-7 3-5 / / 9 2-5 2-5 <8 7 5-7 / <1-6 9 / / 2-7 / / / 7-8 3-6. √ √ √ √ √ √ √ √ √ √ √ √ √ √. √ √. Other. √. 1. √. 3. 2. 3. √ √. 1. √. Reef Flat. √. √ √ √ √. √. √. 4 3. √. 3. √. 3. √. 2. 3. 5. 1. √ √ √ √. √ √ √. 1. √. √. 4 3 3 6 1 1 1. √ √. √ √. 2. √. √. Reference. √. 3 5.
(24) 24. Table 2.2 continued Reef Feature Species ALBULIDAE Albula vulpes HEMIRAMPHIDAE Rhynchoramphus goergii CARANGIDAE Caranx ignoblis Selar boops CAESIONIDAE Caesio teres GERREIDAE Gerres abbreviatus Gerres oblongus LABRIDAE Cheilinus undulatus Choeredon anchorago Pseudocoris yamashiroi Thalassoma amblycephalum Thalassoma bifasciatum Thalassoma bifasciatum Thalassoma hardwicke Thalassoma lutescens Thalassoma quinquenittatum Thalassoma quinquenittatum. Depth. Outer Reef. Channel/. Promontory/. Down-Current. Seaward. (m). Edge. Passage. Bommie. Margin. Projection. /. √. 1. /. √. 1. / /. √ √. 1. <2. √ √. / / 1-3 5-7 7 <2 1 4-6 / 1. √ √. Reference. 1. √. / /. Other. 7. √. 1. √ √. 1. Reef Walls. √ √. 1 9. √ √. 9. √. √ √ √ √ √ √. 8. √ √ √. 10 11 2 9 9. √. 2.
(25) 25. Table 2.2 continued Reef Feature Species LETHRINIDAE Lethrinus harak Lethrinus miniatus Monotaxis grandoculis LUTJANIDAE Lutjanus argentimaculatus Lutjanus bohar Lutjanus cyanopterus Lutjanus gibbus Lutjanus jocu Symphoricthys spilurus Symphorus nematophorus SCARIDAE Bolbometopon muricatum Chlororus gibbus Hipposcarus harid Scarus iseri Epinephelus striatus Sparisoma rubripinne. Depth. Outer Reef. Channel/. Promontory/. Down-Current. Seaward. (m). Edge. Passage. Bommie. Margin. Projection. / / / / / 2-10 / 2-10 / / / / / 20 / 20. √ √ √ √. Outer lagoon of fringing reef Outer and inner edges of barrier reef Bottom of reef slopes. 1. Deep water in lagoon. 1. 1 1. 1 12. √. 12. √ √. 1. 1 1. 1. √. √. Reference. √ √. √ √ √. Other. √ √ √ √ √. 1 1 11 13 11.
(26) 26. Table 2.2 continued Reef Feature Depth. Outer Reef. Channel/. Promontory/. Down-Current. Seaward. (m). Edge. Passage. Bommie. Margin. Projection. SERRANIDAE Epinephelus fuscogutattus Epinephelus polyphekadion Epinephelus polyphekadion Epinephelus polyphekadion Epinephelus polyphekadion Epinephelus polyphekadion. / 12-35 12->35 7-42 / 25->60. √. Epinephelus polyphekadion. /. Epinephelus polyphekadion. /. Epinephelus polyphekadion. /. Epinephelus polyphekadion. /. √ √ √ √ √ √ √ √ √ √. Species. Epinephelus striatus Epinephelus striatus. 25-30 27-30. Epinephelus striatus. /. Epinephelus striatus. /. Epinephelus striatus. 29-38. Epinephelus striatus. 18-21. Plectropomus areolatus Plectropomus laevis Plectropomus laevis Plectropomus leopardus Plectropomus leopardus. / / / 20-25 15-20. Reference. 14 14 14 14 15. Reef Wall. 16 17 18 19 20. √ √ √ √. √. 21. √ √. 22 23 24. Spurs and Grooves. 25. Inshore from reef within <500m from shore. 22. √ √. 8. √ √ √. 8. √. 26 27. √ √. Other. √. 28.
(27) 27. Table 2.2 continued Reef Feature Species SIGANIDAE Siganus canaliculatus Siganus canaliculatus Siganus lineatus SUMMARY: Number of Times Reef Feature Documented 1. Depth. Outer Reef. Channel/. Promontory/. Down-Current. Seaward. (m). Edge. Passage. Bommie. Margin. Projection. / / 20 /. Other. Reference. √. 29. √ √. √. 1. 47(46%). 39(38%). 1. 19(17%). 15(15%). 6(6%). Decreasingly Documented Reef Feature. Johannes 1981; 2Craig 1998; 3Robertson 1983; 4Myrgerg et al. 1988; 5Randall 1961b; 6 Randall 1961a; 7 Bell & Colin 1986; 8 Johannes & Squire 1988; 9 Colin. & Bell 1991; 10 Warner 1995; 11 Randall & Randall 1963; 12 Heyman et al. 2001; 13 Colin 1978; 14 Johannes et al. 1994; 15 D. Wase, personal communication in Rhodes 2002; 16 Rhodes & Sadovy 2002; 17 Johannes & Lam 1999; 18 Passfield 1996; 19Kulbiciki personal communication in Rhodes 2002; 20Loubens 1980; 21. Colin et al. 1987; 22Colin 1992; 23Burnett-Herkes 1975; 24Smith 1972; 25Sala et al. 2001; 26Carlos & Samoilys 1993; 27Samoilys 1997; 28Zeller 1998; 29Hasse et. al. 1977..
(28) 28. The spatial predictability of known spawning aggregations may assign unwarranted importance to the physical features of the sites where these aggregations are found. The flawed argument is that if a site is consistently used, then the characteristics of that site must enhance the fitness of the spawners in some fashion. However, whilst the general location of a spawning aggregation may be predictable, its precise location within that area may not be (Shapiro et al. 1988, Shapiro et al. 1993, Sadovy et al. 1994b). This can be explained in three ways:. (1) Preferable reef features, enhancing the fitness of spawners, may be absent in areas where the precise location of spawning aggregations is more variable. Therefore, there is no selective advantage to spawning consistently in any single precise location. The smaller the catchment area of a spawning aggregation, the less likely the area is to encompass preferable reef features from which to spawn. Therefore, one would expect the precise location of spawning aggregations to be more variable the shorter the migration distance. However, from the limited data available, the opposite appears to be the case (Shapiro et al. 1988, Shapiro et al. 1993, Sadovy et al. 1994b).. (2) Reef features at different locations may enhance the fitness of the spawners only in a limited or specific set of environmental conditions. When these environmental requirements are not met at one precise location, the aggregation is formed at another where the physical characteristics of the reef do enhance fitness in these environmental conditions. Thus the spawning aggregation fine-tunes its precise location to match environmental conditions. The only environmental conditions likely to vary are hydrodynamic, but no studies have examined the hydrodynamic regime in spawning areas on a scale fine enough to investigate this.. (3) The fitness of aggregative spawners is not enhanced by the presence or absence of physical features at their sites of spawning, and thus preferable features per se do.
(29) 29 not exist. However, the idea that spawning sites are selected arbitrarily appears to be contradicted by the numerous reports of many species forming spawning aggregations at the same site (Randall & Randall 1963, Thresher 1984, Thresher & Brothers 1985, Bell & Colin 1986, Colin & Bell 1991, Colin 1996, Johannes et al. 1999, Sancho et al. 2000b).. Whilst known spawning aggregations are spatially predictable, the above data suggest that undiscovered spawning aggregations cannot be predictably located from the physical structures of reefs. However, a GIS approach has proved useful in locating previously unknown spawning aggregations of Lutjanids in Belize (W. Heymen, unpubl.), and operators in the live reef food fish trade have employed fishermen to locate likely sites of spawning aggregations from spotter planes (Johannes 1997). The former used bathymetric charts to identify areas with probable current convergence. The latter relied on fishermen being able to locate spawning aggregations from the visible physical characteristics of reefs. How successful these fishermen were in locating spawning aggregations, and the criteria they used are unknown.. The Society for the Conservation of Reef Fish Aggregations (SCRFA) is compiling a database (SCRFA 2004) which is likely to reveal any patterns that exist in the physical characteristics of spawning aggregation sites. However, SCRFA is unlikely to make any such patterns public knowledge for fear that this will lead to further exploitation of previously undiscovered spawning aggregations.. 2.5 When are spawning aggregations formed? Spawning aggregation formation can also be predictable in time. There are four levels to the periodicity of spawning aggregations: seasonal, lunar, diel and tidal. Assigning periodicity to the occurrence of spawning aggregations requires lengthy and systematic sampling, and for this reason knowledge beyond the level of the season is unknown for many species. Many of the spawning aggregations of the Serranidae are formed in association with states of the moon (especially the full and new moons) during limited.
(30) 30 seasons, but whether spawning occurs at a particular state of the tide or time of day is largely unknown (see Table 2.3). Spawning in association with states of the moon is also displayed by the Acanthuridae, Scaridae and Labridae (see Table 2.3). However, spawning aggregations of these families display a range of periodicities, including being formed daily, on the ebb tide, at certain times of the day, during limited spawning seasons or year-round, and differences within species are common between locations (see Table 2.3). The seasonal and lunar periodicity of spawning aggregation formation of Serranidae also differs within species at different locations and can vary substantially at locations that are relatively close to one another (see Table 2.3). The seasonal differences of Epinephelus striatus spawning aggregations at different locations in the Caribbean and western Atlantic are believed to be associated with water temperature (Colin 1992), but no such association has been proposed to account for the different seasons of other tropical serranids throughout the world..
(31) 31. Table 2.3 The periodicity of spawning aggregations of species with data from multiple locations. Species/Country. Location. ACANTHURIDAE Acanthurus lineatus American Samoa / Australia Lizard Island Palau Peleliu Palau Koror Island Acanthurus triostegus American Samoa / Hawaii / Palau / Seychelles Aldabra Atoll Acanthurus nigrofuscus Red sea / Seychelles Aldabra Atoll Australia Lizard Island Palau / Ctenochaetus striatus Red Sea / Seychelles Aldabra Atoll Palau / Society Islands / SCARIDAE Scarus iseri Puerto Rico South West Jamaica /. Season. Lunar. Tidal. Time of Day. Reference. Year round December April February-April. / / New Prior to Full. / Ebb / Ebb. Dawn / / /. Craig 1998 Robertson 1983 Johannes 1981 Johannes 1981. Year round December-July May-August November-December. / 12-2 Days before Full After New /. / / / Ebb. Dusk / / /. Craig 1998 Randall 1961a Randall 1961b Robertson 1983. June-September November-December February-April January-April. Daily Before New/Full / 5-7days before new/full. / Ebb Ebb Ebb. / / / /. Myberg et al 1988 Robertson 1983 Robertson 1983 Robertson 1983. June-September August-December January-April February. / 4-7days before full/new 4-7days before full/new Not after new/full. / Ebb Ebb /. / / / /. Myberg et al 1988 Robertson 1983 Robertson 1983 Randall 1961b. August-March1 March-August1. / /. / /. Afternoon /. Colin & Clavijo 1988 Colin 1978b.
(32) 32. Table 2.3 continued Species/Country. Location. SERRANIDAE Epinephelus fuscoguttatus Marshall Islands / Palau / Solomon Islands Roviana Lagoon Solomon Islands Marovo Lagoon Solomon Islands Ontong Java Epinephelus polyphekadion Solomon Islands Roviana Lagoon Solomon Islands Marovo Lagoon Solomon Islands Ontong Java Micronesia Pohnpei Palau States of Koror & Ngarchelong Cook Islands New Caledonia / New Caledonia / Epinephelus striatus Bahamas / Belize / Bermuda / Bermuda / Jamaica South Virgin Islands / Bonaire /. Season. Lunar. Tidal. Time of Day. Reference. November-December May-June October-January February-June 2 spawning seasons yr-1. / New-Full / / /. / / / / /. / / / / /. Johannes 1981 Johannes 1981 Johannes & Lam 1999 Johannes & Lam 1999 Johannes & Lam 1999. October-January February-June 2 spawning seasons yr-1 February-April January-August. / / / 1-2 Days prior to Full New Moon. / / / / /. / / / Dusk-Dawn /. Johannes & Lam 1999 Johannes & Lam 1999 Johannes & Lam 1999 Rhodes & Sadovy 2002 Johannes et al. 1999. April-June October-February November-January. / / Full Moon. / / /. / / /. Passfield 1996 Loubens 1980 Kulbicki, pers. comm. in Rhodes 2002. December-January December-January May-July May-August March January-February March. Full Moon Full Moon Full Moon / Full Moon Full Moon /. / / / / / / /. Sunset / / / / / /. Colin 1992 Carter 1989 Bardach et al. 1958 Smith 1971 Thompson & Munro 1983 Olsen & LaPlace 1978 E. Newton, pers. comm. in Colin 1992.
(33) 33. Table 2.3 continued Species/Country. Location. Season. Lunar. Tidal. Time of Day. Reference. SERRANIDAE continued Plectropomus areolatus Palau / May-June Full-New / / Johannes 1981 Solomon Islands Roviana Lagoon October-January / / / Johannes & Lam 1999 Solomon Islands Marovo Lagoon February-June Last Lunar Quarter2 / / Johannes & Lam 1999 Solomon Islands Ontong Java 2 spawning seasons yr-1 / / / Johannes & Lam 1999 Solomon Islands / March-May 7 days before New / / Johannes & Squire 1988 Plectropomus laevis Australia Northern GBR September-January / / / Johannes & Squire 1988 Australia Northern GBR November-December / / / Carlos & Samoilys 1993 Plectropomus leopardus Australia Lizard Island / New Moon / / Zeller 1998 Australia Northern GBR October-November Full-New Ebb Dusk Samoilys & Squire 1994 Australia Northern GBR November-December / / / Johannes & Squire 1988 Australia Southern GBR November-January / / / Brown et al. 1994 LABRIDAE Thalassoma bifasciatum Puerto Rico / Year round / / Afternoon4 Alvey 1990 3 Barbados / Year round / Ebb / Hunt von Herbing & Hunte 1991 Key: / Data unavailable; 1 Spawning year round but most intense during dates mentioned; 2 (Johannes 1988); 3 Greater spawning activity during spring tides; 4 Exact time differs from reef to reef..
(34) 34. 2.6 Hypotheses Many of the hypotheses explaining where and when spawning aggregations of reef fish are formed are not specific to aggregative spawners, but may apply to pelagically spawning reef fish in general (e.g. Robertson & Hoffman 1977, Johannes 1978, Shapiro et al. 1988). Although focussing on aggregative spawners, where appropriate, data from non-aggregatively spawning reef fish will be included in critical assessment of the pertinent hypotheses. Shapiro et al. (1988) outlined the lack of quantitative research addressing these hypotheses for pelagically spawning coral reef fish, and over a decade later, the situation has not improved. These hypotheses can be divided into two categories, those that explain the phenomenon of aggregative spawning itself, and those that explain where and when spawning aggregations are formed.. 2.6.1 Hypotheses explaining the phenomenon of aggregative spawning: Predator satiation (saturation) hypothesis (Johannes 1978) The basis of the predator satiation hypothesis is that, at spawning aggregations, predators are presented with more potential food (eggs or spawning adults) than they can eat (Johannes 1978, and see Figure 2.5a). The act of pelagic spawning not only exposes the released eggs to predators, but also the spawners themselves. The spawning rush typical of pelagic spawners takes individuals away from the relative safety of the reef. Predation on many reef fish has been observed almost exclusively during spawning activities activities (Tribble 1982, Thresher 1984, Moyer 1987, Sancho 2000, Sancho et al. 2000a). The selective advantage is not in when and where the spawning occurs, but in the synchrony of the spawning. Such reproductive synchrony is widespread amongst animal taxa, with evidence of predator satiation documented for cicadas (Williams et al. 1993) and for olive ridley turtles (Eckrich & Owens 1995). However, no studies have been undertaken to test this hypothesis specifically for spawning aggregations of fish. Satiation is a reportedly uncommon phenomenon in piscivorous fish (Essington et al. 2000). It would also seem unlikely for planktivores, a functional group that spends the majority of its daily activity feeding, to become satiated even when feeding on a possibly more.
(35) 35 nutritious and abundant food source of spawned eggs. Predation rates have been measured at spawning aggregation sites, but usually in the absence of control measurements: the predation rates on adults and on eggs spawned outside of spawning aggregations have not been compared to that found within spawning aggregations. From what little information there is, the reported role of predation (piscivory and egg predation) at spawning aggregation sites ranges from being substantial (Thresher 1984, Moyer 1987) to insignificant (Johannes et al. 1999). (a). (b). % prey consumed. Probability of being preyed upon per indiviudal or clutch. 100. 0. x. Prey density. Predators disproportionately attracted to aggregations. Predator : prey ratio constant Number of predators constant. Prey density. Figure 2.5. (a) The predator satiation hypothesis: the relationship between prey density and the percentage of the prey population that will be consumed. Predators become satiated having consumed x prey. (b) The probability of prey (spawning fish or pelagically released egg) being preyed upon, with increasing prey density for three different predatory scenarios: number of predators constant (full line), predator:prey ratio constant (dashed line), and predators disproportionately attracted to spawning aggregations (dotted line). For all scenarios predators never become satiated.. Whether predators become satiated or not, synchronised spawning can still reduce predation pressure. With a finite number of predators, the greater the number of eggs the less impacted any one clutch is, and the greater the number of spawning adults the less probability there is of any one adult being preyed upon (Johannes 1978). The predation rate of a piscivorous or planktivorous predator will be limited by its handling time (sensu Holling 1959), and follow a type II functional response. Predation rate will asymptote causing an increase in potential prey to reduce the probability of any one prey item being preyed upon (see Figure 2.5b). Any degree of satiation will serve to reduce this.
(36) 36 probability of being preyed upon even further. However, this is a simplistic view that does not account for the fact that the aggregative phenomenon may attract more predators per individual prey than if spawning were to occur in smaller groups or discrete pairs (Randall & Randall 1963, Robertson 1983, Moyer 1987, and see Figure 2.5b).. The synchrony of spawning aggregations can be striking. Fish often spend lengthy periods in aggregations prior to spawning. Once the first spawn occurs, this acts as a trigger for the rest of the aggregation and a rapid sequence of spawning may ensue. The intensity of spawning within a tight time frame reduces the ability of predators to exploit their prey (eggs and spawning fish) even further.. Population structure and social interaction Aggregative spawning may be important to the social structure of the fish population in question in a number of ways. Firstly, fish living in usually disperse populations, such as commercially important piscivores (e.g. Epinephelus striatus) may find locating a mate difficult in the absence of a spawning aggregation. Secondly, the formation of spawning aggregations gives individuals a greater degree of mate selectivity than would be afforded to them if aggregations were not formed. Thirdly, aggregative spawning in disperse populations gives individuals an opportunity to assess the sex ratio of a population. This aggregative social interaction may determine whether individuals change sex accordingly (Shapiro et al. 1993). Without such aggregations, decisions concerning sex change may be made inappropriately. However, it is not known whether disperse populations of aggregative and non-aggregative spawners differ due to the latter's lack of social interaction. Comparisons such as this have not been conducted.. 2.6.2 Hypotheses explaining the location and timing of spawning aggregations: Predator evasion hypothesis (Shapiro et al. 1988) The predator evasion hypothesis predicts that spawning sites and times afford the spawning adults better protection from predators (Shapiro et al. 1988). Predators are.
(37) 37 likely to be attracted to spawning aggregations for two reasons: firstly, spawning aggregations represent high concentrations of prey fish, and secondly, the spawning rush associated with many pelagic spawners takes the prey fish up into the water column and away from the relative safety of the reef, leaving them more exposed to predators. The spawning rush up into the water column is also accompanied by an equally or more rapid rush back to the shelter of the reef immediately following gamete release (Robertson & Hoffman 1977). Because pelagic spawning increases exposure to predators, one would expect to find spawning aggregations at sites where predators are absent, and where the reef affords spawners greater protection from predators. There is some evidence that the more weary the species, the greater the potential shelter of the habitat over which it spawns (Beets & Friedlander 1992, Johannes et al. 1999). However, there is no evidence that predation is less efficient at spawning aggregation sites, nor that these sites have lower densities of predators. Although no studies have explicitly investigated this, predation appears to be enhanced at spawning aggregation sites rather than reduced (Robertson 1983, Sancho 2000, Sancho et al. 2000a).. Whilst Domeier and Colin (1997) state that spawners are keenly aware of their surroundings, it is clear that some species are not weary at all, and it is widely reported that these aggregative spawners go into spawning “stupor” (Johannes 1981). In this state, spawning fish are less likely to flee from predators (and from spear guns), and thus the potential shelter from predation afforded by the benthos may never be used by some species. Sharks have been observed feeding freely on a spawning aggregation of acanthurids without disturbing the spawners from their “stupor” (Robertson 1983).. Predator evasion may also be a key factor in dictating what time of day fish spawn. Theoretically, fish should spawn at optimum times when the balance between piscivory and egg predation pressure is least detrimental to fitness, because piscivory is greatest at lower light levels (Hobson 1974, 1975, Danilowicz & Sale 1999), and egg predation is greatest at higher light levels (Hobson & Chess 1978). Optimal spawning time is mediated by the size of the species in question, because the smaller the species the higher the predation pressure. Smaller fish are more likely to spawn at times when predators are.
(38) 38 least active, and thus at times of higher light levels (Hobson 1974, 1975, Danilowicz & Sale 1999). However, potential egg predators (planktivorous fish) are most active at higher light levels. With the risk of predation being inversely proportional to size, only larger species are able to avoid high egg predation by spawning at times of lower light levels with higher predatory activity. These factors should lead to a negative correlation between size of fish and light intensity at time of spawning. This correlation has been observed at some, but not all locations (Kuwamura 1981). However, the degree of iteroparity of the species in question may also mediate this relationship. The more times an individual reproduces during its lifetime, the less likely it is to jeopardise future reproductive success by reproducing when the risk of predation is high (Mertz 1971, Schaffer 1974, Stearns 1976, 1992, Warner 1998).. Egg predation hypothesis (Johannes 1978, Lobel 1978) The egg predation hypothesis predicts that adults aggregate to spawn at sites and times that reduce the loss of eggs to predators. This includes sites at down-current areas where eggs are rapidly transported off the reef into deeper water and thus out of the reach of reef associated fishes and invertebrates (Robertson & Hoffman 1977, Johannes 1978, Lobel 1978). This model predicts that the location and timing of spawning aggregation sites coincide with currents that best sweep eggs off the reef. Evidence for this is not equivocal (Shapiro et al. 1988). It is widely perceived that spawning aggregations are found on promontories, and in association with off-reef currents. However, for the most part, this perception is unsubstantiated (see Table 2.2 and Domeier et al. 2002) and the efficacy of egg transport away from reefs is largely anecdotal (Robertson 1983, Thresher & Brothers 1985, Bell & Colin 1986, Moyer 1989, Colin & Bell 1991), and relatively few spawning aggregations are recorded as forming on the down-current margins of reefs (see Table 2.2). In order to investigate this systematically, the rate of egg transport has to be measured at spawning and non-spawning sites at times of spawning activity and of no such activity. This approach would enable valid conclusions as to whether the spawning location and timing actually represents the optimum as far as current driven egg removal is concerned..
(39) 39. Additionally, the dynamics of egg predation are poorly understood, and there is no evidence that egg predation is less at theoretically optimal sites (e.g. reef promontories with an off-reef current). Most studies assume that all planktivores are potential egg predators, but this may not apply to smaller species, and there are at least three different forms of egg predation. Firstly, eggs will be consumed by all planktivores that come into contact with them during their normal planktivorous activity. Although many of these species may be in close proximity and within sight of spawning events, their behaviour is largely unchanged by spawning, and do not actively seek out recently spawned eggs (pers. obs.). Secondly, there are species that specifically target the apex of a spawning rush, anticipating the release of gametes and feeding intensively in the short period before the gamete cloud has dispersed and eggs are no longer efficiently located (e.g. Melichthys vidua, Sancho et al. 2000a). Finally, there are species such as the Indian mackerel (Rastrelliger kanagurta), the manta ray (Manta birostris) and the whale shark (Rhinchodon typus) that also target gamete clouds, but are able to feed more efficiently on the gametes due to their filter-feeding habit, swimming in tight circles with their mouths wide open (Colin 1976, Debelius 2000, Heyman et al. 2001). They are able to feed in this fashion for longer periods than the other target egg predators because visual location of individual eggs is not a prerequisite to feeding. Although filter-feeding individuals have the potential to consume the most eggs, the relative loss of eggs to each mode of predation is unknown, and would be hard to quantify.. One would expect pelagic spawning to occur at sites and times of reduced planktivorous activity. This is assumed to be at times of lower light levels when visual procurement of food becomes poor, and when the risk of predation on the planktivores is high. Significantly greater rates of predation on planktonic fish eggs have been reported during the daytime despite these eggs being more abundant at night (Hobson & Chess 1978). Some of the large serranids forming spawning aggregations are known to spawn between dusk and dawn (Colin 1992, Samoilys & Squire 1994, Rhodes & Sadovy 2002), and thus at times of reduced egg predation. The increased risk of predation accompanying lower.
(40) 40 light levels (Hobson 1974, 1975) may prevent smaller species from also spawning at these times.. The egg dispersal hypothesis (Barlow 1981) versus the larval retention hypothesis (Johannes 1978, Lobel 1978, Lobel & Robinson 1988) According to the egg dispersal hypothesis, spawning sites and times are expected to be synchronised with currents that disperse eggs and larvae further distances. This long distance dispersal is believed to increase the probability of survival as, once hatched, the larvae are more likely to find a reef upon which to settle (Barlow 1981). This is directly opposed to the larval retention hypothesis which argues that eggs are released at sites and times of favourable currents so that resultant larvae are more likely to return to their natal reefs (Johannes 1978, Lobel 1978, Lobel & Robinson 1988b). Studies that support the egg dispersal hypothesis have measured current patterns on a very broad scale (e.g. Roberts 1997). This approach is likely to be flawed. When eggs are released at a spawning site, these eggs become passively transported plankton in the local currents of that reef. The eggs will not be affected by the oceanic currents until they drift into them, which may never happen. Long distance transport of eggs and larvae may occur but this dispersal will not necessarily increase offspring survival.. Although only one study has directly demonstrated self-recruitment of reef fish (Jones et al. 1999), there is a large body of indirect support for the existence of self-recruiting populations of fish. Jones et al. (1999) listed five such lines of evidence: (1) genetic subdivision of some marine species (Bell et al. 1982, Planes 1993); (2) the persistence of endemic species with pelagic larvae on small isolated islands which must, by definition, be self-recruiting populations (Hourigan & Reese 1987); (3) the persistence of new populations established from marine introductions (Baltz 1991); (4) the persistence of populations with no upcurrent source (Schultz & Cowen 1994), and (5) the behaviour of larvae in the vicinity of reefs (Stobutzki & Bellwood 1994, Doherty & Carleton 1997, Leis & Carsonewart 1997, Stobutzki 1997, Stobutzki & Bellwood 1997, Stobutzki 1998, Stobutzki & Bellwood 1998)..
(41) 41. The fact that larvae may return to their natal reefs is not conclusive support for the larval retention hypothesis. A greater percentage of surviving larvae may have returned to the reef if they had been spawned from a “superior” location or time. However, there is considerable circumstantial evidence. Albeit not well documented in the literature, it is often asserted that spawning aggregations are found on the lee of reefs. This is usually accompanied by some form of eddy or gyre off the leeward margin of the reef. Such areas are believed to be favoured as reef fish spawning locations (Hattori 1970). Theoretically, these gyres have the potential to retain planktonic eggs close to the reef, yet away from reef dwelling predators. However, the ability of these gyres to retain planktonic eggs is largely anecdotal. The most convincing of these anecdotes is a report that blood from injured Second World War troops remained undispersed for days off the leeward tip of Pelelieu, Palau (Johannes 1978). This becomes even more compelling in the context of egg and larvae retention because local fishermen report that a well established spawning aggregation site exists upcurrent to where the blood was retained (Emery 1972, Johannes 1978). Retention of drogues within Exuma Sound, Bahamas, illustrated the potential of local egg retention (Colin 1995), but did not illustrate that there were superior sites when or times where eggs should be released.. A wide range of animals migrate up-current to spawn which is believed to be an adaptation that offsets the current driven dispersal of eggs and larvae away from adult habitat and therefore helps to close these animals’ life cycles (Sinclair 1988). However, up-current migration is not a well documented phenomenon for aggregatively spawning coral reef fish, with the opposite, down-current migration, well known for Thalassoma bifasciatum (Warner 1995), and acanthurids in general (Randall 1961b, Johannes 1981, Robertson 1983, Craig 1998), with both up-current and down-current migration to spawning aggregations reported for Epinephelus striatus (Colin 1992).. With increasing research into the swimming capabilities of different stages of larvae, it is becoming evident that currents will have the greatest effect on dispersal during the egg and early larval stages of the fish (Stobutzki & Bellwood 1994, Leis & Carsonewart.
(42) 42 1997, Stobutzki 1997, Stobutzki & Bellwood 1997, Stobutzki 1998, Stobutzki & Bellwood 1998). Thus currents may only play a significant role in dispersal or retention during a relatively small temporal window.. Pelagic survival hypothesis (Doherty et al. 1985) Doherty et al. (1985) argued that dispersal increases the chances of larvae finding resources, food or otherwise, in a patchy environment. This hypothesis has been adapted to explain the location and timing of spawning aggregations (Shapiro et al. 1988, Appeldoorn et al. 1994, Sadovy 1996, Domeier & Colin 1997). From a computer simulation, Doherty et al. (1985) concluded that dispersal by passively drifting enhanced larval survival. In a patchy environment, movement will increase an organism's chances of finding needed resources, but for reef fish larvae, where these resources are planktonic, passive movement by drifting in the plankton will not increase an organism's chances of finding these resources, regardless of the strength of the current. Albeit an oversimplification of the pelagic larval environment, in this context, passive drifting is equivalent to a terrestrial animal remaining stationary. Active larval swimming will enhance their encounter rate with needed resources. The direction of this movement is irrelevant, and could represent larval retention to rather than dispersal from the natal reef, if swimming is against the current. The site and time of spawning will have no effect on a larva's ability to encounter resources because the selective advantage lies in larval swimming, and not in current driven movement.. In order to maximise the chances that some offspring will encounter suitable larval habitat, one would expect pelagic spawners to spread the release of eggs over as broad a temporal window as possible. Some reef fish spawn daily in aggregations (e.g. Thalassoma bifasciatum and Ctenochaetus striatus, see Domeier & Colin 1997), which may enhance larval survival in this fashion, but within the day spawning occurs over a short time window. Many other reef fish spawn in with lunar periodicity during a limited season (e.g. Plectropomus leopardus and Epinephelus striatus), and this limited periodicity does not appear to enhance larval survival in the manner described above..
Figure
+7


Related documents
In this article, we have interpreted populism as a set of performative practices which serve to mobilise public opinion towards particular populist political projects in the context
VERIS Vocabulary for Event Recording and Incident Sharing VEXWM Vulnerability and Exploit eXtensible Weighting Metric XACML eXtensible Access Control Markup Language..
Excellent 4 chkkl ck: WOODMIST FINE GOLDEN SUNLIGHT (Sheldon Space Joker – Woodmist Fine Golden Moonlight) uppf/äg.. Very good
This difference between both the groups was statistically significant p <0.05, suggesting that the latency period was longer in the group of pregnant women
This is the first crystal- lographically characterized oxazoline-derived palladacycle with a six-membered chelate ring, but activation of a benzylic C sp 3 atom to form a
Two Mediterranean Auchenorrhyncha species, the planthopper Latilica maculipes (Melichar, 1906) and the leafhopper Synophropsis lauri (Horváth, 1897) are reported for
heifers marketed over the 2001 through 2004 period, we regressed average heifer weight of the pen, heifer breed, siring method for the pen, expected calving period for the
In this study, 58,166 patients attended Trauma unit, Assiut University Hospit- als (Single Tertiary Hospital) between January 2010 to December 2017 and among them 3% (n = 1745)
