R E S E A R C H A R T I C L E
Open Access
Excess pneumonia and influenza mortality
attributable to seasonal influenza in
subtropical Shanghai, China
Xinchun Yu
1†, Chunfang Wang
2†, Tao Chen
3†, Wenyi Zhang
4, Huiting Yu
2, Yuelong Shu
3,5, Wenbiao Hu
6,7*and Xiling Wang
1,8*Abstract
Background:Disease burden attributable to influenza is substantial in subtropical regions. Our study aims to estimate excess pneumonia and influenza (P&I) mortality associated with influenza by subtypes/lineages in Shanghai, China, 2010–2015.
Methods:Quasi-Poisson regression models were fitted to weekly numbers of deaths from causes coded as P&I for Shanghai general and registered population. Three proxies for influenza activity were respectively used as an explanatory variable. Long-term trend, seasonal trend and absolute humidity were adjusted for as confounding factors. The outcome measurements of excess P&I mortality associated with influenza subtypes/lineages were derived by subtracting the baseline mortality from fitted mortality.
Results:Excess P&I mortality associated with influenza were 0.22, 0.30, and 0.23 per 100,000 population for three different proxies in Shanghai general population, lower than those in registered population (0.34, 0.48, and 0.36 per 100,000 population). Influenza B (Victoria) lineage did not contribute to excess P&I mortality (P= 0.206) while influenza B (Yamagata) lineage did (P =0.044). Influenza-associated P&I mortality was high in the elderly population.
Conclusions:Seasonal influenza A virus had a higher P&I mortality than influenza B virus, while B (Yamagata) lineage is the dominant lineage attributable to P&I mortality.
Keywords:Influenza, Excess mortality, Quasi-Poisson modelm, Influenza-like illness
Background
Seasonal influenza viruses circulate worldwide and cause severe illnesses and deaths every year [1, 2]. According to the World Health Organization (WHO), influenza can cause 3–5 million severe illnesses and 250,000 to 500,000 excess deaths every year [3]. In China, influenza cause hundreds of thousands of excess deaths every year [4]. Reliable quantification of disease burden of influenza is of key importance for policy-makers to properly allocate scarce medical resources.
However, quantification of disease burden of influenza remains challenging since it is difficult to differentiate influenza from illnesses caused by other respiratory pathogens based on non-specific clinical manifestations [5, 6]. Besides, current laboratory approaches have dem-onstrated limited capacity [7–9] and older people are likely to die from influenza-related complications [10], which may both lead to under-reporting. Statistical mod-eling provides an alternative in estimating disease bur-den of influenza [11], among which times series models have been widely used [12–14]. Quasi-Poisson regression modeling has been widely used to provide estimates of influenza disease burden by incorporating influenza sur-veillance data. The rationale of Quasi-Poisson model is based on influenza-associated excess mortality, defined as the difference between fitted number and baseline number by setting influenza proxy variable(s) to zero [8]. * Correspondence:w2.hu@qut.edu.au;erinwang@fudan.edu.cn
†Equal contributors
6School of Public Health and Social Work, Queensland University of
Technology, Kelvin Grove, Brisbane, QLD 4059, Australia
1Department of Biostatistics, School of Public Health, Fudan University, Key
Laboratory of Public Health Safety, Ministry of Education, 200231 Xuhui District, Shanghai, China
Full list of author information is available at the end of the article
Different research groups have used different influenza proxies developed from influenza surveillance data to estimate influenza-associated disease burden, while dif-ferent influenza proxies might lead to difdif-ferent estimates for excess mortality [15]. In addition, although great dis-ease burden of influenza was revealed in the subtropical regions of China [16], the disease burden associated with influenza B by lineages has not been well explored. The “floating population”, a group of migrants without local household registration status (hukou), has attracted growing attention in China [17]. It has been reported that the floating population and the general population were at different risks for some infectious diseases and might have different health behaviors due to social and economic factors [18, 19]. However, the gap in influenza-associated mortality between floating population and registered residents has not been assessed.
In this study, we chose three commonly used proxy variables (the weekly positive numbers/proportions of laboratory-confirmed influenza, and the product of weekly proportion and influenza-like illness consult-ation rate (LAB × ILI)) to estimate excess pneumonia and influenza (P&I) mortality attributable to influenza A subtypes and B lineages in the general and registered population in Shanghai, China from 2010 to 2015.
Methods
Data
Shanghai is in East China and has a subtropical climate with four distinct seasons. Weekly numbers of deaths with causes of death coded as P&I (International Classi-fication of Diseases, Tenth Revision (ICD10) J09-J18) [20] from 2010 to 2015 were retrieved from Shanghai Center for Disease Control and Prevention (SCDC). Deaths in the general population of Shanghai and regis-tered Shanghai residents were included. The annual population data were obtained from the household registration department of Shanghai Municipal Bureau of Public Security (http://www.stats.gov.cn/english/Sta tisticaldata/AnnualData/). The residing population of Shanghai can be sub-classified into two main groups, the Shanghai registered residents who permanently reside in Shanghai and have hukou (registration status), and those who might live for several months or years, i.e. non-registered temporary migrants with an alias as the “floating population”[21].
Influenza surveillance data were collected from National Influenza Center, China Center for Disease Control and Prevention (China CDC), including weekly numbers of specimens tested positive for influenza A(H1N1), enza A(H3N2), influenza B (Victoria) lineage and influ-enza B (Yamagata) lineage, as well as the numbers of weekly specimens tested in total. Clinical ILI surveillance data consisted of weekly total outpatient visits and weekly
numbers of ILI consultations. The definition of ILI was body temperature≥38°Cwith either sore throat or cough, without an alternative diagnosis [8]. The influenza sur-veillance protocol in Shanghai was in accord with the national influenza surveillance protocol and has been stated elsewhere [22].
Meteorological data for the years 2010–2015, including temperature and dew point temperature, were obtained from the China Meteorological Administration (CMA), which was an open-access website providing nationwide meteorological data (http://www.cma.gov.cn/en2014/). We aggregated hourly data into weekly mean temperature and weekly mean dew point temperature. We derived weekly absolute humidity by combing temperature and dewpoint temperature. Monday was regarded as the beginning of a week [23]. This study used aggregated data without per-sonal information, so did not require ethical approval.
Statistical analysis
The sampling of respiratory specimens was gradually en-hanced, with the total specimens tested in 2015 nearly doubled the number in 2011. To reduce the impact of changing sampling behavior, our study considered three different proxies for influenza activity, including weekly positive numbers/proportions of lab-confirmed influ-enza, and LAB × ILI. These proxies represented the activity of influenza viruses [15]. Generalized additive models with the three proxies were used to fit weekly deaths coded as P&I in Shanghai general and registered population from 2010 to 2015, respectively. We adjusted for the confounding factors of long-term trend and seasonal trend. We additionally adjusted for absolute hu-midity in our model, as both laboratory and epidemio-logical studies have indicated that absolute humidity modulates influenza virus survival, seasonality and trans-mission [24]. The full model is as follows:
f
YtquasiPoissonðμt;φμtÞlogð Þ ¼μt β0þβ1ðH1Þt−iþβ2ðH3Þt−iþβ3ðBVÞt−i þβ4ðBYÞt−iþs tð;df ¼36Þ þs AHð t;df ¼3Þ
f
YtquasiPoissonðμt;φμtÞlogð Þ ¼μt β0þβ1ðLABH1Þt−iþβ2ðLABH3Þt−iþβ3ðLABBVÞt−i þβ4ðLABBYÞt−iþs t;ð df ¼36Þ þs AHð t;df ¼3Þ
f
YtquasiPoissonðμt;φμtÞlogð Þ ¼μt β0þβ1ðLABH1ILIÞt−iþβ2ðLABH3ILIÞt−i þβ3ðLABBVILIÞt−iþβ4ðLABBYILIÞt−i þs tð;df ¼36Þ þs AHð t;df ¼3Þ
for influenza A (H1N1), A (H3N2), B (Victoria) and B (Yamagata) viruses at week t−i; i denotes the lag time between influenza infection and P&I deaths, which varied from 0 to 2 weeks in this study.s(t, df = 3 × 6)is the natural cubic spline of time with 3 degrees of freedom per year.
s(AHt, df = 3)is the natural cubic spline of absolute
humid-ity to adjust for non-linear association between absolute humidity and deaths. (LABH1)t−i, (LABH3)t−i, (LABBV)t−i,
(LABBY)t−i denote the second proxy, i.e. weekly positive proportions of lab-confirmed influenza, for influenza A (H1N1), A (H3N2), B (Victoria) and B (Yamagata) viruses at week t-i; and (LABH1)t−i × ILI, (LABH3)t−i × ILI,
(LABBV)t−i× ILI, (LABBY)t−i × ILIdenote the third proxy, i.e. the product of weekly rate of ILI and positive proportion of lab-confirmed influenza, for influenza A (H1N1), A (H3N2), B (Victoria) and B (Yamagata) viruses at weekt-i. We conducted stratification analysis by classifying the P&I deaths into two age groups of <60 and≥60 years. Deviance explained by models were considered as the goodness-of-fit index. Autocorrelation in the model residuals were checked by plotting autocorrelation function and partial autocorrelation function of model residuals.
The outcome measurements were excess P&I mortal-ity rates associated with influenza type/subtypes, which was defined as the difference between the fitted number of deaths from the Quasi-Poisson model and the num-ber of baseline deaths. Baseline deaths were obtained by setting the coefficients of influenza subtypes/lineages proxy variables to zero while keeping the other covariates
unchanged, assuming there were no influenza subtypes/leages circulating. Excess mortality rate associated with in-fluenza subtypes/lineages were calculated by dividing the excess number to the general population size or registered population size, respectively. The 95% confidence intervals (CI) for excess mortality were obtained by bootstrapping the residuals 1000 times and refitting the Quasi-Poisson model. Analyses were conducted up to 2 weeks considering the lag effect of influenza on P&I mortality [8].
Results
Descriptive statistics
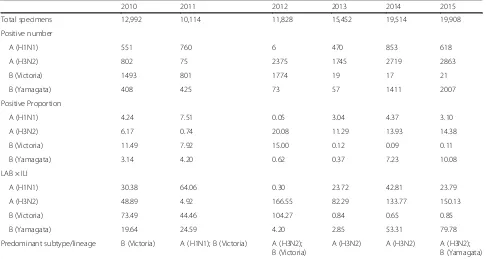
A total of 89,808 specimens were collected and tested for in-fluenza infection during the years 2010–2015, among which 3258 were positive for influenza A (H1N1), 10,579 for influ-enza A (H3N2), 4125 for influinflu-enza B (Victoria) and 4381 for influenza B (Yamagata). The predominant virus was influ-enza B (Victoria) lineage in the year 2010. The predominant viruses were influenza B (Victoria) lineage and influenza A (H1N1) virus in the year 2011, while the latter shifted to in-fluenza A (H3N2) in the subsequent years 2013 and 2014. The predominant viruses in the year 2015 were influenza A (H3N2) virus and influenza B (Yamagata) lineage (Table 1).
[image:3.595.56.542.463.722.2]Influenza A (H1N1) virus was active at the beginning of the years 2011, 2013, and 2014 (Fig. 1). Influenza A (H3N2) virus was more active than influenza A (H1N1) virus, which had one or two peaks in all years except 2011 (Fig. 1). In general, influenza A (H3N2) had a higher winter peak than its summer peak. Influenza B
Table 1Annual summary of influenza activity in Shanghai, China from 2010 to 2015
2010 2011 2012 2013 2014 2015
Total specimens 12,992 10,114 11,828 15,452 19,514 19,908
Positive number
A (H1N1) 551 760 6 470 853 618
A (H3N2) 802 75 2375 1745 2719 2863
B (Victoria) 1493 801 1774 19 17 21
B (Yamagata) 408 425 73 57 1411 2007
Positive Proportion
A (H1N1) 4.24 7.51 0.05 3.04 4.37 3.10
A (H3N2) 6.17 0.74 20.08 11.29 13.93 14.38
B (Victoria) 11.49 7.92 15.00 0.12 0.09 0.11
B (Yamagata) 3.14 4.20 0.62 0.37 7.23 10.08
LAB × ILI
A (H1N1) 30.38 64.06 0.30 23.72 42.81 23.79
A (H3N2) 48.89 4.92 166.55 82.29 133.77 150.13
B (Victoria) 73.49 44.46 104.27 0.84 0.65 0.85
B (Yamagata) 19.64 24.59 4.20 2.85 53.31 79.78
Predominant subtype/lineage B (Victoria) A (H1N1); B (Victoria) A (H3N2); B (Victoria)
A (H3N2) A (H3N2) A (H3N2);
B (Yamagata)
(Victoria) virus had only one observable peak in the winter of 2012 while influenza B (Yamagata) virus had two observable peaks in the beginning of 2014 and the beginning of 2015 (Fig. 1).
Excess mortality associated with influenza by subtypes/ lineages
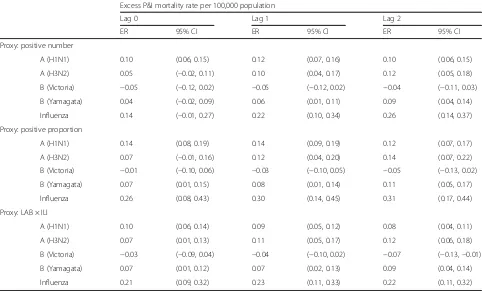
The quasi-Poisson models generally well fitted the weekly numbers of P&I deaths. An example of the model fit was shown in Fig. 2. Goodness-of-fit statistics and autocorrel-ation of residuals were presented in Additional file 1. The P&I mortality rate attributable to influenza ranged from 0.14 to 0.31 per 100,000 population. Excess P&I mortality rates were comparable for influenza A subtypes. However, the mortality rate associated with influenza A (H3N2) increased as the lag time between influenza infection and P&I mortality increased. On the other hand, the mor-tality rate associated with influenza A (H1N1) generally decreased as the lag time increased (Table 2). Com-pared with influenza A viruses, influenza B viruses showed more moderate mortality burden. One interesting result
was that the rate for influenza B (Yamagata) lineage was much higher than that for influenza B (Victoria) lineage (Table 2). In fact, influenza B (Victoria) lineage did not con-tribute to the estimated excess P&I mortality (P= 0.206) while influenza B (Yamagata) lineage was statistically significant (P= 0.044).
Excess mortality for three influenza proxies
The influenza-associated P&I mortality rates for the weekly positive numbers/proportions and LAB × ILI were 0.22, 0.30, and 0.23 per 100,000 persons, respectively at lag 1 week. The excess mortality rate using weekly positive numbers was 4.3% lower than that for LAB × ILI, while the excess mortality rate for the weekly positive proportions was 0.05–0.09 higher than that for LAB × ILI (Table 2).
Excess mortality for registered population
Excess P&I mortality rate associated with influenza using the weekly positive numbers/proportions and LAB × ILI
Fig. 1Influenza activity in Shanghai, China from 2010 to 2015.a
positive number;bpositive proportion;cpositive
proportion × influenza-like illness Fig. 2An example of model fit (lag 1 analysis) for deaths coded as
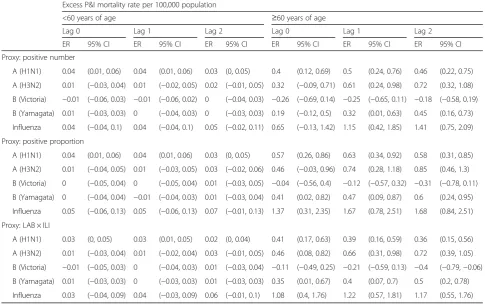
[image:4.595.56.294.87.423.2] [image:4.595.309.540.88.448.2]were 0.34, 0.48, and 0.36 per 100,000 persons, respectively (Table 3). Compared with the excess mortality rate for the general population, the excess mortality rate for the regis-tered Shanghai residents was 36.1% higher. The severity order for influenza subtypes/lineages was likely to be influenza A (H3N2) virus, influenza A (H1N1) virus, and influenza B (Yamagata) lineage. Age-stratified analysis re-vealed that influenza-associated P&I mortality rates were more than 10-fold higher in the elderly over 60 years of age than whose younger than 60 years of age (Table 4).
Discussion
Our estimate for excess P&I mortality rate associated with influenza (0.23 per 100,000 persons) in Shanghai was lower than estimates from other countries, including Australia, New Zealand, Italy, and Singapore [25–28]. In China, our estimate for Shanghai was comparable with that for Hefei city [23], while lower than that for Guangzhou [16], Dalian, Qingdao, and Zhaoyuan cities [4]. In this study, the severity order for influenza sub-types/lineages was likely to be influenza A (H3N2) virus, influenza A (H1N1) virus, and influenza B (Yamagata) virus using LAB × ILI as the proxy, which was the same to that of German and Italy [29, 30]. The excess P&I mortality rate associated with influenza A (H3N2) in this
[image:5.595.57.539.111.402.2]study was 10.5% and 0.7% of that for Italy and German [27, 30], while comparable with that for Hefei [23]. Dif-ferences in the quality of the viral surveillance and death surveillance, as well as socio-economic levels, healthcare systems, population immunity and meteorological condi-tions, may interact together explain the difference of dis-ease burden estimates in China and other countries [31]. One of our most interesting findings was that excess P&I mortality rate associated with influenza B were pre-dominantly attributable to influenza B (Yamagata) virus, while no significant relationships between the other lineage influenza B (Victoria) and excess mortality were found [32, 33]. The WHO has recommended the inclu-sion of B Victoria lineage for seasons from 2009 to 12 while recommended influenza B Yamagata lineage for seasons from 2012 to 16 in the trivalent inactivated influenza vaccine for Northern Hemisphere [34]. The influenza B lineages in the vaccine composition well matched the circulating influenza B lineages in Shanghai. However, as influenza vaccine is not included in the na-tional immunization program, the coverage of influenza vaccine was very low in China, including Shanghai. The encourage of influenza vaccine uptake in Shanghai residents may help to reduce the burden of influenza, especially when influenza B (Yamagata) lineage attacks. Table 2Excess pneumonia and influenza mortality rate associated with influenza subtypes/lineages using different influenza proxies
in Shanghai general population, 2010–2015
Excess P&I mortality rate per 100,000 population
Lag 0 Lag 1 Lag 2
ER 95% CI ER 95% CI ER 95% CI
Proxy: positive number
A (H1N1) 0.10 (0.06, 0.15) 0.12 (0.07, 0.16) 0.10 (0.06, 0.15)
A (H3N2) 0.05 (−0.02, 0.11) 0.10 (0.04, 0.17) 0.12 (0.05, 0.18)
B (Victoria) −0.05 (−0.12, 0.02) −0.05 (−0.12, 0.02) −0.04 (−0.11, 0.03)
B (Yamagata) 0.04 (−0.02, 0.09) 0.06 (0.01, 0.11) 0.09 (0.04, 0.14)
Influenza 0.14 (−0.01, 0.27) 0.22 (0.10, 0.34) 0.26 (0.14, 0.37)
Proxy: positive proportion
A (H1N1) 0.14 (0.08, 0.19) 0.14 (0.09, 0.19) 0.12 (0.07, 0.17)
A (H3N2) 0.07 (−0.01, 0.16) 0.12 (0.04, 0.20) 0.14 (0.07, 0.22)
B (Victoria) −0.01 (−0.10, 0.06) −0.03 (−0.10, 0.05) −0.05 (−0.13, 0.02)
B (Yamagata) 0.07 (0.01, 0.15) 0.08 (0.01, 0.14) 0.11 (0.05, 0.17)
Influenza 0.26 (0.08, 0.43) 0.30 (0.14, 0.45) 0.31 (0.17, 0.44)
Proxy: LAB × ILI
A (H1N1) 0.10 (0.06, 0.14) 0.09 (0.05, 0.12) 0.08 (0.04, 0.11)
A (H3N2) 0.07 (0.01, 0.13) 0.11 (0.05, 0.17) 0.12 (0.06, 0.18)
B (Victoria) −0.03 (−0.09, 0.04) −0.04 (−0.10, 0.02) −0.07 (−0.13,−0.01)
B (Yamagata) 0.07 (0.01, 0.12) 0.07 (0.02, 0.13) 0.09 (0.04, 0.14)
Influenza 0.21 (0.09, 0.32) 0.23 (0.11, 0.33) 0.22 (0.11, 0.32)
Another interesting finding was that the perfor-mances of different influenza proxies were generally similar with moderate differences. The excess mor-tality rate fitted using weekly positive proportions of laboratory-confirmed influenza was 0.05–0.12 and 0.05–0.09 higher than those fitted using weekly posi-tive numbers of laboratory-confirmed influenza and LAB × ILI, respectively, while the latter two results were comparable. To our knowledge, LAB × ILI may be more closely related to influenza incidence than positive numbers/proportions of laboratory-confirmed influenza [35]. Excess mortality rate estimated using the positive numbers/proportions of laboratory-confirmed influenza tend to be under-estimated because respiratory samples are often selected for viral testing on the basis of severity of ILI symptoms [8]. According to a previous study, the performance of positive numbers of laboratory-confirmed influenza has a slightly lower bias than the positive pro-portions of laboratory-confirmed influenza [35]. In gen-eral, the Quasi-Poisson models using different influenza proxies provided similar estimates for the excess P&I mortality rate associated with influenza. Further studies are needed to fully compare the performance of these three influenza activity proxies.
[image:6.595.57.539.111.402.2]The influenza-associated P&I excess mortality rate for the registered Shanghai population was higher than that for the general population in Shanghai. Possible reasons are: (1) over 80% of temporary migrants in Shanghai were constituted of young and middle-aged labor force while seniors over 60 years old only accounted for 3%, who were the high-risk group for influenza [36]. How-ever, the proportion of seniors among Shanghai regis-tered population has exceeded 20% by the year 2009 [37]; (2) many temporary migrants in Shanghai were generally not willing to go to hospitals because they could not afford healthcare, even if they did catch influ-enza; and (3) a proportion of the temporary migrants in Shanghai might go back to their places of origin when death was approaching because of Chinese tradition, which in turn led to under-reporting of the number of deaths. These findings have important implications for Shanghai’s strategies to prevent and control influenza. First, there may be a need to strengthen vaccination in the elderly population and children of the registered Shanghai residents. Second, further studies need to be done to investigate the influenza-associated excess mor-tality in the age groups of 0–4 and≥65 years old. Third, influenza surveillance among the “floating population” Table 3Excess pneumonia and influenza mortality rate associated with influenza subtypes/lineages using different influenza proxies
in Shanghai registered residents, 2010–2015
Excess P&I mortality rate per 100,000 population
Lag 0 Lag 1 Lag 2
ER 95% CI ER 95% CI ER 95% CI
Proxy: positive number
A (H1N1) 0.14 (0.06, 0.22) 0.16 (0.09, 0.24) 0.14 (0.08, 0.22)
A (H3N2) 0.09 (−0.02, 0.20) 0.17 (0.07, 0.28) 0.21 (0.10, 0.31)
B (Victoria) −0.08 (−0.19, 0.04) −0.07 (−0.19, 0.03) −0.05 (−0.16, 0.05)
B (Yamagata) 0.06 (−0.03, 0.14) 0.09 (0.00, 0.17) 0.12 (0.04, 0.20)
Influenza 0.20 (−0.02, 0.41) 0.34 (0.12, 0.53) 0.41 (0.23, 0.59)
Proxy: positive proportion
A (H1N1) 0.18 (0.09, 0.26) 0.19 (0.11, 0.27) 0.18 (0.10, 0.25)
A (H3N2) 0.13 (0.00, 0.27) 0.21 (0.08, 0.33) 0.25 (0.13, 0.36)
B (Victoria) −0.01 (−0.15, 0.11) −0.03 (−0.16, 0.08) −0.08 (−0.20, 0.04)
B (Yamagata) 0.11 (0.01, 0.23) 0.12 (0.02, 0.22) 0.16 (0.06, 0.25)
Influenza 0.40 (0.12, 0.67) 0.48 (0.24, 0.71) 0.50 (0.27, 0.70)
Proxy: LAB × ILI
A (H1N1) 0.13 (0.06, 0.19) 0.12 (0.06, 0.18) 0.11 (0.05, 0.17)
A (H3N2) 0.13 (0.03, 0.23) 0.19 (0.09, 0.28) 0.21 (0.12, 0.30)
B (Victoria) −0.03 (−0.13, 0.06) −0.06 (−0.15, 0.04) −0.10 (−0.20,−0.01)
B (Yamagata) 0.10 (0.01, 0.19) 0.11 (0.02, 0.20) 0.14 (0.05, 0.22)
Influenza 0.31 (0.12, 0.51) 0.36 (0.17, 0.53) 0.35 (0.19, 0.51)
should be strengthened to reflect the actual disease bur-den attributable to influenza.
Our study used statistical modeling methods to esti-mate he disease burden on influenza with adjustment for environmental confounders of absolute humidity. Several experimental studies have demonstrated that temperature and humidity directly modulated survival and transmission of influenza virus [24, 38]. A con-founder was a common cause of exposure and outcome, thus humidity in our study was a confounder because it was associated with influenza virus survival and human deaths. Humidity was also likely to play a role in the causal pathway for influenza transmission, and the ad-justment of humidity in this case may underestimate the disease burden of influenza. However, it was hard to quantify to what extent the humidity played a role in influenza virus survival and transmission respectively. We therefore adjusted the absolute humidity as a con-founder as previous studies did [23, 39]. We did not add temperature in our model to avoid collinearity problem as the correlation between temperature and absolute humidity was over 0.95 in Shanghai.
Our study has several potential caveats. First, this study only examined P&I mortality due to data access, without
mortality from all-cause death or respiratory and circula-tory system disease (R&C) death, thus not featuring a complete and comprehensive assessment of the impact of influenza on death. Second, the mortality data in this study was retrieved from the SCDC, any omission, misstatement might lead to deviations to result. Third, in addition to the confounding factors adjusted in this study (short-term trends, long-term trends and humidity), there might be other unmeasured factors that would lead to bias.
Conclusions
[image:7.595.55.541.112.416.2]Influenza A (H3N2) appeared to be the most active influ-enza subtype and showed clear winter peak, with a less in-tense summer peak. Compared with influenza A viruses, influenza B viruses showed more moderate mortality bur-den contributed by Yamagata lineage. In general, quasi-Poisson models using different influenza proxies pro-vided similar estimates for the excess P&I mortality rate associated with influenza. Compared with the excess mortality rate for the general population, the excess mortality rate for the registered Shanghai residents was higher. Our findings provide scientific evidence for policy-maker in making preventive and control strategies for influenza epidemics.
Table 4Excess pneumonia and influenza mortality rate associated with influenza subtypes/lineages using different influenza proxies
in registered Shanghai residents in 2010–2015, stratified by age
Excess P&I mortality rate per 100,000 population
<60 years of age ≥60 years of age
Lag 0 Lag 1 Lag 2 Lag 0 Lag 1 Lag 2
ER 95% CI ER 95% CI ER 95% CI ER 95% CI ER 95% CI ER 95% CI
Proxy: positive number
A (H1N1) 0.04 (0.01, 0.06) 0.04 (0.01, 0.06) 0.03 (0, 0.05) 0.4 (0.12, 0.69) 0.5 (0.24, 0.76) 0.46 (0.22, 0.75)
A (H3N2) 0.01 (−0.03, 0.04) 0.01 (−0.02, 0.05) 0.02 (−0.01, 0.05) 0.32 (−0.09, 0.71) 0.61 (0.24, 0.98) 0.72 (0.32, 1.08)
B (Victoria) −0.01 (−0.06, 0.03) −0.01 (−0.06, 0.02) 0 (−0.04, 0.03) −0.26 (−0.69, 0.14) −0.25 (−0.65, 0.11) −0.18 (−0.58, 0.19)
B (Yamagata) 0.01 (−0.03, 0.03) 0 (−0.04, 0.03) 0 (−0.03, 0.03) 0.19 (−0.12, 0.5) 0.32 (0.01, 0.63) 0.45 (0.16, 0.73)
Influenza 0.04 (−0.04, 0.1) 0.04 (−0.04, 0.1) 0.05 (−0.02, 0.11) 0.65 (−0.13, 1.42) 1.15 (0.42, 1.85) 1.41 (0.75, 2.09)
Proxy: positive proportion
A (H1N1) 0.04 (0.01, 0.06) 0.04 (0.01, 0.06) 0.03 (0, 0.05) 0.57 (0.26, 0.86) 0.63 (0.34, 0.92) 0.58 (0.31, 0.85)
A (H3N2) 0.01 (−0.04, 0.05) 0.01 (−0.03, 0.05) 0.03 (−0.02, 0.06) 0.46 (−0.03, 0.96) 0.74 (0.28, 1.18) 0.85 (0.46, 1.3)
B (Victoria) 0 (−0.05, 0.04) 0 (−0.05, 0.04) 0.01 (−0.03, 0.05) −0.04 (−0.56, 0.4) −0.12 (−0.57, 0.32) −0.31 (−0.78, 0.11)
B (Yamagata) 0 (−0.04, 0.04) −0.01 (−0.04, 0.03) 0.01 (−0.03, 0.04) 0.41 (0.02, 0.82) 0.47 (0.09, 0.87) 0.6 (0.24, 0.95)
Influenza 0.05 (−0.06, 0.13) 0.05 (−0.06, 0.13) 0.07 (−0.01, 0.13) 1.37 (0.31, 2.35) 1.67 (0.78, 2.51) 1.68 (0.84, 2.51)
Proxy: LAB × ILI
A (H1N1) 0.03 (0, 0.05) 0.03 (0.01, 0.05) 0.02 (0, 0.04) 0.41 (0.17, 0.63) 0.39 (0.16, 0.59) 0.36 (0.15, 0.56)
A (H3N2) 0.01 (−0.03, 0.04) 0.01 (−0.02, 0.04) 0.03 (−0.01, 0.05) 0.46 (0.08, 0.82) 0.66 (0.31, 0.98) 0.72 (0.39, 1.05)
B (Victoria) −0.01 (−0.05, 0.03) 0 (−0.04, 0.03) 0.01 (−0.03, 0.04) −0.11 (−0.49, 0.25) −0.21 (−0.59, 0.13) −0.4 (−0.79,−0.06)
B (Yamagata) 0.01 (−0.03, 0.03) 0 (−0.03, 0.03) 0.01 (−0.03, 0.03) 0.35 (0.01, 0.67) 0.4 (0.07, 0.7) 0.5 (0.2, 0.78)
Influenza 0.03 (−0.04, 0.09) 0.04 (−0.03, 0.09) 0.06 (−0.01, 0.1) 1.08 (0.4, 1.76) 1.22 (0.57, 1.81) 1.17 (0.55, 1.76)
Additional file
Additional file 1:Goodness-of-fit of models.Table S1.Deviance
explained for models using three different proxy variables for influenza activity;Figure S1.Plots of residual autocorrelation function and partial autocorrelation function of quasi-Poisson models at lag 1 using proxies A) number; B) proportion; C) product of weekly proportion of specimens tested positive for influenza and influenza-like illness consultation rate. (PDF 513 kb)
Acknowledgements
We thank the SCDC for providing the mortality data, the China CDC for providing the influenza surveillance data, the Shanghai Municipal Bureau of Public Security for providing the population data, and the CMA for providing the meteorological data. WH is supported by Australia Research Council future fellowship (FT140101216).
Funding
XLW is supported by the National Nature and Science Foundation of China [grant number 81602936]. The funding sources had no role in the study design, data collection, data analysis, or writing of the report.
Availability of data and materials
The dataset generated and/or analyzed during the current study are not publicly available due to non-disclosure agreements with data providers, but are available from the corresponding author on reasonable request.
Authors’contributions
Conceived and designed the study: WH XW. Collected the data: CW, TC, HY, WZ, YS. Analyzed the data: XY, XW. Wrote the paper: XY, XW, WH. Interpreted the results: WH, XW, WZ, CW, YS. All authors have read and approved the final manuscript.
Ethics approval and consent to participate
This study was a statistical analysis of weekly aggregated data without personal identifier, so it did not require ethical approval and informed consent. Our data providers had full access to the data and approved the use of data in this study.
Consent for publication
This study used aggregated data without any details, images, videos or other personal information relating to an individual person, so did not require written informed consent for the publication.
Competing interests
The authors declare that they have no competing interests.
Publisher’s Note
Springer Nature remains neutral with regard to jurisdictional claims in published maps and institutional affiliations.
Author details
1Department of Biostatistics, School of Public Health, Fudan University, Key
Laboratory of Public Health Safety, Ministry of Education, 200231 Xuhui District, Shanghai, China.2Shanghai Municipal Center for Disease Control and
Prevention, Shanghai, China.3National Institute for Viral Disease Control and
Prevention, China Centers for Disease Control and Prevention, Key Laboratory for Medical Virology, National Health and Family Planning Commission, Beijing, China.4Institute of Disease Control and Prevention,
Academy of Military Medical Science, Beijing, China.5School of Public Health,
Sun Yat-sen University, Shenzhen, China.6School of Public Health and Social
Work, Queensland University of Technology, Kelvin Grove, Brisbane, QLD 4059, Australia.7Institute of Health and Biomedical Innovation, Queensland
University of Technology, Kelvin Grove, Brisbane, QLD 4059, Australia.
8Shanghai Key Laboratory of Meteorology and Health, Shanghai, China.
Received: 18 July 2017 Accepted: 27 November 2017
References
1. Molinari NA, Ortega-Sanchez IR, Messonnier ML, Thompson WW, Wortley PM, Weintraub E, Bridges CB. The annual impact of seasonal influenza in the US: measuring disease burden and costs. Vaccine. 2007;25(27):5086–96. 2. Nair H, Brooks WA, Katz M, Roca A, Berkley JA, Madhi SA, Simmerman JM,
Gordon A, Sato M, Howie S, et al. Global burden of respiratory infections due to seasonal influenza in young children: a systematic review and meta-analysis. Lancet. 2011;378(9807):1917–30.
3. Influenza (seasonal). Fact sheet no. 211 [http://www.who.int/mediacentre/ factsheets/fs211/en/]. Accessed 15 Apr 2017.
4. Feng L, Shay DK, Jiang Y, Zhou H, Chen X, Zheng Y, Jiang L, Zhang Q, Lin H, Wang S, et al. Influenza-associated mortality in temperate and subtropical Chinese cities, 2003-2008. Bull World Health Organ. 2012;90(4):279–288B. 5. Monto AS, Gravenstein S, Elliott M, Colopy M, Schweinle J. Clinical signs
and symptoms predicting influenza infection. Arch Intern Med. 2000; 160(21):3243–7.
6. Monto AS. Viral respiratory infections in the community: epidemiology, agents, and interventions. Am J Med. 1995;99(6B):24S–7S.
7. Uyeki TM. Influenza diagnosis and treatment in children: a review of studies on clinically useful tests and antiviral treatment for influenza. Pediatr Infect Dis J. 2003;22(2):164–77.
8. Wang X: Extension of disease burden modeling from seasonal influenza to 2009 pandemic influenza. 2014.
9. Chowell G, Echevarria-Zuno S, Viboud C, Simonsen L, Tamerius J, Miller MA, Borja-Aburto VH. Characterizing the epidemiology of the 2009 influenza a/ H1N1 pandemic in Mexico. PLoS Med. 2011;8(5):e1000436.
10. Webster RG, Monto AS, Braciale TJ, Lamb RAX. Textbook of influenza. UK: Wiley; 2014.
11. Newall AT, Viboud C, Wood JG. Influenza-attributable mortality in Australians aged more than 50 years: a comparison of different modelling approaches. Epidemiol Infect. 2010;138(6):836–42.
12. A Practical Guide for Designing and Conducting Influenza Disease Burden Studies [http://www.wpro.who.int/emerging_diseases/documents/ GuideforDesigningandConductingInfluenzaStudies/en/]. Accessed 15 Apr 2017.
13. Serfling RE. Methods for current statistical analysis of excess pneumonia-influenza deaths. Public Health Rep. 1963;78(6):494–506.
14. Thompson WW, Weintraub E, Dhankhar P, Cheng PY, Brammer L, Meltzer MI, Bresee JS, Shay DK. Estimates of US influenza-associated deaths made using four different methods. Influenza Other Respir Viruses. 2009;3(1):37–49. 15. Chan KP, Wong CM, Chiu SS, Chan KH, Wang XL, Chan EL, Peiris JS, Yang L.
A robust parameter estimation method for estimating disease burden of respiratory viruses. PLoS One. 2014;9(3):e90126.
16. Yang L, Ma S, Chen PY, He JF, Chan KP, Chow A, CQ O, Deng AP, Hedley AJ, Wong CM, et al. Influenza associated mortality in the subtropics and tropics: results from three Asian cities. Vaccine. 2011;29(48):8909–14.
17. Liang Z, Ma Z. China's floating population: new evidence from the 2000 census. Popul Dev Rev. 2004;30(3):467–88.
18. Zhang L, Chow EPF, Jahn HJ, Kraemer A, Wilson DP. High HIV prevalence and risk of infection among rural-to-urban migrants in various migration stages in China: a systematic review and meta-analysis. Sex Transm Dis. 2013;40(2):136–47. %@ 0148-5717
19. Liu Z. Institution and inequality: the hukou system in China. J Comp Econ. 2005;33(1):133–57.
20. International Statistical Classification of Diseases and Related Health Problems 10th Revision (ICD-10)-WHO Version for 2016 [http://apps.who.int/ classifications/icd10/browse/2016/en#/X]. Accessed 15 Apr 2017. 21. Roberts K. Female labor migrants to shanghai: temporary“floaters”or
potential settlers? Int Migr Rev. 2002;36:492–519.
22. Yu H, Alonso WJ, Feng L, Tan Y, Shu Y, Yang W, Viboud C. Characterization of regional influenza seasonality patterns in China and implications for vaccination strategies: spatio-temporal modeling of surveillance data. PLoS Med. 2013;10(11):e1001552.
23. Liu XX, Qin G, Li X, Zhang J, Zhao K, Hu M, Wang XL. Excess mortality associated with influenza after the 2009 H1N1 pandemic in a subtropical city in China, 2010-2015. Int J Infect Dis. 2017;57:54–60.
25. Chow A, Ma S, Ling AE, Chew SK. Influenza-associated deaths in tropical Singapore. Emerg Infect Dis. 2006;12(1):114–21.
26. Newall AT, Wood JG, Macintyre CR. Influenza-related hospitalisation and death in Australians aged 50 years and older. Vaccine. 2008;26(17):2135–41. 27. Rizzo C, Viboud C, Montomoli E, Simonsen L, Miller MA. Influenza-related
mortality in the Italian elderly: no decline associated with increasing vaccination coverage. Vaccine. 2006;24(42–43):6468–75.
28. Khieu TQT, Pierse N, Telfar-Barnard LF, Zhang J, Huang QS, Baker MG. Modelled seasonal influenza mortality shows marked differences in risk by age, sex, ethnicity and socioeconomic position in New Zealand. J Inf Secur. 2017;75(3):225–33.
29. Rizzo C, Bella A, Viboud C, Simonsen L, Miller MA, Rota MC, Salmaso S, Ciofi degli Atti ML. Trends for influenza-related deaths during pandemic and epidemic seasons, Italy, 1969-2001. Emerg Infect Dis. 2007;13(5):694–9. 30. Zucs P, Buchholz U, Haas W, Uphoff H. Influenza associated excess mortality
in Germany, 1985-2001. Emerg Themes Epidemiol. 2005;2:6.
31. Hu A: Study on excess mortality of seasonal influenza in shanghai from 2000 to 2006. Master.Anhui Medical University; 2008.
32. Zhao B, Qin S, Teng Z, Chen J, Yu X, Gao Y, Shen J, Cui X, Zeng M, Zhang X. Epidemiological study of influenza B in shanghai during the 2009–2014 seasons: implications for influenza vaccination strategy. Clin Microbiol Infect. 2015;21(7):694–700. %@ 1198-1743X
33. Feng L, Mounts AW, Feng Y, Luo Y, Yang P, Feng Z, Yang W, Yu H. Seasonal influenza vaccine supply and target vaccinated population in China, 2004– 2009. Vaccine. 2010;28(41):6778–82. %@ 0264-6410X
34. Xu C, Thompson MG, Cowling BJ. Influenza vaccination in tropical and subtropical areas. Lancet Respir Med. 2017;5(12):920–2.
35. Wang X, Yang L, Chan KP, Chiu SSS, Chan KH, Peiris JSM, Wong CM. Performance of three influenza activity proxy variables for estimating age-specific hospitalization associated with influenza in Hong Kong. Hong Kong: Hong Kong College of Community Medicine; 2011, 2011.
36. Wei T, Zhu Q, Glomsrød S. Energy spending and household characteristics of floating population: evidence from shanghai. Energy Sustain Dev. 2014; 23:141–9.
37. Zhang L. Shanghai coming to grip with its aging population problems. Singapore: East Asian Institute, National University of Singapore; 2010. 38. Lowen AC, Steel J. Roles of humidity and temperature in shaping influenza
seasonality. J Virol. 2014;88(14):7692–5.
39. Wu P, Goldstein E, Ho LM, Yang L, Nishiura H, Wu JT, Ip DK, Chuang SK, Tsang T, Cowling BJ. Excess mortality associated with influenza a and B virus in Hong Kong, 1998-2009. J Infect Dis. 2012;206(12):1862–71.
• We accept pre-submission inquiries
• Our selector tool helps you to find the most relevant journal
• We provide round the clock customer support
• Convenient online submission
• Thorough peer review
• Inclusion in PubMed and all major indexing services
• Maximum visibility for your research Submit your manuscript at
www.biomedcentral.com/submit