Rochester Institute of Technology
RIT Scholar Works
Theses Thesis/Dissertation Collections
2001
Imaging Fourier transform spectrometer
Eric Sztanko
Follow this and additional works at:http://scholarworks.rit.edu/theses
This Thesis is brought to you for free and open access by the Thesis/Dissertation Collections at RIT Scholar Works. It has been accepted for inclusion Recommended Citation
Sztanko Thesis http://www.cis.rit.edu/research/thesis/bs/2001/sztanko/title.html
Imaging Fourier Transform Spectrometer
Design, Construction, and EvaluationFinal Report
Eric Sztanko
Chester F. Carlson Center for Imaging Science Rochester Institute of Technology
May 2001
Sztanko - Table of Contents http://www.cis.rit.edu/research/thesis/bs/2001/sztanko/toc.html
Imaging Fourier Transform Spectrometer
Eric Sztanko
Table of Contents
Abstract
Copyright
Acknowledgement
Introduction
Background
Design & Methods
Construction
Experiment # 1 - Movement
Experiment # 2 - Monochromatic Source
Experiment # 3 - Mercury Lamp and White Light
Sztanko - Abstract http://www.cis.rit.edu/research/thesis/bs/2001/sztanko/abstract.html
Imaging Fourier Transform Spectrometer
Eric Sztanko
Abstract
There are many applications that require spectral information from either objects or scenes. This paper will describe the design, construction, and evaluation of an imaging Fourier transform spectrometer (FTS) that will gather such spectral information. The
design of the spectrometer is based on that of a Michelson interferometer. Theory, limitations, alignment, and cost will all be considered in this work.
Copyright © 2001 http://www.cis.rit.edu/research/thesis/bs/2001/sztanko/copyright.html
Copyright © 2001
Center for Imaging Science
Rochester Institute of Technology
Rochester, NY 14623-5604
This work is copyrighted and may not be reproduced in whole or part without permission of the Center for Imaging Science at the Rochester Institute of Technology.
This report is accepted in partial fulfillment of the requirements of the course SIMG –503 Senior Research.
Title: Imaging Fourier Transform Spectrometer Author: Eric N. Sztanko
Project Advisor: Dr. Roger Easton Jr. SIMG 503 Instructor: Dr. Anthony Vodacek
Sztanko - Acknowledgements http://www.cis.rit.edu/research/thesis/bs/2001/sztanko/acknowledgement...
Imaging Fourier Transform Spectrometer
Eric Sztanko
Acknowledgements
I would first off like to thank Dr. Roger Easton Jr. for helping me throughout the entire span of this project and
having the patience to work with me.
I would also like to thank Dr. John Schott, Bryce Nordgren, and the Digital Imaging and Remote Sensing (DIRS) group at RIT for giving me the opportunity to work on this project.
Sztanko Thesis http://www.cis.rit.edu/research/thesis/bs/2001/sztanko/mainthesis.html#intro
Imaging Fourier Transform Spectrometer
Eric Sztanko
Introduction
The ability to obtain spectral information from objects or scenes is very useful in various fields including remote sensing, chemistry, astronomy, and industrial quality control. The methods of Fourier transform spectroscopy (FTS) have been used for over thirty years. As resolution of optical positioning devices and computer processing speeds increase, so does the usefulness and importance of FTS. There are many different designs of spectrometers available, but I have chosen to base this project on the Michelson interferometer.
Background
[image:7.612.361.515.294.416.2]www.chemistry.vt.edu www.3dimagery.com
Figure 1: Michelson Interferometer Figure 2: Interference Pattern
[image:7.612.72.273.294.417.2]
Sztanko Thesis http://www.cis.rit.edu/research/thesis/bs/2001/sztanko/mainthesis.html#intro
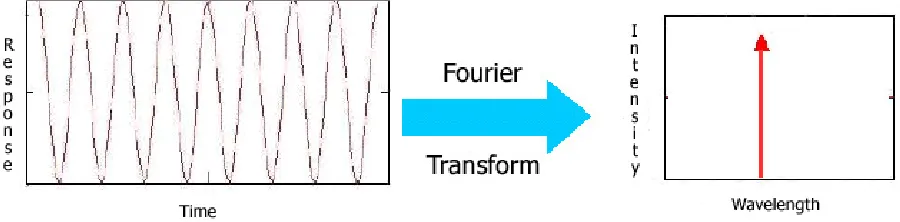
Figure 3: Theoretical spectral calculation of a monochromatic source with an infinite OPD
General Experimental Design and Methods
Figure 4 is the schematic for the planned spectrometer. The system is designed to have unit magnification so that the input and output image scales are equal. All
equipment will be fixed on the optical table. The planar object or source is placed in front of a collimating lens so that the wavefronts from each point are planar when they enter the beamsplitter. Approximately 50% of the energy will pass through the beamsplitter to the moving mirror and the other 50% to the fixed mirror. The moving mirror is restricted to a linear translation of 20 mm, which produces an OPD of up to 40 mm. The motion of the mirror needs to be considered because its surface must
always be orthogonal to the source. Also, enough time must elapse between steps to allow mirror vibration to settle. By collecting the data on both sides of the zero path difference (ZPD), it creates a "two-sided interferogram". Doing this removes the problem of finding the location of the ZPD exactly (a time consuming procedure). Data collection time will double, but "linear phase error in wave number can be exactly eliminated" (2) and signal noise will be reduced in the process. After the light beam reflects from both mirrors and are recombined by the
beamsplitter, it will be refocused directly onto a monochrome CCD video camera. The interferogram is sampled for every step of the moving mirror. The
Sztanko Thesis http://www.cis.rit.edu/research/thesis/bs/2001/sztanko/mainthesis.html#intro
Figure 4: Spectrometer Concept
Initial runs of the experiment were conducted with monochromatic light and lamps with prominent spectral lines, which helped in calibrating the system. Tests using illuminated color transparencies will be used to test the alignment of the
system. Alignment is an important issue in an imaging spectrometer; light emerging from each single point in the object plane must converge to a specific single point in the image plane. Artifacts due to sources other
than alignment will also be studied during this experiment. Some of these may be related to sampling, the motion of the mirror, optical aberrations, and the beamsplitter, all of which will affect the performance of the system. The interferograms must be imaged at sufficiently small increments of translation to ensure that the sinusoidal
variations in the interferogram are not aliased.
Sztanko Thesis http://www.cis.rit.edu/research/thesis/bs/2001/sztanko/mainthesis.html#intro
Figure 5: Constructed Spectrometer
Pictured above is the actual spectrometer that was constructed. It follows the same design as specified in the layout. The light source is a HeNe laser (l = 632.8
nm) which has been collimated through use of a 40x microscope objective and a 10 mm diameter pinhole. The beamsplitter then redirects approximately half of the light to fixed mirror and the other half to the moving mirror. The light is then recombined and passes through a neutral density filter and directly onto the CCD of the
monochrome digital camera. Both the motion of the mirror and image capture are automated processes controlled by the computer.
A linear stepper motor controlled by the computer is used for the moving mirror. An inexpensive means for generating these very small displacements (< 100 nm) was necessary. Most of these systems cost anywhere from $8,000 to well over $15,000, but this system was found for under $3,000. The system which was purchased from
Sztanko Thesis http://www.cis.rit.edu/research/thesis/bs/2001/sztanko/mainthesis.html#intro
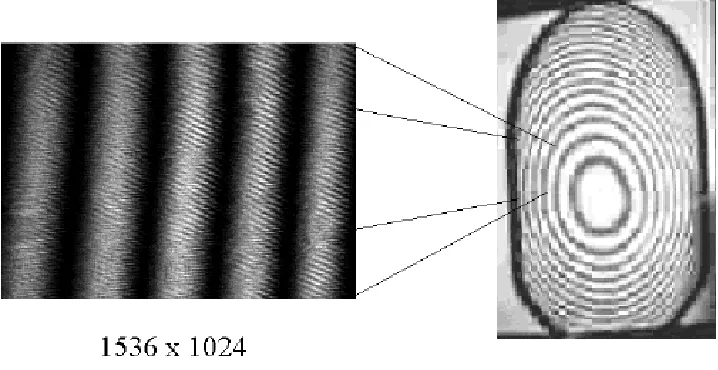
Figure 6: Image on the left taken by the monochrome digital camera
After collimating the light, alignment of the system with the monochromatic source was the next step. This involved reflecting the light at each of the sources (beamsplitter and the mirrors) back towards the pinhole. The interference fringes could be viewed on a piece of paper at the location of the recording camera. Above is a picture of the observed fringe pattern as taken by the digital camera. At this point the system is still only a Michelson interferometer.
Experiment #1 - Movement
Sztanko Thesis http://www.cis.rit.edu/research/thesis/bs/2001/sztanko/mainthesis.html#intro
Figure 7: Interference patterns before (top) and after (bottom) OPD displacement.
Pictured above are interference patterns from the HeNe Laser. The second picture was taken after the optical path difference was displaced by approximately 200nm (notice the shift between the two images). The results from performing this task were that tiny displacements could be achieved and that there was a detectable change between the two images.
Experiment #2 - Monochromatic Source
The second experiment involved turning the Michelson interferometer into a spectrometer. The digital camera was programmed using a module
in V++ so that it would take and save an image at a specified interval. The stepper motor was programmed with
Sztanko Thesis http://www.cis.rit.edu/research/thesis/bs/2001/sztanko/mainthesis.html#intro
[image:13.612.42.577.246.717.2]
Figure 8: The first five images of the data set.
Sztanko Thesis http://www.cis.rit.edu/research/thesis/bs/2001/sztanko/mainthesis.html#intro
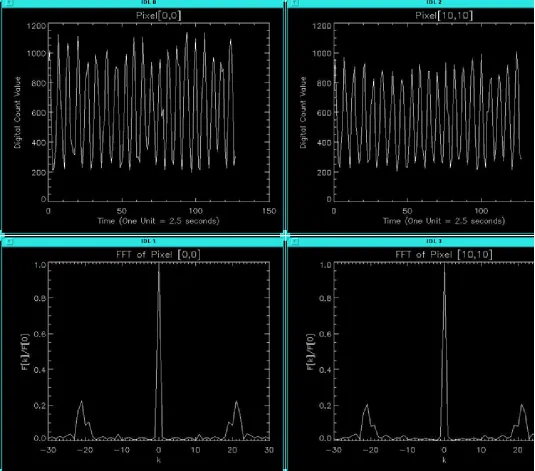
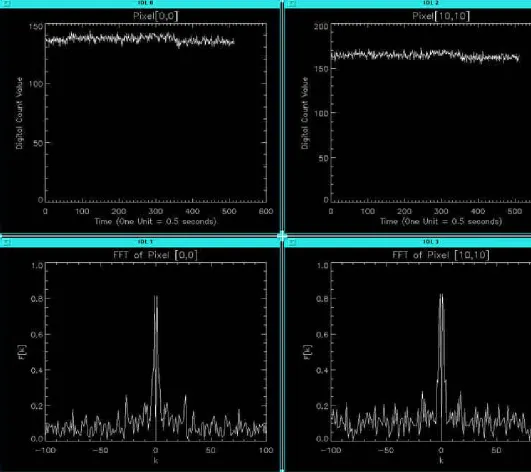
Figure 9: Data and FFT from a HeNe Laser.
Results from the first experiment were very reassuring. Spikes occurred at
±
21 and at 0, the DC component. By zooming in on the data it can be seen that 6 samples were taken per cycle, thus Dx = 105.5 nm.Error = 642.7 - 632.8 = 9.9 nm Relative Error = 1.6 %
Sztanko Thesis http://www.cis.rit.edu/research/thesis/bs/2001/sztanko/mainthesis.html#intro
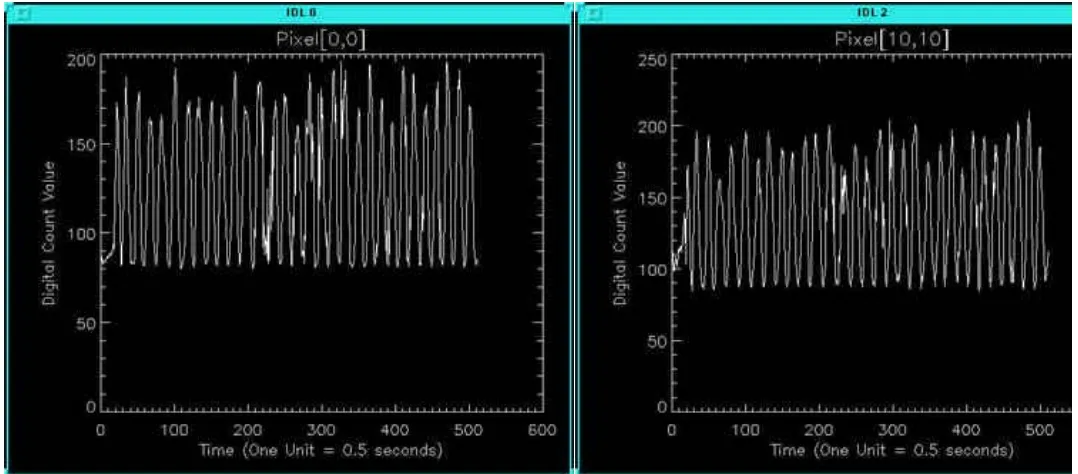
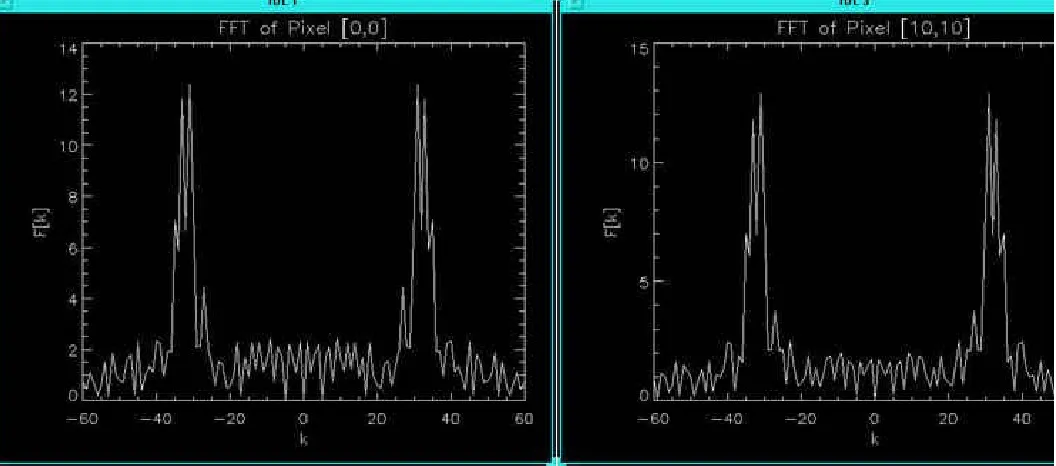
Figure 10: Data and FFT from a HeNe Laser.
The largest spikes occurred at
±
32 with the DC component removed. By zooming in on the data it can be seen that 16 samples were taken per cycle, thus Dx = 39.55 nm.
Error = 632.8 - 632.8 = 0 nm Relative Error = 0 %
By decreasing the interval time much noise was added to the system. Even though there was no error, the added noise created additional spikes surrounding
±
32, unlike the first try (128 samples - 2.5 second interval) where there were only two prominent spikes.
Sztanko Thesis http://www.cis.rit.edu/research/thesis/bs/2001/sztanko/mainthesis.html#intro
Figure 11 (above): Data and FFT from a Mercury Lamp.
[image:16.612.45.576.24.496.2]Sztanko Thesis http://www.cis.rit.edu/research/thesis/bs/2001/sztanko/mainthesis.html#intro
As this was the first attempt for both sources, modifications will be attempted to make improvements. For example, collimation may need to be obtained and by using a longer integration time for the digital camera, the signal to noise ratio would be reduced.
Discussion
Sztanko Thesis http://www.cis.rit.edu/research/thesis/bs/2001/sztanko/mainthesis.html#intro
nm in 15 minutes.
The problem with the digital camera is the software used to control it. The V++ software has a limit of around 160 images it can save, even if memory is constantly cleared. The around this was to run the program four times taking 128 images each time. While the images were being taken I would move the files into four separate folders.
Future Work
Future work is already in progress. The next step is to obtain the spectra of the mercury lamp and white light source. After the spectra are obtained, the daunting task of creating an 2-D image spectrogram of an input image would be attempted. Here alignment, aberrations, and effects of the beamsplitter become much more of an issue. Other future work may involve a more detailed look at the optics involved and also creating an interactive GUI software program for analyzing data.
Conclusion
I designed it. I built it. I tested it. Like all technical devices, it needs to be tested some more. The primary purpose of this project was to build a spectrometer that works. This has been demonstrated with use of the HeNe laser with a fairly high degree of accuracy. In the case of taking 128 samples, there was only a 1.6 % relative error, and when 512 samples were taken, the correct wavelength was found. To build an inexpensive imaging Fourier transform spectrometer is no easy task. Further testing and analysis should be able to yield the spectra for any type of light source along with a 2-D image spectrogram. I have provided a tool that is functional, now it must be studied further.
Sztanko - References http://www.cis.rit.edu/research/thesis/bs/2001/sztanko/references.html
Imaging Fourier Transform Spectrometer
Eric Sztanko
References
Note: Please use the back button to return to the previous page
Mertz, Lawrence. Transformations in Optics. John Wiley and Sons. New York, NY. 1965. 1.
Bell, Robert J. Introductory Fourier Transform Spectroscopy. Academic Press. New York, NY. 1972. 2.
Albergotti, J.C. "Fourier Transform Spectroscopy Using a Michelson Interferometer." American Journal
of Physics. Volume 40. Pages 1070-1073. August 1972. 3.
Berkey, Donald K. "An Undergraduate Experiment in Fourier-Transform Spectrometry." American
Journal of Physics. Volume 40. Pages 267-270. February 1972. 4.
Biggs, P., et al. "A Low-cost Fourier Transform Spectrometer for the Visible and Near-Infrared
Regions." Source Unknown. 5.
Johnston, Sean F. Fourier Transform Infrared. Ellis Horwood Limited. Chichester, England. 1991. 6.
Lanteigne, David J. "Imaging spectrometer based on white-light interferometry." SPIE. Volume 1772. Pages 369-373. 1992.
7.
Tittel, H.O., et al. "A Fourier Spectrometer For Visible Light." Infrared Physics. Volume 24. Pages
323-328. 1984. 8.
Sztanko - Appendix http://www.cis.rit.edu/research/thesis/bs/2001/sztanko/appendix.html
Imaging Fourier Transform Spectrometer
Eric Sztanko
Appendix
Note: Please use the back button to return to the previous page
IDL FFT Code
MVP Demo 2001 Code
V++ Code