R E S E A R C H
Open Access
Long-term mortality and risk factors for
development of end-stage renal disease in
critically ill patients with and without
chronic kidney disease
Claire Rimes-Stigare
1,2*, Paolo Frumento
3, Matteo Bottai
3, Johan Mårtensson
1,4, Claes-Roland Martling
1,2and Max Bell
1,2Abstract
Introduction:Prevalence of chronic kidney disease (CKD) amongst intensive care unit (ICU) admissions is rising. How mortality and risk of end-stage renal disease (ESRD) differs between those with and without CKD and with acute kidney injury (AKI) is unclear. Determining factors that increase the risk of ESRD is essential to optimise treatment, identify patients requiring nephrological surveillance and for quantification of dialysis provision.
Method:This cohort study used the Swedish intensive care register 2005–2011 consisting of 130,134 adult patients. Incomplete cases were excluded (26,771). Patients were classified (using diagnostic and intervention codes as well as admission creatinine values) into the following groups: ESRD, CKD, AKI, acute-on-chronic disease (AoC) or no renal dysfunction (control). Primary outcome was all-cause mortality. Secondary outcome was ESRD incidence.
Results:Of 103,363 patients 4,192 had pre-existing CKD; 1389 had ESRD; 5273 developed AKI and 998 CKD patients developed AoC. One-year mortality was greatest in AoC patients (54 %) followed by AKI (48.7 %), CKD (47.6 %) and ESRD (40.3 %) (P< 0.001). Five-year mortality was highest for the CKD and AoC groups (71.3 % and 68.2 %,
respectively) followed by AKI (61.8 %) and ESRD (62.9 %) (P< 0.001). ESRD incidence was greatest in the AoC and CKD groups (adjusted incidence rate ratio (IRR) 259 (95 % confidence interval (CI) 156.9–429.1) and 96.4, (95 % CI 59.7–155.6) respectively) and elevated in AKI patients compared with controls (adjusted IRR 24 (95 % CI 3.9–42.0);
P< 0.001). Risk factors independently associated with ESRD in 1-year survivors were, according to relative risk ratio, AoC (356; 95 % CI 69.9–1811), CKD (267; 95 % CI 55.1–1280), AKI (30; 95 % CI 5.98–154) and presence of elevated admission serum potassium (4.6; 95 % CI 1.30–16.40) (P< 0.001).
Conclusions:Pre-ICU renal disease significantly increases risk of death compared with controls. Subjects with AoC disease had extreme risk of developing ESRD. All patients with CKD who survive critical care should receive a nephrology referral.
Trial registration:Clinical trials registration number: NCT02424747 April 20th 2015.
* Correspondence:Claire.rimes-stigare@karolinska.se 1
Section of Anaesthesia and Intensive Care Medicine, Department of Physiology and Pharmacology, Karolinska Institute, Stockholm, Sweden 2
Department of Anaesthesia, Surgical Services and Intensive Care (ANOPIVA) F2, Karolinska University Hospital, Solna 171 76 Stockholm, Sweden Full list of author information is available at the end of the article
© 2015 Rimes-Stigare et al.Open AccessThis article is distributed under the terms of the Creative Commons Attribution 4.0 International License (http://creativecommons.org/licenses/by/4.0/), which permits unrestricted use, distribution, and reproduction in any medium, provided you give appropriate credit to the original author(s) and the source, provide a link to the Creative Commons license, and indicate if changes were made. The Creative Commons Public Domain Dedication waiver (http://creativecommons.org/publicdomain/zero/1.0/) applies to the data made available in this article, unless otherwise stated. Rimes-Stigareet al. Critical Care (2015) 19:383
Introduction
As the demographic of the intensive care unit (ICU) population changes, more patients present with pre-existing renal dysfunction [1, 2]. Chronic kidney disease (CKD) is defined by the Kidney Disease Improving Glo-bal Outcomes (KDIGO) as an abnormality of kidney function or structure present for more than 3 months, and is classified according to glomerular filtration rate (GFR) and proteinuria to stages 1–5. Patients in stage 5 who have a loss of renal function (GFR <15 ml/min per 1.73 m2) requiring dialysis are referred to as having end-stage renal disease (ESRD) [3]. CKD and ESRD are asso-ciated with increased risk of hospitalisation, cardiovascu-lar disease and death compared with individuals without renal dysfunction, and these diagnoses may affect out-comes following ICU admission [4–7]. How the risk of death for patients with CKD and ESRD differs from those with de novo acute kidney injury (AKI), and what impact acute-on-chronic disease (AoC) may have, has not been fully investigated in ICU populations. A num-ber of studies have addressed mortality in hospitalised and community-based populations with renal dysfunc-tion; however, outcomes may not be generalisable to the ICU where the panorama of diseases and illness severity precipitating admission differ [8, 9]. Studies of ICU pa-tients often lack comparison ICU cohorts and few have described long-term follow-up. Evidence suggests that illness severity scoring systems may overestimate mortal-ity risk in ICU patients with pre-existing renal impair-ment [2, 10]. This may lead to overly negative prognostication and restrictive treatment. Emerging evi-dence suggests that ICU outcomes for patients with ESRD may be better than previously assumed and super-ior to survival in patients with AKI [11, 12].
How factors related to ICU admission are associated with ESRD risk has not been fully elucidated. In a large Danish cohort, AoC was found to increase the risk of ESRD compared with CKD per se; surprisingly, de novo AKI was found to carry a greater cumulative risk of ESRD than isolated CKD [13]. Identification of pre-ICU risk factors, such as premorbid CKD and other co-morbidities, combined with intra-ICU risk factors such as AoC and de novo AKI is essential to improve treat-ment strategies during critical care and to identify pa-tients who merit continuing nephrological surveillance. This is vital because, unfortunately, post-ICU nephro-logical follow-up of patients with pre-existing renal dys-function or de novo AKI is not currently routine practice in Sweden or in many other countries.
The Swedish Intensive care register (SIR) database has near complete coverage of all Swedish ICU admissions. The use of SIR and other national registers allowed reli-able identification both of subjects with pre-ICU renal dysfunction and uniquely a control population with no
recorded renal disease prior to, or whilst in, ICU. We previously used this cohort to examine risk of death and post-ICU renal impairment in patients without premor-bid renal disease suffering from AKI [14]. In the present study we aimed to determine the long-term risk of death and ESRD in ICU patients with and without pre-existing renal dysfunction and to compare their risks to patients with AKI and with those who develop AoC disease. Additionally, we aimed to identify premorbid and ICU admission parameters predicting development of ESRD in order to pinpoint patients requiring nephrological follow-up at discharge.
Method
Study design
We used prospectively collected data from SIR and other Swedish national health registries. The Stockholm re-gional ethics committee granted ethical approval and in-formed consent was deemed unnecessary due to the scale and observational nature of the study. The study was performed in accordance with the ethical standards laid down in the 1964 Declaration of Helsinki and its later amendments.
Study cohort
We conducted an observational study from January 2005 to January 2010, using data from SIR. We included all first ICU admissions of adult patients (>18 years). We excluded patients with missing disease severity scores, intervention codes and/or diagnosis codes for AKI from International Classification of Diseases version 10 (ICD-10).
We used the unique 10-digit Swedish identification number to cross-link SIR data with the following national registers, previously described in detail [14] and in (Additional file 1):
1. The Swedish cause of death register to obtain details of all-cause mortality.
2. The national patient register (NPR) was utilised to obtain the subjects comorbidities using ICD-10 codes which we then classified according to the Charlson comorbidity index [15].
3. The Swedish renal register (SRR) provided data on individuals with ESRD prior to and post-ICU admission.
Primary outcome was mortality up to 5 years. Second-ary endpoint was ESRD.
Definitions
We classified patients based on their pre-ICU renal sta-tus as having no renal disease, CKD or ESRD. Premorbid creatinine levels or GFR estimates were not available
Patients were identified as having CKD if ICD-10 codes for moderate to severe renal disease according to the Charlson criteria (detailed in Additional file 2) were present in NPR. Current SRR guidelines recommend that only patients with CKD grade 3b or higher should be registered in NPR; these cases are patients with severe CKD. ESRD was recorded if subjects were registered in the SRR. Subjects were further grouped according to the presence or absence of AKI during ICU admission. Pa-tients with no prior renal dysfunction who fulfilled any of the criteria below were recorded as having de novo AKI and are referred to hereafter as AKI. Subjects with pre-morbid CKD additionally meeting criteria 1, 2 or 3 below were considered to have AoC disease. Patients with no re-corded renal disease are referred to as the control group, whilst patients in the CKD, ESRD and AKI groups are collectively described as having renal dysfunction.
Criteria for AKI:
1. Intermittent haemodialysis (IHD) or continuous renal replacement therapy (CRRT) reported in SIR.
2. The diagnosis“acute renal failure”recorded within the Acute Physiology and Chronic Health Evaluation (APACHE) II score, defined as a creatinine increase by >1.5 times from baseline (known to the
diagnosing doctor) with urine output <410 ml in 24 hours.
3. Diagnosis code“acute kidney failure”N17 in ICD-10 assigned at discharge.
4. A serum creatinine >354μmol/l (KDIGO grade 3) recorded on admission in APACHE II, Simplified Acute Physiology Score (SAPS)-II or SAPS-III scoring systems.
Patients were considered to have developed ESRD if they were registered in the SRR 3 months or more after admission to ICU.
Data from the Swedish cause of death register was avail-able until 31 December 2011 and maximum follow-up for primary outcome was 7 years. Data from other national registers were available until 31 December 2010 and therefore the maximum follow-up for secondary analysis was 6 years.
Statistical analysis
We report continuous data as medians with interquartile range (IQR). Categorical data are expressed as counts and percentages. The Mann–Whitney test was used to compare distributions of continuous variables at baseline between each group and the no renal disease (control) cohort. The Fisher’s exact test was used to compare prevalence of comorbidities between groups. A two-sidedPvalue <0.05 was considered significant.
Primary analysis
We considered time from ICU admission to death or end of follow-up (31 December 2011 for death or 31 December 2010 for secondary analysis), whichever occurred first. Information regarding emigration was unavailable. Survival curves were estimated by the Kaplan-Meier method and the log-rank test was used to verify equality of survivor functions between sub-groups. We tested for proportionality of survival curves using Schoenfeld residuals and found evidence of non-proportionality; proportional hazard regression was therefore inappropriate and we instead used Pois-son regression, which more easily allowed modelling time varying covariates and non-proportional hazards. We present incidence rate ratios (IRR).
Multivariable analysis
Potential confounders were considered on the basis of prior knowledge of AKI and CKD and on whether inclu-sion of the covariates to the models changed estimates of log relative risk by >10 % [16]. We selected and tested age, sex, SAPS-III score (the scoring system most often recorded), acute surgery and the Charlson comorbidity groups as potential confounders and adjusted for these in our sensitivity analysis of subgroups. We present two models of multivariable analyses for primary outcome: a fully adjusted model which includes SAPS-III score (Model 2) and a partially adjusted model (Model 1),
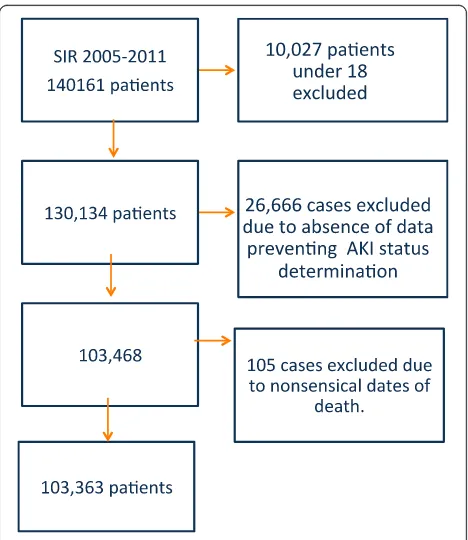
Fig. 1Flow chart of SIR cohort and excluded cases.AKIAcute kidney injury,SIRSwedish Intensive care register
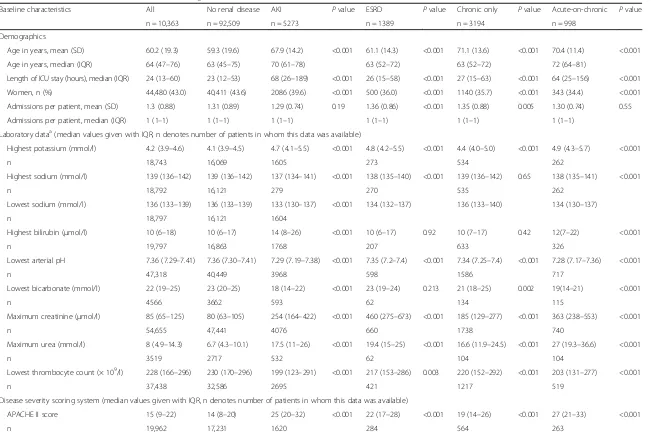
[image:3.595.305.539.438.708.2]Table 1Baseline characteristics of the cohort according to renal disease status
Baseline characteristics All No renal disease AKI Pvalue ESRD Pvalue Chronic only Pvalue Acute-on-chronic Pvalue
n = 10,363 n = 92,509 n = 5273 n = 1389 n = 3194 n = 998
Demographics
Age in years, mean (SD) 60.2 (19.3) 59.3 (19.6) 67.9 (14.2) <0.001 61.1 (14.3) <0.001 71.1 (13.6) <0.001 70.4 (11.4) <0.001
Age in years, median (IQR) 64 (47–76) 63 (45–75) 70 (61–78) 63 (52–72) 63 (52–72) 72 (64–81)
Length of ICU stay (hours), median (IQR) 24 (13–60) 23 (12–53) 68 (26–189) <0.001 26 (15–58) <0.001 27 (15–63) <0.001 64 (25–156) <0.001
Women, n (%) 44,480 (43.0) 40,411 (43.6) 2086 (39.6) <0.001 500 (36.0) <0.001 1140 (35.7) <0.001 343 (34.4) <0.001
Admissions per patient, mean (SD) 1.3 (0.88) 1.31 (0.89) 1.29 (0.74) 0.19 1.36 (0.86) <0.001 1.35 (0.88) 0.005 1.30 (0.74) 0.55
Admissions per patient, median (IQR) 1 (1–1) 1 (1–1) 1 (1–1) 1 (1–1) 1 (1–1) 1 (1–1)
Laboratory dataa(median values given with IQR, n denotes number of patients in whom this data was available)
Highest potassium (mmol/l) 4.2 (3.9–4.6) 4.1 (3.9–4.5) 4.7 (4.1–5.5) <0.001 4.8 (4.2–5.5) <0.001 4.4 (4.0–5.0) <0.001 4.9 (4.3–5.7) <0.001
n 18,743 16,069 1605 273 534 262
Highest sodium (mmol/l) 139 (136–142) 139 (136–142) 137 (134–141) <0.001 138 (135–140) <0.001 139 (136–142) 0.65 138 (135–141) <0.001
n 18,792 16,121 279 270 535 262
Lowest sodium (mmol/l) 136 (133–139) 136 (133–139) 133 (130–137) <0.001 134 (132–137) 136 (133–140) 134 (130–137)
n 18,797 16,121 1604
Highest bilirubin (μmol/l) 10 (6–18) 10 (6–17) 14 (8–26) <0.001 10 (6–17) 0.92 10 (7–17) 0.42 12(7–22) <0.001
n 19,797 16,863 1768 207 633 326
Lowest arterial pH 7.36 (7.29–7.41) 7.36 (7.30–7.41) 7.29 (7.19–7.38) <0.001 7.35 (7.2–7.4) <0.001 7.34 (7.25–7.4) <0.001 7.28 (7.17–7.36) <0.001
n 47,318 40,449 3968 598 1586 717
Lowest bicarbonate (mmol/l) 22 (19–25) 23 (20–25) 18 (14–22) <0.001 23 (19–24) 0.213 21 (18–25) 0.002 19(14–21) <0.001
n 4566 3662 593 62 134 115
Maximum creatinine (μmol/l) 85 (65–125) 80 (63–105) 254 (164–422) <0.001 460 (275–673) <0.001 185 (129–277) <0.001 363 (238–553) <0.001
n 54,655 47,441 4076 660 1738 740
Maximum urea (mmol/l) 8 (4.9–14.3) 6.7 (4.3–10.1) 17.5 (11–26) <0.001 19.4 (15–25) <0.001 16.6 (11.9–24.5) <0.001 27 (19.3–36.6) <0.001
n 3519 2717 532 62 104 104
Lowest thrombocyte count (× 109/l) 228 (166
–296) 230 (170–296) 199 (123–291) <0.001 217 (153–286) 0.003 220 (152–292) <0.001 203 (131–277) <0.001
n 37,438 32,586 2695 421 1217 519
Disease severity scoring system (median values given with IQR, n denotes number of patients in whom this data was available)
APACHE II score 15 (9–22) 14 (8–20) 25 (20–32) <0.001 22 (17–28) <0.001 19 (14–26) <0.001 27 (21–33) <0.001
n 19,962 17,231 1620 284 564 263
Rimes-Stiga
re
et
al.
Critical
Care
(2015) 19:383
Page
4
of
Table 1Baseline characteristics of the cohort according to renal disease status(Continued)
SAPS-II score 27 (0–44) 25 (0–41) 55 (42–70) <0.001 35 (16–52) <0.001 40 (23–53) <0.001 56 (43–68) <0.001
n 17,074 15,376 764 269 503 162
SAPS-III score 54 (44–65) 52 (43–63) 68 (59–77) <0.001 60 (51–71) <0.001 64 (55–72) <0.001 69 (60–78) <0.001
n 20,970 18,326 1437 195 736 276
Interventionsb
Invasive mechanical ventilation, n (%) 8621 (8.3) 7155 (7.7) 994 (18.9) <0.001 93 (6.7) 0.156 201 (6.3) 0.002 178 (17.8) <0.001
Acute surgery, n (%) 8379 (8.1) 7282 (7.8) 662 (12.6) <0.001 109 (7.8) 1.0 228 (7.14) 0.132 98 (9.82) 0.029
Elective surgery, n (%) 5889 (5.7) 5237 (5.7) 295 (5.6) 1.0 83 (6.0) 0.6 201 (6.3) 0.111 69 (6.9) 0.098
Comorbidities
Charlson comorbidity score, meanc(SD) 2,03 (2.42) 1.8 (2.2) 2.6 (2.5) <0.001 5.2 (2.5) <0.001 5.8 (2.6) <0.001 5.6 (2.6) <0.001
Charlson score with renal points removed, mean (SD)
1.92 (2.3) 1.78 (2.2) 2.6 (2.5) <0.001 3.2 (2.4) <0.001 3.8 (2.6) <0.001 3.6 (2.6) <0.001
Myocardial infarction, n (%) 14,605 (14.1) 11,896 (12.9) 986 (18) <0.001 387 (28.0) <0.001 1047 (32.8) <0.001 289 (29.0) <0.001
Congestive cardiac failure, n (%) 16,281 (15.7) 12,521 (13.5) 1324 (25.1) <0.001 438 (31.5) <0.001 1563 (48.9) <0.001 435 (43.6) <0.001
Peripheral vascular disease, n (%) 10,948 (10.6) 8921 (9.6) 704 (13.4) <0.001 348 (25.0) <0.001 761 (23.8) <0.001 214 (21.4) <0.001
Cerebrovascular disease, n (%) 17,742 (17.2) 15,658 (16.9) 808 (15.3) <0.001 310 (22.3) <0.001 789 (24.7) <0.001 177 (17.7) 0.497
Dementia, n (%) 2070 (2.0) 1840 (2.0) 99 (1.9) 0.612 16 (1.2) 0.03 100 (3.13) <0.001 15 (1.50) 0.359
COPD, n (%) 14,841 (14.4) 12,999 (14.1) 808 (15.3) 0.010 150 (10.8) <0.001 696 (21.8) <0.001 188 (18.8) <0.001
Rheumatological disease, n (%) 4006 (3.8) 3311 (3.6) 269 (5.1) <0.001 93 (6.7) <0.001 262 (8.2) <0.001 71 (7.1) <0.001
Peptic ulcer disease, n (%) 6729 (6.5) 5693 (6.2) 423(8.0) <0.001 154 (11.2) <0.001 362 (11.3) <0.001 97 (9.7) <0.001
Cancer, n (%) 18,175 (17.6) 15,726 (17.0) 1262 (24.0) <0.001 217 (15.7) 0.183 738 (23.1) <0.001 232 (23.3) <0.001
Metastatic disease, n (%) 3747 (3.6) 1918 (3.6) 304 (4.7) <0.001 24 (1.7) <0.001 127 (4.0) 0.246 28 (2.8) 0.199
Mild liver disease, n (%) 5272 (5.1) 4504 (4.9) 369 (7.0) <0.001 123 (8.9) <0.001 210 (6.6) <0.001 66 (6.6) 0.015
Moderate or severe liver disease, n (%) 2436 (2.4) 3319 (2.1) 249 (5.8) <0.001 31 (2.2) 0.64 125 (3.9) <0.001 58 (5.8) <0.001
Uncomplicated diabetes, n (%) 16,684 (16.1) 13,168 (14.2) 1372 (26.2) <0.001 537 (38.7) <0.001 1215 (38.0) <0.001 392 (39.3) <0.001
Diabetes with complications, n (%) 6756 (6.5) 4660 (5.0) 523 (9.9) <0.001 499 (35.9) <0.001 806 (25.2) <0.001 268 (26.9) <0.001
Paraplegia, n (%) 2004 (1.9) 1787 (1.9) 90 (1.7) 0.287 29 (2.07) 0.624 78 (2.44) 0.043 20 (2.00 0.817
HIV, n (%) 137 (0.13) 125 (0.14) 4 (0.08) 0.328 3 (0.22) 0.44 5 (0.16) 0.63 0 (0) 0.65
a
Laboratory data was obtained from the severity scorings systems APACHE II, SAPS-II and SAPS-III. APACHE II and SAPS-II record the highest or lowest values during the first 24 hours of ICU admission, whilst SAPS-III records values from 1 hour before until 1 hour after ICU admission. Values for scoring systems were not available in all patients; n denotes the number of patients in which this information was recorded
b
Intervention codes were also underreported and therefore the number of patients in which these data were available is detailed in the table. Reporting of all other baseline characteristics is complete
c
Charlson score is not age adjusted
Pvalues compared to no renal disease group
AKIAcute kidney injury,APACHEAcute Physiology and Chronic Health Evaluation,COPDChronic obstructive pulmonary disease,ESRDEnd-stage renal disease,IQRInterquartile range,SAPSSimplified Applied Physiology Score,SDStandard deviation
Rimes-Stiga
re
et
al.
Critical
Care
(2015) 19:383
Page
5
of
which excluded SAPS-III score. Some covariates only significantly changed log relative risk in the fully ad-justed model in the presence of SAPS III and are there-fore not present in model 1.
Survival percentiles
Laplace regression was used to estimate the number of days of survival to event (death or ESRD) for the fifth, tenth, twentieth and thirtieth centiles in all groups [17].
Secondary analysis
Secondary analyses were performed in a similar manner to the primary analysis. Time from admission to ESRD was considered, with censoring occurring at the point of death or end of follow-up, whichever occurred first. A multivariable analysis model is presented for secondary outcome.
Additionally, a polynomial logistic regression was per-formed to identify predictors of development of ESRD at 1 year in 1-year survivors. The model included no cen-sored data. All patients were followed up for at least 1 year; that is, no patient was censored before the end of the first year. This competing risks model included four-level polytomous outcomes defined as death, ESRD, ESRD and death or no negative outcome, with the latter being the reference outcome. Stepwise backwards elimination was used to construct the model at the significance level ofP> 0.1. Covariates were selected on the basis of a priori knowledge of AKI and CKD and covariates which changed estimates of log relative risk by >10 %, including available laboratory data and comorbidities and demographic data.
Relative risk ratios (RRR) are reported because mul-tiple outcomes were possible. RRR are the ratio of rela-tive risks for the outcome ESRD versus base category (survival without ESRD) for each given covariate pattern compared with a reference category. This reference cat-egory was male, with no comorbidities (according to Charlson index), normal admission potassium (3.9–4.59 mmol/l) and no renal disease (pre- or peri-ICU).
The polytomous (competing risk) model enabled pre-diction of the probability of the outcome ESRD occur-ring and allowed creation of a binary variable ESRD/no ESRD. The sensitivity and specificity of this prediction was investigated with respect to this binary outcome by using the receiver operating characteristic (ROC) curve. The area under the ROC curve (AUC) was used to as-sess discrimination.
Analysis was performed using Stata version 12 (Stata-Corp LP, College Station, TX, USA).
Results
We identified 130,134 first admissions between 2005 and 2011. A flow chart detailing case exclusion is shown in Fig. 1. A total of 103,363 patients were included in the final analyses. Baseline characteristics and outcome for patients excluded due to insufficient data are pre-sented in Additional file 3.
Overall, 4,192 (4.1 %) patients had pre-morbid CKD. Of these, 998 (23.8 %) developed AoC renal disease. In total, 1389 of 103,363 (1.34 %) patients were identified as having ESRD prior to admission; 5273 subjects de-veloped (severe) de novo AKI, whilst the remaining patients (92,509) were considered to have had no renal disease. Characteristics of these patients are presented in Table 1.
The median age of the cohort was 64 years. Patients with CKD and de novo AKI were significantly older than controls (74 and 73 years versus 63 years; P<0.001). The median length of ICU stay (LOS) was greatest for AKI patients (68 hours) and all groups with renal dys-function had longer LOS than the controls (23 hours;
[image:6.595.57.539.584.690.2]P< 0.001). ESRD patients were younger (63 years; P< 0.001) than all other renal disease groups (P values in Table 1 refer only to comparison of each group to the no renal disease (control) group). Test of significance be-tween renal dysfunction groups are not displayed. The groups with ESRD and CKD had significantly shorter lengths of stay (26 and 27 hours, respectively) compared
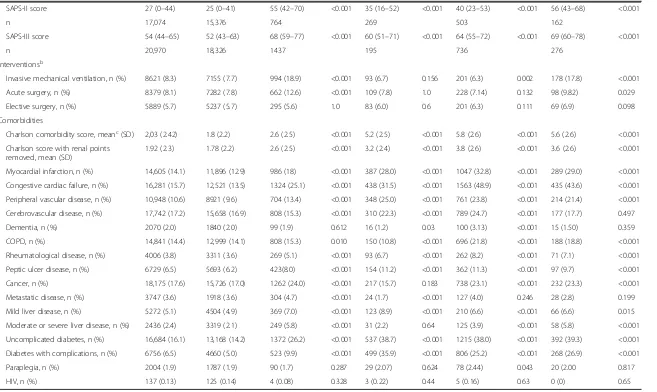
Table 2Primary outcome; multivariable Poisson regression analysis of risk of death according to renal function status
Group n Deaths Person years Mortality rate deaths/
person-year (95 % CI)
Crude MRR (95 % CI)
Adjusted MRRa (95 % CI)
Adjusted MRRb (95 % CI)
All 103,363 37,836 2.5 × 10⁵ 0.151 (0.150–0.153)
No renal disease 92,509 31,530 2.3 × 10⁵ 0.135 (0.134–0.137) 1 1 1
AKI 5273 2943 7.6 × 10³ 0.387 (0.374–0.402) 2.87 (2.76–2.97) 2.14 (2.06–2.22) 1.15 (1.09–1.21)
Chronic only 3194 2002 4.9 × 10³ 0.405 (0.387–0.423) 2.99 (2.86–3.13) 1.75 (1.71–1.86) 1.26 (1.17–1.36)
Acute-on-chronic 998 619 1.3 × 10³ 0.478 (0.442–0.518) 3.53 (3.26–3.33) 2.36 (2.18–2.56) 1.38 (1.24–1.54)
ESRD 1389 782 2.8 × 10³ 0.281 (0.26–0.30) 2.08 (1.94–2.23) 2.13 (1.98–2.30) 1.46 (1.29–1.67)
MRR are relative to patients in the no renal disease group
a
Model 1: adjusted for age, gender, myocardial infarction and diabetes mellitus with complications.
b
Model 2: fully adjusted model, adjusted for age, gender, SAPS-III score, myocardial infarction, cerebrovascular disease, diabetes mellitus with complications, moderate to severe liver disease, cancer and dementia.
AKIAcute kidney injury,CIConfidence interval,ESRDEnd-stage renal disease,MRRMortality rate ratio
to all other renal disease groups (P< 0.001). The cohort consisted of 43 % women. Men were more likely than women to have pre-existing renal dysfunction (64 % of CKD and 64.3 % of ESRD patients were male;P< 0.001).
Illness severity scores were significantly higher in pa-tients with renal dysfunction versus controls and were highest in those with AoC renal disease (SAPS-III 69 versus 52;P< 0.001). The group with ESRD had signifi-cantly lower severity scores than all other renal dysfunc-tion groups (P< 0.05).
Interventions were underreported, but AKI patients and the AoC group differed from controls by having higher rates of invasive ventilation (18.9 and 17.8 versus 7.7 %; P< 0.001) and emergency surgery (12.6 and 9.2 versus 7.8 %;P< 0.001).
Compared with controls, patients with renal dysfunc-tion had a significantly greater number of comorbidities and higher Charlson score; CKD subjects had the highest mean adjusted score (3.8 versus 1.8;P< 0.001). Cardiovas-cular disease, myocardial infarction, congestive cardiac disease and diabetes were more common amongst those with CKD compared with other groups. Subjects with pre-existing ESRD had less congestive cardiac failure, COPD and malignant disease than other patients with renal dysfunction (Table 1).
Primary outcome
Follow-up for primary outcome was up to 7 years, with a median time of 2.1 years, whilst for secondary out-come median follow-up was 1.3 years.
During follow-up 37,836 (36.6 %) patients died. Rates of all-cause crude mortality were highest in patients with AoC renal disease who had a mortality rate ratio (MRR) relative to the control group of 3.53 (P< 0.001) and this differed significantly from subjects with both de novo AKI and CKD, where MRR compared to controls were 2.87 and 2.99, respectively (P< 0.001) (Table 2). The risk of death for ESRD patients was elevated compared with controls (MRR 2.08) but significantly lower than for patients with both CKD and AKI (P< 0.001). Multivari-ate analysis reduced estimMultivari-ates of MRR although they remained significantly elevated in all renal dysfunction groups compared to controls (P< 0.001). Full adjustment
showed MRR for ESRD to be higher than for AKI (1.46 versus 1.15;P< 0.001).
[image:7.595.58.540.103.198.2]Kaplan-Meier estimates showed 90-day mortality to be highest in the AoC and AKI groups (46.2 and 43.5 %) whilst for the ESRD group it was 29 %. However, this
Table 3Primary outcome; Kaplan-Meier mortality estimates at specific time points according to renal function status
Group Mortality probability (%)
90 days 95 % CI 1 year 95 % CI 3 years 95 % CI 5 years 95 % CI
No renal disease 19.3 19.1–19.6 24.6 24.4–24.9 29.1 28.8–29.4 39.1 38.7–39.5
AKI 43.5 42.2–44.9 48.7 47.4–50.1 53.0 51.6–54.4 61.8 60.0–64.6
Chronic only 36.8 35.1–38.5 47.7 45.9–49.4 55.7 53.9–57.4 71.3 69.1–73.4
Acute-on-chronic 46.2 43.2–49.3 54.3 51.3–57.4 58.6 55.5–61.8 68.2 64.2–72.2
ESRD 29.0 26.7–31.4 40.3 37.8–42.9 47.0 44.4–49.7 62.9 59.8–66.1
AKIAcute kidney injury,CIConfidence interval,ESRDEnd-stage renal disease
a
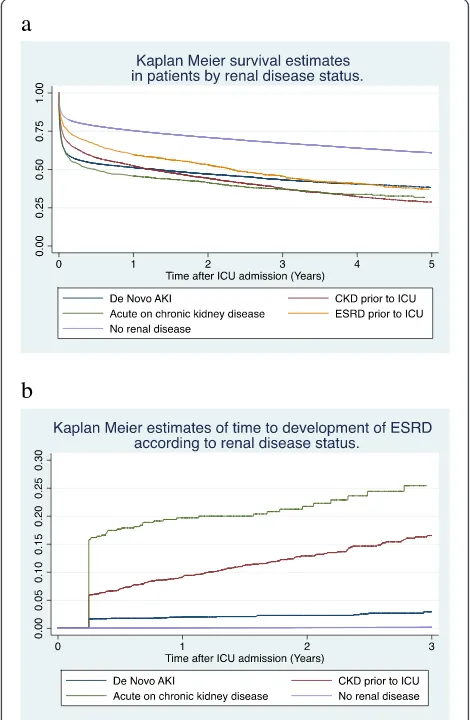
b
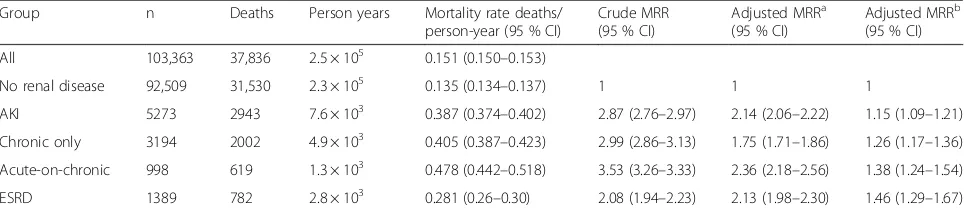
Fig. 2Kaplan-Meier curves showinga5-year survival andb3-year risk of developing ESRD according to renal disease status. Note that official registration of ESRD occurred at least 3 months after ICU ad-mission and therefore there is a sudden steep decline in curve b corresponding to this time point.AKIAcute kidney injury,CKD
Chronic kidney disease,ESRDEnd-stage renal disease,ICU
Intensive care unit
[image:7.595.304.539.294.654.2]increased to 40.3 % by 1 year and was 62.9 % at 5 years, similar to the mortality rate for AKI (61.8 %). Patients with CKD had the highest 5-year mortality rate of 71.3 % (Table 3 and Fig. 2a).
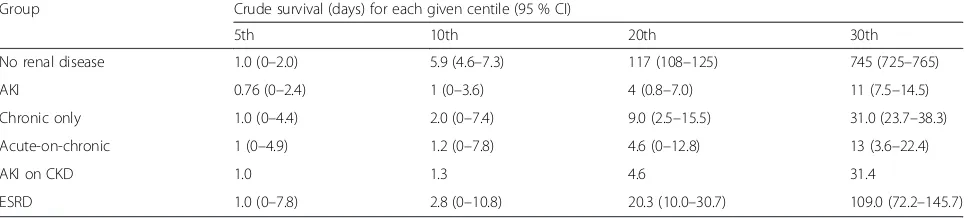
Crude survival for the fifth to thirtieth centiles analysis (Table 4) shows that 5 % of all patients died within one day of ICU admission. Twenty percent of AKI and AoC patients were dead within 5 days, whilst the first 20 % of deaths in the no renal disease group occurred by 117 days. Thirty percent of patients in the AKI, CKD and AoC groups had died by 11.0, 31.0 and 31.4 days, respectively. In contrast it took 109 days for the first 30 % of patients in the ESRD group to die.
Secondary outcome
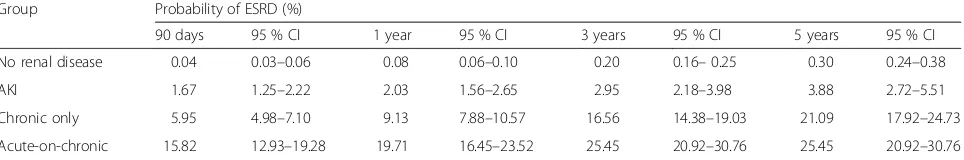
In univariate analysis, incidence of ESRD (Table 5) was highest in the AoC group (0.138 events per person year) followed by the CKD groups (0.069 events per person year; P< 0.001). Crude IRR were 205 and 103, respect-ively. The proportion of patients with ESRD was 9.13 % in the CKD group and 19.71 % in AoC subjects at 1 year. This rose to 21.09 and 25.45 %, respectively, at 5 years. AKI patients 1-year incidence of ESRD was 2 %, increas-ing to 3.9 % at 5 years (Table 6; Fig. 2b).
Multivariate analysis showed that ESRD incidence remained highest in the AoC and CKD group after ad-justment IRR (259 and 96.4); for subjects with de novo AKI, risk was also elevated although to a lesser degree (adjusted IRR 24;P< 0.001; Table 5).
The competing-risks multinomial regression analysis showing predictors of ESRD at 1-year post-ICU admis-sion in 1-year survivors with RRR is presented in Table 7 (predictors of other outcomes used only in order to con-struct the model are not presented). The RRR showed the predicted risk of developing ESRD versus survival with no ESRD. For patients with CKD it was 265.7 times higher than for those without CKD. For the AoC group it was 356.6 times higher than for patients with no renal disease.
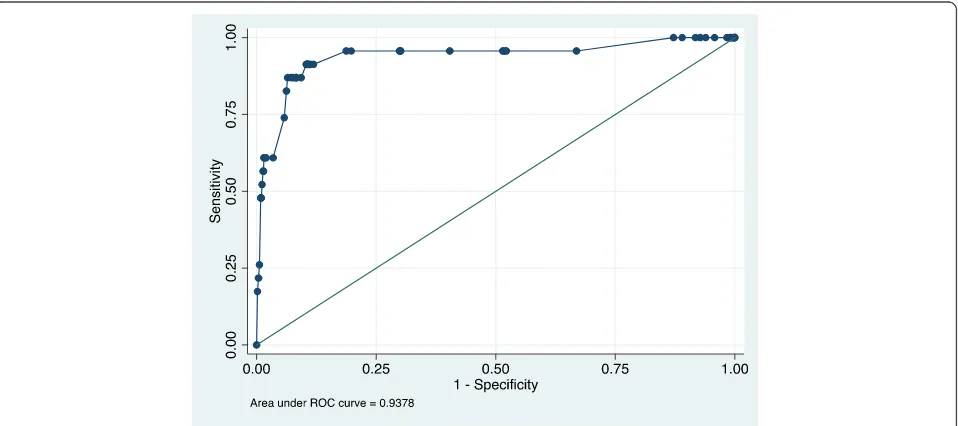
The area under the ROC curve (presented in Fig. 3) from the predicted value of the multinomial logistic
regression was 0.937 (95 % CI 0.87–1.00). Significant predictors were high serum potassium on admission (RRR 4.61; 95 % CI 1.29–16.38) and presence of pre-ICU CKD )RRR 265.7; 95 % CI. 55.2–1279), AKI (30.3; 95 % CI. 5.98–154.5) or AoC (365; CI 95 % 69.9– 1818). Age was not associated with likelihood of ESRD; it was modelled using cubic splines and cate-gorised by 20-year intervals, as patients over 80 were less likely to receive chronic dialysis than younger patients. Congestive heart failure was found to be negatively associated with the risk of ESRD at 1 year; it was associated with death at 1-year (P< 0.001).
Discussion
We explored long-term risks of mortality and ESRD in more than 100,000 ICU patients with or without pre-morbid CKD. Compared with patients without renal disease we found that the CKD group had a threefold crude in-creased risk of death, the AoC group had 3.5-fold, the ESRD group 2.1-fold and the AKI group 2.9-fold higher mortality.
In ICU survivors, subjects with CKD prior to admis-sion had significantly elevated risk of developing ESRD in comparison to ICU controls. The highest risk was seen in the AoC group who had 259 times higher ad-justed risk of developing dialysis dependence than the control group, whilst those with CKD had a 96-fold ele-vated risk of ESRD.
[image:8.595.57.544.616.725.2]Our finding that subjects with CKD, and particularly AoC, had higher mortality rates compared with those with AKI is consistent with most other studies. A study of 9450 surgical patients found long-term survival to be significantly worse for those with AoC than for patients with AKI (hazard ratio (HR) 3.3) [8]. In a second study, Lebiedz et al. found the presence of AKI in patients with nondialysis-dependent CKD to be associated with 1-year mortality [18]. However, an observational cohort of 618 AKI patients from the PICCARD study reported better crude survival for patients with pre-existing CKD than for subjects without [19]. It was noted that these pa-tients received earlier nephrological referral; perhaps prompt assessment led to earlier intervention.
Table 4Primary outcome; crude survival centiles derived from Laplace regression according to renal function status
Group Crude survival (days) for each given centile (95 % CI)
5th 10th 20th 30th
No renal disease 1.0 (0–2.0) 5.9 (4.6–7.3) 117 (108–125) 745 (725–765)
AKI 0.76 (0–2.4) 1 (0–3.6) 4 (0.8–7.0) 11 (7.5–14.5)
Chronic only 1.0 (0–4.4) 2.0 (0–7.4) 9.0 (2.5–15.5) 31.0 (23.7–38.3)
Acute-on-chronic 1 (0–4.9) 1.2 (0–7.8) 4.6 (0–12.8) 13 (3.6–22.4)
AKI on CKD 1.0 1.3 4.6 31.4
ESRD 1.0 (0–7.8) 2.8 (0–10.8) 20.3 (10.0–30.7) 109.0 (72.2–145.7)
AKIAcute kidney injury,CIConfidence interval,CKDChronic kidney disease,ESRDEnd-stage renal disease
Mortality in our study was relatively low for ESRD pa-tients (90-day mortality, 29 %) compared with two previ-ous studies, where 90-day mortality rates were 42 and 44.6 % [20, 21].We also found that crude mortality was lower for ESRD patients compared with AKI patients (1 year 40.3 % versus 48.7 %; P> 0001). However, this survival advantage was not maintained after adjustment, indicating presence of selection bias. Our ESRD popula-tion was younger, less severely ill, and had less comor-bidity than other renal disease groups. Ostermann and co-workers found their ESRD population to be affected by fewer organ failures and less likely to be mechanically ventilated [22]. ESRD patients selected for admittance to ICU may represent a healthier subgroup of the ESRD population usually presenting with less severe disease than other patients. A cohort of 41,972 UK and German ICU admissions found lower mortality in ESRD than AKI patients (hospital mortality 34.5 % versus 61.6 %;
P< 0.0001) [22]. Reviews examining this and other studies found survival to be better for ESRD patients than for AKI groups as did two subsequent original studies [11, 12, 23–25].
The most striking finding of this study was the ex-treme relative risk of ESRD in patients with CKD prior to ICU admission, in particular for those with AoC. This occurred despite the high competing risk of death in these groups and was confirmed by the competing risk analysis. These observations are concordant with a large cohort which found AoC patients (without renal recov-ery at discharge) to have a HR of 213 for developing ESRD, compared with patients with preserved kidney function [8]. Ishani et al. reported a HR of 41.2 for AoC (79.5 cases per 1000 patients) compared with controls in
a cohort of over 233,000 elderly hospitalised patients [9]. Another community-based study of over 39,000 individ-uals found dialysis-requiring AoC increased the risk of developing ESRD by 30 % compared with CKD without AKI [26]. Clearly CKD patients have a much higher risk than the general population of developing ESRD and the risk is directly proportional to GFR reduction. Risk of developing ESRD for CKD patients has been quantified in two studies as being between 4.14 and 6.37 per 1000 person years [27, 28]. Our findings of an ESRD IR per 1000 person years of 69.0 for CKD and 138 for AoC pa-tients admitted to ICU (presented in Table 5 as events per person year) is clearly far greater than the risk attrib-utable to natural progression of CKD alone.
The model of covariates predicting ESRD at 1 year in survivors produced an AUC of 94 %; this simple model is more discriminatory than any currently available novel biomarkers at identifying risk of ESRD [29, 30]. Model-ling of ESRD is complex due to the fact that ESRD is not purely a biological endpoint (as GFR measurement is); it requires acceptance to a treatment programme, which excludes patients on the basis of old age or comorbidity.
[image:9.595.55.540.102.170.2]This study has limitations; it was affected by underre-porting, a problem common to most register studies of this magnitude. AKI diagnosis, interventions and in par-ticular renal replacement therapy, were not always re-corded, meaning that we were not exhaustively able to identify all patients with AKI and AoC disease. However, cases where these diagnoses were recorded should repre-sent those with the most severe disease. As a result, some patients with mild acute disease may have been misclassified to no renal disease or CKD only groups.
Table 5Secondary outcome; multivariable Poisson regression for risk of developing ESRD according to renal disease status
Group Patients (n) Events (n) Person years IR event/person year (95 % CI) Crude IRR (95 % CI) Adjusted IRRa(95 % CI)
No renal disease 92,509 116 1.7 × 10⁵ 0.0007 (0.0006–0.0008) 1 1
AKI 5273 65 5.2 × 10³ 0.0125 (0.0098–0.0160) 18.6 (13.7–25.2) 24.1 (13.9–42.0)
Chronic only 3194 237 3.4 × 10³ 0.069 (0.0611–0.0788) 103 (82.5–128.6) 96.4 (59.7–155.6)
Acute-on-chronic 998 111 803.1 0.1382 (0.1147–0.1665) 205.1 (158.1–266.1) 259 (156.9–429.1)
a
Adjusted for Simplified Applied Physiology Score version 3 score, age, gender and diabetes and dementia.
CIConfidence interval,IRIncidence rate,IRRIncidence rate ratio
Table 6Secondary outcome; Kaplan-Meier estimates of likelihood of developing ESRD at specific time points according to renal disease status
Group Probability of ESRD (%)
90 days 95 % CI 1 year 95 % CI 3 years 95 % CI 5 years 95 % CI
No renal disease 0.04 0.03–0.06 0.08 0.06–0.10 0.20 0.16–0.25 0.30 0.24–0.38
AKI 1.67 1.25–2.22 2.03 1.56–2.65 2.95 2.18–3.98 3.88 2.72–5.51
Chronic only 5.95 4.98–7.10 9.13 7.88–10.57 16.56 14.38–19.03 21.09 17.92–24.73
Acute-on-chronic 15.82 12.93–19.28 19.71 16.45–23.52 25.45 20.92–30.76 25.45 20.92–30.76
AKIacute kidney injury,ESRDEnd-stage renal disease,CI95 % confidence interval
[image:9.595.58.540.644.724.2]This would result in a type one error bringing differ-ences between groups towards the null. Despite this, sta-tistically significant differences were observed between the cohorts suggesting that identification of subjects was predominantly correct. We identified patients previously diagnosed with CKD using the NPR, but baseline cre-atinine and GFR measurements were unavailable, and thus some subjects may have suffered from undiagnosed CKD prior to admission to the ICU. Additionally it was not possible to acertain the exact CKD grade.
We excluded individuals with insufficient data for AKI categorisation. Analysis of the excluded subjects revealed that they were younger, with lower disease severity and had shorter LOS than the studied cohort (Additional file 3). Excluded subjects seemingly represent a healthier
group, with less AKI and AoC disease; their mortality rates were significantly lower than in the study cohort.
As a matter of convention, we present the SAPS-III score in our fully adjusted regression model. However, one of the components of SAPS-III is creatinine which itself was used to define AKI and non-AKI groups. We were unable to remove“renal points” which may lead to over-adjustment. Similarly, including other covariates common to SAPS-III such as age, acute surgery and ma-lignancy in regression models may compound risk of over-adjustment.
The strengths of this study lie in the use of well vali-dated, reliable national databases, which allowed us to categorise subjects based on pre-ICU renal status and al-most uniquely permitted identification of a large ICU control population for comparison. Completeness of outcome data enabled us to accurately describe long-term mortality and ESRD incidence. Thus, we suggest that the study has a high degree of internal validity. The scale of the cohort and high coverage of ICU admissions from both general and speciality ICUs should allow gen-eralisation to other national ICU populations making the external validity of our study high.
Conclusion
[image:10.595.57.290.121.229.2]In one of the largest studies examining the effect of pre-ICU renal disease status on outcome after pre-ICU, we dem-onstrated that ESRD patients have mortality similar to that of AKI subjects. These patients may represent a healthier subsection of the ESRD cohort. Nonetheless, overly negative prognostication for this group is not merited. Patients with prior CKD and particularly AoC were demonstrated to have elevated risk of death and a
Table 7Competing risks model for predicting risk of ESRD in 1-year ICU survivors by polynomial multivariable logistic regression analysis
Covariate Relative risk ratioa(95 % CI) Pvalue
Female gender 1.12(0.48–2.63) 0.787
Congestive heart failure 0.091 (0.011–0.690) 0.020
Admission serum potassium high (>4.59)
4.6 (1.30–16.40) 0.018
AKI 30.4 (5.98–154) <0.001
CKD 265.7 (55.1–1280) <0.001
AoC 356.6 (69.9–1811) <0.001
Reference category = male, no comorbidity (according to Charlson index), admission potassium (3.9–4.59), no renal disease
a
Risk of ESRD versus survival without ESRD relative to the reference category
AKIAcute kidney injury,AoCAcute-on-chronic kidney disease,CIConfidence interval,CKDChronic kidney disease
Fig. 3Area under the receiver operating characteristic (ROC) curve for competing-risk model predicting likelihood of ESRD among 1-year survivors
[image:10.595.60.539.501.714.2]strikingly high relative risk of developing ESRD. These results establish that nephrological follow-up is impera-tive for all CKD patients surviving critical care and in particular those with AoC and those with elevated potas-sium on admission. Clearly the implications for planning and provision of nephrology and dialysis facilities are substantial because increasing numbers of CKD patients are being admitted to ICU with a greatly elevated risk of developing ESRD.
Key messages
Patients presenting to ICU with pre-existing renal dysfunction have a high risk of death and of developing ESRD. Patients with CKD who survive ICU should receive nephrological follow-up.
Additional files
Additional file 1:Swedish health registers.Details of the Swedish National health registers. (DOCX 30 kb)
Additional file 2:ICD-10 codes Charlson Comorbidity renal disease.
List of ICD-10 codes used in Charlson Comorbidity Index to define (moderate to severe) renal disease. (DOCX 16 kb)
[image:11.595.305.539.220.738.2]Additional file 3:Excluded cases.Details of excluded cases including table of demographic and outcome data. (DOCX 24 kb)
Abbreviations
AKI:Acute kidney injury; AoC: Acute-on-chronic disease; APACHE: Acute Physiology and Chronic Health Evaluation; AUC: Area under the curve; CI: Confidence interval; CKD: Chronic kidney disease; CRRT: Continuous renal replacement therapy; ESRD: End-stage renal disease; GFR: Glomerular filtration rate; HR: Hazard ratio; ICD-10: International Classification of Diseases version 10; ICU: Intensive care unit; IHD: Intermittent haemodialysis; IQR: Interquartile range; IRR: Incidence rate ratios; KDIGO: Kidney Disease Improving Global Outcomes; LOS: Length of ICU stay; MRR: Mortality rate ratio; NPR: National patient register; ROC: rReceiver operating characteristic; RRR: Relative risk ratios; SAPS: Simplified Acute Physiology Score; SIR: Swedish Intensive care register; SRR: Swedish renal register.
Competing interests
MBe reports personal fees from Astute Medical, grants and personal fees from Gambro/Baxter and personal fees from Fresenius, outside the submitted work. JM reports travel grants from Gambro. CR-S reports receiving a lecture fee and travel expenses from Gambro/Baxter. MBo, C-RM and PF declare that they have no competing interests.
Author’s contributions
CR-S designed the study, performed statistical analysis, interpreted the data and drafted the manuscript. MBe conceived the study, analysed and interpreted the data and drafted the manuscript. PF processed and cleaned the data as well as contributing to data analysis and manuscript drafting. JM analysed, interpreted the data and drafted the manuscript. MBo performed statistical analysis and data interpretation as well as contributing to drafting of the manuscript. C-RM participated in study design, data interpretation and manuscript drafting. All authors read, contributed to, and approved the final version of the manuscript.
Acknowledgements
We would like to thank the Swedish Intensive care register board and in particular Sten M Walther and Göran Karlström. This study was financed by grants from the Karolinska Institute, Stockholm County Council and Baxter Healthcare Corporation; the funding bodies have in no way or form been involved with design, data collection, analysis or interpretation of data.
Author details
1
Section of Anaesthesia and Intensive Care Medicine, Department of Physiology and Pharmacology, Karolinska Institute, Stockholm, Sweden. 2
Department of Anaesthesia, Surgical Services and Intensive Care (ANOPIVA) F2, Karolinska University Hospital, Solna 171 76 Stockholm, Sweden.3Unit of Biostatistics, Institute of Environmental Medicine (IMM), and Karolinska Institute, Stockholm, Sweden.4Department of Intensive Care, Austin Hospital, Melbourne, VIC, Australia.
Received: 21 August 2015 Accepted: 16 October 2015
References
1. Strijack B, Mojica J, Sood M, Komenda P, Bueti J, Reslerova M, et al. Outcomes of chronic dialysis patients admitted to the intensive care unit. J Am Soc Nephrol. 2009;20:2441–7.
2. Hutchison CA, Crowe AV, Stevens PE, Harrison DA, Lipkin GW. Case mix, outcome and activity for patients admitted to intensive care units requiring chronic renal dialysis: a secondary analysis of the ICNARC Case Mix Programme Database. Crit Care. 2007;11:R50.
3. Kidney Disease: Improving Global Outcomes (KDIGO) CKD Work Group. KDIGO 2012 Clinical Practice Guideline for the Evaluation and Management of Chronic Kidney Disease. Kidney inter., Suppl. 2013;3:1–150.
4. Go AS, Chertow GM, Fan D, McCulloch CE, Hsu C-Y. Chronic kidney disease and the risks of death, cardiovascular events, and hospitalization. N Engl J Med. 2004;351:1296–305.
5. Hallan SI, Matsushita K, Sang Y, Mahmoodi BK, Black C, Ishani A, et al. Age and association of kidney measures with mortality and end-stage renal disease. JAMA. 2012;308:2349–60.
6. Tonelli M, Wiebe N, Culleton B, House A, Rabbat C, Fok M, et al. Chronic kidney disease and mortality risk: a systematic review. J Am Soc Nephrol. 2006;17:2034–47.
7. Nitsch D, Grams M, Sang Y, Black C, Cirillo M, Djurdjev O, et al. Associations of estimated glomerular filtration rate and albuminuria with mortality and renal failure by sex: a meta-analysis. BMJ. 2013;346:f324–4.
8. Wu V-C, Huang T-M, Lai C-F, Shiao C-C, Lin Y-F, Chu T-S, et al. Acute-on-chronic kidney injury at hospital discharge is associated with long-term dialysis and mortality. Kidney Int. 2011;80:1222–30.
9. Ishani A, Xue JL, Himmelfarb J, Eggers PW, Kimmel PL, Molitoris BA, et al. Acute kidney injury increases risk of ESRD among elderly. J Am Soc Nephrol. 2009;20:223–8.
10. Dara SI, Afessa B, Bajwa AA, Albright RC. Outcome of patients with end-stage renal disease admitted to the intensive care unit. Mayo Clin Proc. 2004;79:1385–90.
11. Chan M, Ostermann M. Outcomes of chronic hemodialysis patients in the intensive care unit. Crit Care Res Pract. 2013;2013:715807.
12. Allegretti AS, Steele DJR, David-Kasdan JA, Bajwa E, Niles JL, Bhan I. Continuous renal replacement therapy outcomes in acute kidney injury and end-stage renal disease: a cohort study. Crit Care. 2013;17:R109.
13. Gammelager H, Christiansen CF, Johansen MB, Tønnesen E, Jespersen B, Sørensen HT. Five-year risk of end-stage renal disease among intensive care patients surviving dialysis-requiring acute kidney injury: a nationwide cohort study. Crit Care. 2013;17:R145.
14. Stigare C, Frumento P, Bottai M, Mårtensson J, Martling C-R, Walther SM, et al. Evolution of chronic renal impairment and long-term mortality after de novo acute kidney injury in the critically ill; a Swedish multi-centre cohort study. Crit Care. 2015;19:221.
15. Charlson ME, Pompei P, Ales KL, MacKenzie CR. A new method of classifying prognostic comorbidity in longitudinal studies: development and validation. J Chronic Dis. 1987;40:373–83.
16. Uchino S, Kellum JA, Bellomo R, Doig GS, Morimatsu H, Morgera S, et al. Acute renal failure in critically ill patients: a multinational, multicenter study. JAMA. 2005;294:813–8.
17. Bottai M, Zhang J. Laplace regression with censored data. Biom J. 2010;52:487–503.
18. Lebiedz P, Knickel L, Engelbertz C, Lüders F, Gebauer K, Berdel WE, et al. Impact of preexisting chronic kidney disease on acute and long-term outcome of critically ill patients on a medical intensive care unit. J Nephrol. 2014;27:73–80. 19. Khosla N, Soroko SB, Chertow GM, Himmelfarb J, Ikizler TA, Paganini E, et al.
Preexisting chronic kidney disease: a potential for improved outcomes from acute kidney injury. Clin J Am Soc Nephrol. 2009;4:1914–9.
20. Bell M, Granath F, Schön S, Löfberg E, SWING, Ekbom A, et al. End-stage renal disease patients on renal replacement therapy in the intensive care unit: short- and long-term outcome. Crit Care Med. 2008;36:2773–8. 21. Juneja D, Prabhu MV, Gopal PB, Mohan S, Sridhar G, Nayak KS. Outcome of
patients with end stage renal disease admitted to an intensive care unit in India. Ren Fail. 2010;32:69–73.
22. Ostermann M, Chang R, Riyadh ICU Program Users Group. Renal failure in the intensive care unit: acute kidney injury compared to end-stage renal failure. Crit Care. 2008;12:432.
23. Arulkumaran N, Annear NMP, Singer M. Patients with end-stage renal disease admitted to the intensive care unit: systematic review. Br J Anaesth. 2013;110:13–20.
24. Hotchkiss JR, Palevsky PM. Care of the critically ill patient with advanced chronic kidney disease or end-stage renal disease. Curr Opin Crit Care. 2012;18:599–606.
25. AkbaşT, Karakurt S, Tuğlular S. Renal replacement therapy in the ICU: comparison of clinical features and outcomes of patients with acute kidney injury and dialysis-dependent end-stage renal disease. Clin Exp Nephrol. 2014;19:701–9.
26. Hsu C-Y, Chertow GM, McCulloch CE, Fan D, Ordoñez JD, Go AS. Nonrecovery of kidney function and death after acute on chronic renal failure. Clin J Am Soc Nephrol. 2009;4:891–8.
27. Dalrymple LS, Katz R, Kestenbaum B, Shlipak MG, Sarnak MJ, Stehman-Breen C, et al. Chronic kidney disease and the risk of end-stage renal disease versus death. J Gen Intern Med. 2011;26:379–85.
28. Mahmoodi BK, Matsushita K, Woodward M, Blankestijn PJ, Cirillo M, Ohkubo T, et al. Associations of kidney disease measures with mortality and end-stage renal disease in individuals with and without hypertension: a meta-analysis. Lancet. 2012;380:1649–61.
29. Bell M, Larsson A, Venge P, Bellomo R, Mårtensson J. Assessment of cell-cycle arrest biomarkers to predict early and delayed acute kidney injury. Dis Markers. 2015;2015:158658–9.
30. Mårtensson J, Glassford NJ, Jones S, Eastwood GM, Peck L, Ostland V, et al. Urinary neutrophil gelatinase-associated lipocalin to hepcidin ratio as a biomarker of acute kidney injury in intensive care unit patients. Minerva Anestesiol. 2014 Dec 5 [Epub ahead of print].
Submit your next manuscript to BioMed Central and take full advantage of:
• Convenient online submission
• Thorough peer review
• No space constraints or color figure charges
• Immediate publication on acceptance
• Inclusion in PubMed, CAS, Scopus and Google Scholar
• Research which is freely available for redistribution
Submit your manuscript at www.biomedcentral.com/submit