R E S E A R C H A R T I C L E
Open Access
Vaccination uptake among Australian early
childhood education staff: assessing
perceptions, behaviours and workplace
practices
Holly Seale
1*, Stephanie Dwyer
1, Alamgir Kabir
1and Rajneesh Kaur
2Abstract
Background:Early Childhood Education Centre (ECEC) staff are strongly recommended to receive several
immunizations including influenza and pertussis. However, evidence regarding the uptake is either old or lacking across all Australian States/Territories. This study aimed to explore the attitudes and barriers around ECEC staff vaccination and the immunisation policy/practices employed at their workplaces.
Methods: An online cross-sectional survey was undertaken of staff members (administrators and childcare
center staff) in early 2017. We compared the individual’s knowledge, attitude and practices as well as the centre’s policy and practice variables between the vaccinated and unvaccinated respondents. A logistic model was used to identify the factors associated with uptake of the different vaccines.
Results: A total of 575 ECEC staff completed the survey. Sixty percent reported being aware of the recommendations about staff immunisation. While participants did acknowledge that they could spread diseases if unvaccinated (86%), 30% could not recall receiving a dTpa in the last 10 years. Private centres were less likely to provide free or onsite vaccination compared to other categories of centres. Less than half reported receiving any encouragement to get the influenza vaccine and only 33% reported that their centre provides onsite influenza vaccination. Regarding the introduction of mandatory policies, 69% stated that they would support a policy.
Conclusion:Employers should consider supporting methods to maximize vaccination of their employees including providing free onsite vaccination. Participants were open to idea of mandatory vaccination; however, this needs to be explored further to determine how vaccine costs and access issues could be resolved.
Keywords:Immunization, Vaccine, Pediatric, Childcare, Influenza, Pertussis
Background
The Australian Immunisation Handbook recognises Early Childhood Education Centre (ECEC) staff (i.e. those working in childcare, long day care, preschool) as an occupation at increased risk of some vaccine prevent-able diseases. People who work with children are ‘strongly recommended’ to have measles mumps rubella (MMR) vaccine (if non-immune), pertussis (dTpa), vari-cella (if non-immune) and hepatitis A. Staff members
should also‘consider’having the influenza vaccine. Add-itional vaccinations are recommended for special cat-egories of educators and other staff: hepatitis B for staff who care for children with intellectual disabilities and Japanese encephalitis for those who work in the outer Torres Strait islands for 1 month or more during the wet season. There are currently no mandatory immunisation requirements for Australian ECEC staff members. There is also no supportive funding for vaccines or vaccine administration.
In addition to the Immunisation Handbook, the Australian Government National Health and Medical Research Council published a guideline‘Staying Healthy:
© The Author(s). 2019Open AccessThis article is distributed under the terms of the Creative Commons Attribution 4.0 International License (http://creativecommons.org/licenses/by/4.0/), which permits unrestricted use, distribution, and reproduction in any medium, provided you give appropriate credit to the original author(s) and the source, provide a link to the Creative Commons license, and indicate if changes were made. The Creative Commons Public Domain Dedication waiver (http://creativecommons.org/publicdomain/zero/1.0/) applies to the data made available in this article, unless otherwise stated. * Correspondence:h.seale@unsw.edu.au
preventing infectious diseases in early childhood educa-tion and care services [1]. Aside from reinforcing the im-munisation recommendations, it also stresses that ‘all education and care service staff should be advised of the potential consequences if they refuse reasonable requests for immunisation’. These consequences could include: (1) being restricted to working with children over 12 months old; (2) potentially having to take antibiotics during outbreaks of bacterial diseases that are vaccine preventable; and (3) being excluded from work during outbreaks of vaccine-preventable diseases (even if the educator is not ill). It goes on to recommend that ‘em-ployers should develop staff immunisation policy, de-velop and maintain immunisation records, provide staff with information about vaccine preventable diseases (through in-services training and written material), and take all reasonable steps to encourage non-immune staff to be vaccinated’. Although these guidelines provide for exclusions and encourage vaccination, they are currently not supported by accreditation and licensing requirements.
In 2016, changes were made to the Australian legal-isation around the immunlegal-isation requirements of chil-dren attending kindergarten, long day care, family day care or an occasional care service. Known as the Ser-vices Legislation Amendment (No Jab, No Pay/Play) Bill 2015, children need to be fully vaccinated (in ac-cordance with the National Immunisation Program early childhood vaccination schedule, on an approved catch-up schedule or have an approved exemption.) in order to either receive family tax benefits payments and/or in some States/Territories to attend the facil-ity. Vaccine objection (previously known as conscien-tious objection) is no longer an exemption category. The introduction of the legislation was suggested by some as being coercive because it links the payment of government benefits for childcare to vaccination compliance [2]. Since the introduction of the legisla-tion, the 12 month vaccination coverage has reported to have increased from 92.3 to 93.2% in 2016 [3].
While there is ongoing attention paid to the im-munisation of children, there has been little given to the level of coverage amongst staff members. To the best of our knowledge, the last study undertaken on ECEC staff immunization, policy and practice within the Australian child care setting, took place in 2010 [4]. Since this time, the childcare industry has under-gone significant growth and regulatory changes. Three notable changes include: (1) the improved educator to child ratio 1:4 (0–2 years) and 1:5 (2–3 years); (2) the requirement for all staff to attain at least a Certificate III qualification and (3) the introduction of the “no jab no pay or play” immunisation strategy (http:// www.ncirs.edu.au/consumer-resources/no-jab-no-play-no-jab-no-pay-policies).
Australian childcare services care for an estimated 1.2 million children under 12 [5], with approximately 17,000 public and private operated, government approved child-care centres catering for children aged 6 weeks to 12 years old [5]. These centres provide formal care through long day care (LDC), family day care (FDC), out of school hours (OOSH), vacation care (VC) and to a lesser extent pre-school [6]. To date there has been very few studies conducted looking at the knowledge, attitudes and practices of ECEC staff towards immunisation [7]. This study examined the immunisation status of ECEC staff members as well as their attitudes towards and bar-riers against occupational vaccination. It also examined their awareness and perceptions towards their em-ployer’s immunisation policies and practices.
Methods
Approach
A link to an online questionnaire (using SurveyMonkey) was distributed to ECEC staff members via two ap-proaches. Firstly, an information sheet and link to an an-onymous electronic survey was distributed to members of the Australian Childcare Alliance (ACA). The ACA is the national peak body that represents childcare pro-viders across Australia (approximately 2500 members). Secondly, the study was advertised via the Early Child-hood Australia (national peak body for early childChild-hood) newsletter and their social media pages (membership numbers unknown). The survey was available online in early 2017. Members of these peak national bodies in-clude those working in a range of ECEC settings: pre-school, long day care, family day care, occasional care, mobile services and specialist programs.
The study was approved by the University of New South Wales Human Research Ethics Panel. Consent was implied if the participants completed and submitted the survey,
Instrument
combination vaccines (i.e. dTpa). This may have affected the accuracy of the reporting. In addition, the question-naire assessed attitudes regarding a proposed staff mandatory vaccination policy. A staff mandatory vaccin-ation policy was defined as a policy requiring all staff ex-cept those with a medical contraindication to receive all recommended vaccines to remain employed. Knowledge and attitudes questions were examined by extent of agreement with statements about each vaccine, using a five-point Likert scale (i.e., disagree strongly, disagree somewhat, somewhat agree, and strongly agree, neither agree nor disagree) (Additional file1).
Data analysis
Survey responses using a likert scale were categorized as
“expressed agreement” if respondents marked “strongly
agree”or“somewhat agree”and as“expressed disagreement” if respondents marked“strongly disagree”or“somewhat dis-agree”or“neither agree or disagree”. All the categorical vari-ables were summarised as number (%). Characteristics of the childcare centre and their employees were compared be-tween those who reported receipt of each vaccine and those who denied receipt of the respective vaccine using chi-square, or fisher exact and Wilcoxon Signed ranks test wherever appropriate. Vaccine coverage for each vaccine was compared to coverage of influenza vaccines in years 2015 and 2016 using McNemar test for paired data. We compared the responses for the knowledge, attitude and practice questions as well as the questions relating to the centre’s policy and practices between the vaccinated and un-vaccinated respondents using Pearson’s Chi Square test. We used a multiple logistic model to identify the factors associ-ated with uptake of different vaccines. We put all the vari-ables that were significantly associated with the specific vaccine uptake based on the bivariate analysis at p< 0.20 into the multiple logistic model. However, the variables fo-cused on the centre’s policy and practices had to be re-moved despite their significant association in the model as they were too many missing values. A backward elimination approached was used based on Akaike Information Criter-ion to keep the important variables in the final model. We also compared the responses of staff working in privately operated centres with those from other types of centres. All tests were two-tailed, and statistical significance was set at
P< 0.05. All the analyses were conducted using R3.4.2.
Results
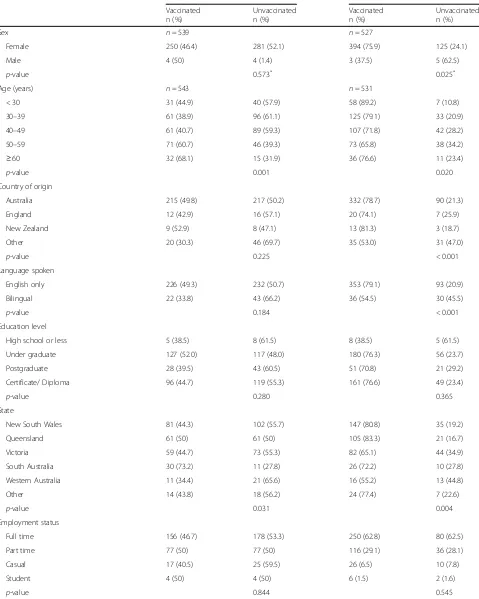
A total of 576 surveys were commenced and 575 com-pleted. Of the participants, the majority were female (99%), aged 30 years or older (86%) and spoke only Eng-lish (87%). Around 50% had been in the ECEC workforce for 16 years or more (47%), with a similar number reporting that they worked in a privately-operated centre (50.4%) (Table 1). The survey respondents were
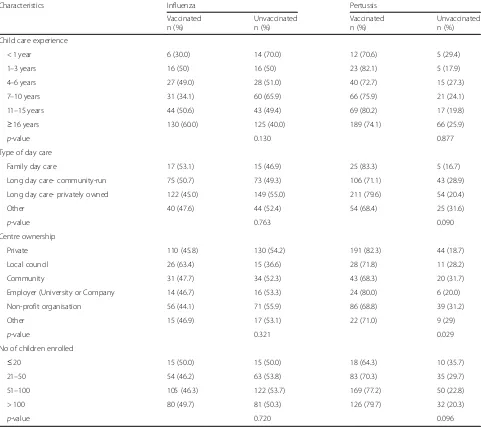
representative of the workforce in age and gender, how-ever our survey participants had been in the ECEC workforce longer than average number of years reported in the 2016 ECEC National Workforce Census [11]. Just under half (47.1, 95% CI: 43.0, 51.3) reported receiving an influenza vaccine in 2016. While tetanus uptake was close to 91% (95% CI: 89, 93), uptake for the other vac-cines was lower with ranges between 48 and 76% (Table 2). There was no significant difference in the rates of influenza vaccine in 2016 compared to 2015 (P= 0.539). The number receiving the hepatitis vaccine was much larger (364/482, 75.5%) compared to those getting influenza vaccine (256/543, 47.1%) in 2016. This difference was of high statistical significance (P< 0.001). Similarly, the rates of hepatitis B vaccine were signifi-cantly (P< 0.001) higher than those receiving the influ-enza vaccine (260/542, 48%) in 2015. Hepatitis B was significantly (p< 0.001) received by a lower number (364/482, 75.5%) of individuals than those receiving tet-anus vaccine, which was received by (483/529, 91.3%) participants (Table2).
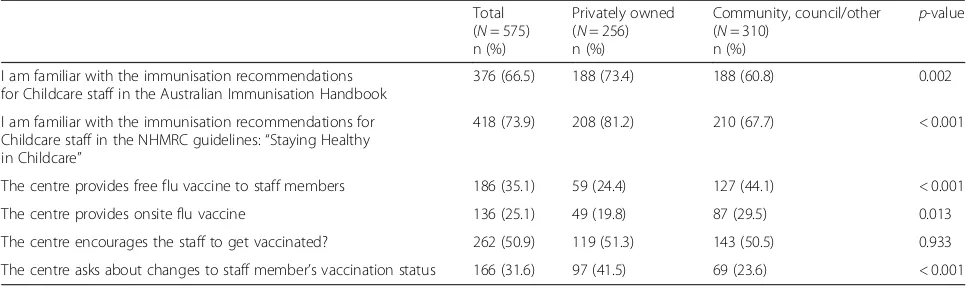
The responses to the attitudinal questions focused on workplace vaccination policy and practices are presented in Table 3. Not all participants were aware of immunization recommendations outlined in the Australian Immunisation Handbook (67%), though pertussis vaccine recipients were more likely to be aware than the unvaccinated (71% vs 54%,
p= 0.001). A slightly higher proportion reported being aware of the National Health and Medical Research Coun-cil (NHMRC) guidelines, with individuals reporting pertus-sis vaccination again being more likely to be aware than the unvaccinated individuals (78% vs 62%, p< 0.001). Eighty-four percent agreed that ECEC staff should be offered vaccination free of charge, with a significantly higher pro-portion of the vaccinated individuals agreeing with this statement compared to the unvaccinated individuals (88% vs 70%,p< 0.001).
Table 1Descriptive statistics of the study sample
Characteristics Influenza Pertussis
Vaccinated n (%)
Unvaccinated n (%)
Vaccinated n (%)
Unvaccinated n (%)
Sex n= 539 n= 527
Female 250 (46.4) 281 (52.1) 394 (75.9) 125 (24.1)
Male 4 (50) 4 (1.4) 3 (37.5) 5 (62.5)
p-value 0.573* 0.025*
Age (years) n= 543 n= 531
< 30 31 (44.9) 40 (57.9) 58 (89.2) 7 (10.8)
30–39 61 (38.9) 96 (61.1) 125 (79.1) 33 (20.9)
40–49 61 (40.7) 89 (59.3) 107 (71.8) 42 (28.2)
50–59 71 (60.7) 46 (39.3) 73 (65.8) 38 (34.2)
≥60 32 (68.1) 15 (31.9) 36 (76.6) 11 (23.4)
p-value 0.001 0.020
Country of origin
Australia 215 (49.8) 217 (50.2) 332 (78.7) 90 (21.3)
England 12 (42.9) 16 (57.1) 20 (74.1) 7 (25.9)
New Zealand 9 (52.9) 8 (47.1) 13 (81.3) 3 (18.7)
Other 20 (30.3) 46 (69.7) 35 (53.0) 31 (47.0)
p-value 0.225 < 0.001
Language spoken
English only 226 (49.3) 232 (50.7) 353 (79.1) 93 (20.9)
Bilingual 22 (33.8) 43 (66.2) 36 (54.5) 30 (45.5)
p-value 0.184 < 0.001
Education level
High school or less 5 (38.5) 8 (61.5) 8 (38.5) 5 (61.5)
Under graduate 127 (52.0) 117 (48.0) 180 (76.3) 56 (23.7)
Postgraduate 28 (39.5) 43 (60.5) 51 (70.8) 21 (29.2)
Certificate/ Diploma 96 (44.7) 119 (55.3) 161 (76.6) 49 (23.4)
p-value 0.280 0.365
State
New South Wales 81 (44.3) 102 (55.7) 147 (80.8) 35 (19.2)
Queensland 61 (50) 61 (50) 105 (83.3) 21 (16.7)
Victoria 59 (44.7) 73 (55.3) 82 (65.1) 44 (34.9)
South Australia 30 (73.2) 11 (27.8) 26 (72.2) 10 (27.8)
Western Australia 11 (34.4) 21 (65.6) 16 (55.2) 13 (44.8)
Other 14 (43.8) 18 (56.2) 24 (77.4) 7 (22.6)
p-value 0.031 0.004
Employment status
Full time 156 (46.7) 178 (53.3) 250 (62.8) 80 (62.5)
Part time 77 (50) 77 (50) 116 (29.1) 36 (28.1)
Casual 17 (40.5) 25 (59.5) 26 (6.5) 10 (7.8)
Student 4 (50) 4 (50) 6 (1.5) 2 (1.6)
vaccination status. The factors associated with up-take of influenza vaccination: believing that the vac-cine protect against illness (Adj. OR: 4.15, 95% CI: 1.44, 12.88), agreeing with the importance of receiv-ing the vaccine each year (Adj. OR: 9.24, 95% CI: 4.16, 21.31) and being happy to pay for it (Adj. OR: 3.13, 95% CI: 1.41, 6.78). Whereas factors associated with hepatitis A vaccine uptake included: agreeing in the importance of the vaccine (Adj. OR: 5.11, 95% CI: 2.04, 13.33), being aged > 30 years, and working in a centre with between 50 and 100 children (Adj. OR: 4.12, 95% CI:1.20, 13.86) (Table 4).
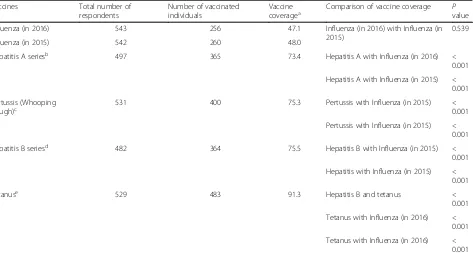
Table 5 presents the differences in knowledge and attitudes amongst participants working in privately owned centres versus other types of centres.
Participants from private centres were more likely to be familiar with the immunisation recommendations. One-fourth of participants from privately-owned cen-tres reported that their centre provides flu vaccine free of cost while about half of the staffs from centres owned by others reported the same (p< 0.001). About 20% of participants from the privately-owned centres reported that their centre provides onsite flu vaccine while 30% of participants from other types of centres reported onsite access (p= 0.013).
Discussion
[image:5.595.58.539.100.527.2]Overall, we found mixed levels of awareness regarding the recommendations for vaccination of ECEC staff. Par-ticipants reported that not all centres have individual Table 1Descriptive statistics of the study sample(Continued)
Characteristics Influenza Pertussis
Vaccinated n (%)
Unvaccinated n (%)
Vaccinated n (%)
Unvaccinated n (%)
Child care experience
< 1 year 6 (30.0) 14 (70.0) 12 (70.6) 5 (29.4)
1–3 years 16 (50) 16 (50) 23 (82.1) 5 (17.9)
4–6 years 27 (49.0) 28 (51.0) 40 (72.7) 15 (27.3)
7–10 years 31 (34.1) 60 (65.9) 66 (75.9) 21 (24.1)
11–15 years 44 (50.6) 43 (49.4) 69 (80.2) 17 (19.8)
≥16 years 130 (60.0) 125 (40.0) 189 (74.1) 66 (25.9)
p-value 0.130 0.877
Type of day care
Family day care 17 (53.1) 15 (46.9) 25 (83.3) 5 (16.7)
Long day care- community-run 75 (50.7) 73 (49.3) 106 (71.1) 43 (28.9)
Long day care- privately owned 122 (45.0) 149 (55.0) 211 (79.6) 54 (20.4)
Other 40 (47.6) 44 (52.4) 54 (68.4) 25 (31.6)
p-value 0.763 0.090
Centre ownership
Private 110 (45.8) 130 (54.2) 191 (82.3) 44 (18.7)
Local council 26 (63.4) 15 (36.6) 28 (71.8) 11 (28.2)
Community 31 (47.7) 34 (52.3) 43 (68.3) 20 (31.7)
Employer (University or Company 14 (46.7) 16 (53.3) 24 (80.0) 6 (20.0)
Non-profit organisation 56 (44.1) 71 (55.9) 86 (68.8) 39 (31.2)
Other 15 (46.9) 17 (53.1) 22 (71.0) 9 (29)
p-value 0.321 0.029
No of children enrolled
≤20 15 (50.0) 15 (50.0) 18 (64.3) 10 (35.7)
21–50 54 (46.2) 63 (53.8) 83 (70.3) 35 (29.7)
51–100 105 (46.3) 122 (53.7) 169 (77.2) 50 (22.8)
> 100 80 (49.7) 81 (50.3) 126 (79.7) 32 (20.3)
p-value 0.720 0.096
*
policies regarding staff vaccination, nor do they track uptake. Of concern, was the finding that not all centres are advocating for staff vaccination and very few are pro-viding onsite access. It is perhaps not surprising that we found mixed results when it came to actual vaccine up-take, especially for influenza. Apart from the data pre-sented in this study, there have been few previous attempts to document vaccine uptake in the childcare sector. One study conducted by Spokes et.al over 10 years ago, involved a survey of New South Wales based childcare directors (n= 437) to determine their level of knowledge towards the NHMRC recommendations for the immunisation of child-care workers and to ascertain whether the knowledge had translated into practices [12]. The study found that only 49% of the respondents were aware of the policy and just over half had a staff immunisation policy in place. Fast forward to 2017 and while there have been marginal increases in knowledge levels, there has been little in the way of improvements in meeting the NHMRC recommendations. In support of our findings, Spokes et.al also identified that centres that were operating for profit were significantly less likely to offer to pay all or part of the cost of immunisa-tion of staff. Centres that were aware of the NHMRC recommendations and identified as part of a larger or-ganisation were significantly more likely to offer to pay the whole or part of the cost of immunisation. However,
this did not remain significant in the multivariate logistic regression [12].
Interestingly, overwhelmingly participants acknowl-edged that influenza can spread from children to staff member but only 40% agreed that their level of risk was heightened. Encouragingly 60% acknowledge that they felt they had an obligation to be vaccinated against the flu to reduce the risk to the children in their care. How-ever, obligation or willingness to get vaccinated does not always translate to actual receipt with only 50% of par-ticipants reported receiving a flu vaccine in 2016. Most of our knowledge about occupational influenza vaccin-ation comes from examining uptake amongst hospital healthcare workers and aged care staff. In those settings, multi-factorial components, such as attitudes, motiv-ation, perceived threat, beliefs, self-efficacy, and socio-cultural influences have all been found to impact on uptake [13].
[image:6.595.66.539.99.355.2]Inconvenience and cost of vaccination may be having an impact on uptake amongst ECEC staff. There was a positive response to the suggestion of free vaccination amongst participants. To date there has been little work done to examine the impact of free on-site influenza vaccination on childcare staff vaccination prevalence. A small study conducted in one childcare centre over four influenza seasons found that the introduction of free in-fluenza vaccination improved uptake (28 to 51%) [14]. In
Table 2Vaccine coverage among the study participants Vaccines Total number of
respondents
Number of vaccinated individuals
Vaccine
coveragea Comparison of vaccine coverage Pvalue
Influenza (in 2016) 543 256 47.1 Influenza (in 2016) with Influenza (in 2015)
0.539
Influenza (in 2015) 542 260 48.0
Hepatitis A seriesb 497 365 73.4 Hepatitis A with Influenza (in 2016) < 0.001
Hepatitis A with Influenza (in 2015) < 0.001
Pertussis (Whooping Cough)c
531 400 75.3 Pertussis with Influenza (in 2015) < 0.001
Pertussis with Influenza (in 2015) < 0.001
Hepatitis B seriesd 482 364 75.5 Hepatitis B with Influenza (in 2015) < 0.001
Hepatitis with Influenza (in 2015) < 0.001
Tetanuse 529 483 91.3 Hepatitis B and tetanus <
0.001
Tetanus with Influenza (in 2016) < 0.001
Tetanus with Influenza (in 2016) < 0.001 a
Coverage has been calculated as (n/N)*100
b
Two shots ever
c
In the last 10 years
d
Three shots ever
e
Table 3Comparison of attitudes across child care workers by vaccination status Totala
Respondents (N= 575) n (%)
Pertussis Influenza
Vaccinated (N= 400) n (%)
Unvaccinated (N= 131) n (%)
p-value Vaccinated (N= 256) n (%)
Unvaccinated (N= 287) n (%)
p-value
Awareness and attitudes towards policy
I am familiar with the immunisation recommendations for childcare staff in the Australian Immunisation Handbook
381 (66.6) 282 (70.9) 71 (54.2) 0.001 177 (69.4) 178 (62.2) 0.080
I am familiar with the immunisation recommendations for Childcare staff in the NHMRC guidelines
422 (73.6)) 313 (78.2) 80 (61.5) < 0.001 195 (76.5) 201 (70.0) 0.092
Childcare staff can play a role in disease spread if they do not get vaccinated
494 (85.9) 364 (91.0) 91 (69.5) < 0.001 242 (94.5) 226 (78.7) < 0.001
Children are required to be vaccinated, therefore staff should be as well
471 (82.1) 345 (86.2) 87 (66.9) < 0.001 237 (92.6) 206 (72.0) < 0.001
Vaccination can protect me from illness 498 (87.2) 363 (91.4) 96 (73.3) < 0.001 247 (97.2) 223 (78.0) < 0.001
Childcare staff should be offered vaccines free of charge
479 (83.7) 350 (87.9) 91 (69.5) < 0.001 230 (90.2) 223 (77.7) < 0.001
Attitudes towards specific infection and vaccine
Childcare workers have an obligation to be vaccinated against pertussis
486 (84.7) 361 (90.2) 86 (65.6) < 0.001 NAb NA
Pertussis can spread from children to childcare staff
505 (88.0) 369 (92.2) 96 (73.3) < 0.001 NA NA
It is important to me to receive the pertussis vaccine
478 (83.3) 370 (92.5) 73 (55.7) < 0.001 NA NA
I would receive the pertussis vaccine, even if I had to pay for it
394 (69.2) 327 (82.0) 45 (34.9) < 0.001 NA NA
I would receive the pertussis vaccine if it were offered to me for free
502 (87.8) 381 (95.2) 84 (64.6) < 0.001 NA NA
I would receive the pertussis vaccine if it were offered to me on-site
476 (83.5) 364 (91.5) 75 (58.1) < 0.001 NA NA
Childcare workers have an obligation to be vaccinated against the flu to reduce the risk of giving the infection to children
355 (61.8) NA NA 218 (85.2) 117 (40.8) < 0.001
Childcare staff should get a flu shot every year unless their doctor tells them they should not
349 (61.1) NA NA 223 (87.1) 109 (38.4) < 0.001
It is important to me to receive the flu vaccine every year
294 (51.5) NA NA 224 (87.8) 59 (20.6) < 0.001
I would receive the flu vaccine every year, even if I had to pay for it
282 (49.1) NA NA 217 (84.8) 57 (19.9) < 0.001
I would receive flu vaccine if it were offered to me free of charge
372 (64.8) NA NA 239 (93.4) 118 (41.1) < 0.001
I would receive the Flu vaccine every year if it were offered to me on-site
375 (65.6) NA NA 236 (92.2) 121 (42.5) < 0.001
ECEC specific approach
Centre have a specific policy around the vaccination of staff members
197 (43.4) 157 (48.2) 26 (25.7) < 0.001 86 (43.0) 93 (40.6) 0.617
Centre keep records of the vaccines that staff members have received
289 (59.6) 225 (64.1) 44 (41.9) < 0.001 135 (60.8) 135 (56.5) 0.346
Employer/supervisor encourage you to get vaccinated
268 (51.3) 204 (56.0) 46 (38.0) 0.001 168 (69.4) 94 (37.0) < 0.001
Employer/supervisor ask about changes to your vaccination status
167 (31.3) 137 (36.2) 21 (17.4) < 0.001 82 (33.9) 73 (27.7) 0.129
the healthcare setting, facilities often adopt a range of program strategies to try and improve influenza vaccin-ation uptake amongst healthcare workers. Most sites have attempted to remove these administrative barriers by providing on-site free vaccination services at conveni-ent times that are easily accessible by healthcare workers (HCWs) [15–17]. However, removal of these barriers alone may not necessarily lead to coverage rates above 70%. It has also been suggested in the healthcare setting that too much emphasis has been placed on initiatives like reminders, education, incentives, promotion in the workplace, and easy access to free vaccination, especially considering the small increases in HCW vaccination gained. It has been postulated that more energy needs to be placed on developing interventions which incorporate behavioural psychology and health behaviour change theories [13]. While these recommendations are squarely targeted at healthcare facilities, it could be reasoned that there is value in considering them when developing any interventions aimed at improving uptake in the early childhood education sector.
As previously mentioned, a booster dose of dTpa is recommended for childcare staff if 10 years has elapsed since a previous dose. Given the increased number of pertussis outbreaks documented recently in the United States and elsewhere [18], the finding that one third of participants had not received a booster in the last 10 years is concerning. While there is no evidence to link spread from childcare staff to the children in their care, there has been recent studies suggesting that cases of pertussis are not always linked to household contacts.
For example, a UK study which examined the sources of infection among household contacts of infants under 3 months of age with laboratory-confirmed pertussis, found no identifiable source of infection for half of the cases [19]. The authors proposed that the role of exter-nal contacts as source of transmission is often over-looked. Based on data from four countries, they concluded that, in the absence of an identifiable source within the household, around 1 in 3 babies hospitalized were infected by a contact outside the household. Per-haps not surprising that the risk of infection from these sources was suggested to depend on the frequency and intensity of contact [20]. Linking back to the childcare setting, infants (especially those not yet mobile) have
frequent and often prolonged close contact with child-care staff members, while they are being comforted, fed and changed. The study authors suggested that beyond routine vaccination of pregnant women, a cocooning strategy (vaccination of contacts of newborns to pro-duce a circle of protection around infants against the disease) that includes other household contacts like fathers, siblings and grandparents should be encour-aged [19]. However, there are other important con-tacts outside that proposed group include healthcare workers, early childhood health nurses, and childcare staff that should be considered.
While the idea of mandatory vaccination for childcare staff is not currently being debated, we felt it was useful to measure the current climate amongst participants to-wards the idea. We were surprised to see that a large proportion of participants would support mandatory vaccination in the sector. We are not the only ones to document this high level of support. Rebman et.al. also found that most of the parents and staff they surveyed supported a mandatory staff vaccination policy or agency certification program, with no differences in responses between parents versus staff [8]. In support of our find-ings, Rebman also found that both staff and administra-tors are more likely to support a mandatory policy if vaccines are offered onsite and free of charge. Only 10% of staff said they would quit if vaccines other than the already-required hepatitis A were mandatory. Further work needs to be undertaken to explore the climate around mandatory vaccination including the support from Australian parents and administrators and the strategies that could be used to govern the introduction.
[image:8.595.60.537.100.159.2]A major strength of this study is that it is the first to assess nationally current immunisation practices, as well as the level of support for mandatory vaccination policy which could be used in the future to drive strategy change. It is also the first to report the attitudes of child-care staff following the introduction of the new ‘no jab no pay/play’ legalisation. Limitations of this study in-clude the probability of social desirability and selection biases because individuals most interested in staff vac-cination were likely to respond. While we received re-sponses from childcare staff across all states/territories, some regional centres may not be appropriately repre-sented. We relied on self-reported vaccine uptake and Table 3Comparison of attitudes across child care workers by vaccination status(Continued)
Totala Respondents (N= 575) n (%)
Pertussis Influenza
Vaccinated (N= 400) n (%)
Unvaccinated (N= 131) n (%)
p-value Vaccinated (N= 256) n (%)
Unvaccinated (N= 287) n (%)
p-value
Centre provide onsite flu vaccination 140 (25.5) NA NA 88 (34.4) 51 (17.8) < 0.001
a
Denominator varies due to missing value
b
did not collect data on the uptake of combination vac-cines, rather we asked whether participants had received a vaccine against either ‘tetanus’or ‘pertussis’. This may have led to confusion and potential underestimation of
[image:9.595.59.544.98.643.2]vaccine uptake. Currently, we have no understanding of strategies used within ECEC settings around the docu-mentation, promotion and whether there is any follow up regarding the vaccination of childcare staff. Further
Table 4Factors associated with vaccination against influenza and pertussis
Factorsa Pertussis (n= 486b) Influenza (n= 506)
Adj. OR (95% CI) p-value Adj. OR (95% CI) p-value
Children are required to be vaccinated, therefore staff should be as well
0.48 (0.20, 1.08) 0.086 NIM
I am familiar with the immunisation recommendations for Childcare staff in the NHMRC guidelines:“Staying Healthy in ChildCare”
1.91 (1.03, 3.53) 0.038 NIM
Vaccination can protect me from illness NIMc 4.15 (1.44, 12.88) 0.010
Childcare staffs should be offered vaccines free of charge
1.98 (0.98, 3.93) 0.053 0.50 (0.21, 1.15) 0.104
It is important to me to receive the flu vaccine every year
NIM 9.24 (4.16, 21.31) < 0.001
I would receive the flu vaccine every year, even if I had to pay for it
NIM 3.13 (1.41, 6.78) 0.004
I would receive the flu vaccine if it were offered to me free of charge
NIM 2.13 (0.92, 4.99) 0.078
Pertussis can spread from children to childcare staff
1.85 (0.86, 3.91) 0.110 NIM
It is important to me to receive the pertussis vaccine
3.91 (1.69, 9.38) 0.002 NIM
I would receive the pertussis vaccine, even if I had to pay for it
6.80 (3.31, 14.20) < 0.001 NIM
Age, years
< 30 1 NIM
30–39 0.48 (0.16, 1.33) 0.174 NIM
40–49 0.21 (0.07, 0.57) 0.003 NIM
50–59 0.13 (0.04, 0.38) < 0.001 NIM
≥60 0.17 (0.04, 0.64) 0.009 NIM
Country of origin
Australia 1
England 1.98 (0.54, 8.77) 0.334 NIM
New Zealand 0.73 (0.16, 5.10) 0.719 NIM
Other 0.51 (0.21, 1.25) 0.134 NIM
Language Spoken. English 3.07 (1.27, 7.48) 0.013 2.40 (1.10, 5.19) 0.026
State
NSW 1 NIM
QLD 1.43 (0.64, 3.26) 0.390 NIM
VIC 0.57 (0.28, 1.17) 0.127 NIM
SA 0.37 (0.13, 1.11) 0.066 NIM
WA 0.28 (0.09, 0.84) 0.021 NIM
Other 1.00 (0.31, 3.50) 0.994 NIM
Child care experience a
We did not include the variables on centre’s policy and practice irrespective of their significant association in the bivariate analysis due to missing variables
b
No of observations used in the multiple logistic model
c
work will need to be undertaken to examine whether any activities occur regarding the promotion and/or de-livery of immunisation within centres. Lastly, we were unable to accurately calculate a response rate due to the strategies that were used to advertise the study via mail-ing lists/newsletters.
Conclusion
ECEC workers may be exposing themselves, the children they care for, colleagues, parents and community mem-bers to vaccine preventable diseases because they may not have received the recommended vaccines. This study of immunisation policy and practices in childcare identi-fied deficiencies in awareness towards recommendations, variations in practice around vaccine provision and rec-ord keeping and gaps in immunisation uptake. If centres are going to achieve higher coverage rates, then they must reduce the barriers to vaccination, namely through providing free onsite vaccination. Participants were open to idea of mandatory vaccination; however, this needs to be explored further to determine how vaccine costs and access issues could be resolved.
Additional file
Additional file 1:Survey tool. (DOCX 34 kb)
Abbreviations
ACA:Australian Childcare Alliance; ECEC: Early Childhood Education Centre;
FDC: Family day care; HCW: Healthcare workers; LDC: Long day care; NHMRC: National Health and Medical Research Council; OOSH: Out of school hours; VC: Vacation care
Acknowledgments
We would like to thank the Australian Childcare Alliance and Early Childhood Australia for distributing the information about the study. Additional thanks go to those ECEC staff who completed the survey.
Authors’contributions
HS conceived and designed this study and was responsible for data collection/analysis and development of the manuscript, with all authors contributed to updates to the final manuscript. SD contributed to a literature review to support the study and contributed to the survey development. AK
and RK contributed to the statistical analysis and write up of the results. All authors have read and approved the manuscript.
Funding
Not applicable
Availability of data and materials
De-identified data is available upon request from the corresponding author.
Ethics approval and consent to participate
The study was approved by the University of New South Wales Human Research Ethics Panel (HC17011). Information was provided about the study to potential participants and consent was implied if the participants completed and submitted the survey.
Consent for publication
Not applicable
Competing interests
Dr. Holly Seale has previously received funding from drug companies for investigator driven research and consulting fees to present at conferences/ workshops and develop resources (bio-CSL/Sequiris, GSK and Sanofi Pasteur). She has also participated in advisory board meeting for Sanofi Pasteur. Dr. Seale is an editorial board member for BMC Infectious Diseases. The other authors do not have anything to declare.
Author details
1
School of Public Health and Community Medicine, University of New South Wales, Level 2, Samuels Building, Randwick, Sydney, NSW 2031, Australia. 2
Psychosocial Research Group, Prince of Wales Clinical School, University of New South Wales, Sydney, Australia.
Received: 9 October 2018 Accepted: 29 August 2019
References
1. Australian Government National Health and Medical Research Council.
Staying healthy: preventing infectious diseases in earlychildhood education
and care services. 5th ed. Canberra; 2013.
https://www.nhmrc.gov.au/about- us/publications/staying-healthy-preventing-infectious-diseases-early-childhood-education-and-care-services.
2. Australian Government. Social services legislation amendment (no jab, no
pay) act 2015. In: Services S, editor. Senate community affairs legislation committee. Canberra: Commonwealth of Australia; 2015. ACT 158.
3. Porter C. No jab, no pay lifts immunisation rates. Canberra: Commonwealth
of Australia; 2016.
4. Hope K, Butler M, Massey P, Cashman P, Durrheim DN, Stephenson J,
Worley A. Pertussis vaccination in child care workers: room for improvement in coverage, policy and practice. BMC Pediatr. 2012;12:98.
5. The Social Research Centre. The national early childhood education and
[image:10.595.56.539.99.243.2]care (ECEC) workforce census 2013. Melbourne: PricewaterhouseCoopers Australia; 2014.
Table 5Attitudes towards immunisation policy and practices by participants from privately-owned versus those from other centres Total
(N= 575) n (%)
Privately owned (N= 256) n (%)
Community, council/other (N= 310)
n (%)
p-value
I am familiar with the immunisation recommendations for Childcare staff in the Australian Immunisation Handbook
376 (66.5) 188 (73.4) 188 (60.8) 0.002
I am familiar with the immunisation recommendations for Childcare staff in the NHMRC guidelines:“Staying Healthy in Childcare”
418 (73.9) 208 (81.2) 210 (67.7) < 0.001
The centre provides free flu vaccine to staff members 186 (35.1) 59 (24.4) 127 (44.1) < 0.001
The centre provides onsite flu vaccine 136 (25.1) 49 (19.8) 87 (29.5) 0.013
The centre encourages the staff to get vaccinated? 262 (50.9) 119 (51.3) 143 (50.5) 0.933
6. Australian Government. Employment outlook to November 2019. Canberra: Labour Market Research and Analysis Branch; 2015.
7. Australian Government. The Australian immunisation handbook, vol.
Publications approval number: 11162. 10th ed. Canberra: Australian Governmnet Department of Health; 2015.
8. Rebmann T, Wang J, Wilson KD, Gilbertson PG, Wakefield M. Parents’
and staff’s support for a childcare agency employee mandatory
vaccination policy or agency certification program. Am J Infect Control.
2016;44:799–804.
9. Tuckerman J, Thomas N, Marshall HS. Should professionals caring for
children be vaccinated? Community perspectives on health care and child
care worker immunisation. Vaccine. 2016;34(14):1726–32.
10. Rebmann T, Arnold LD, Elliott MB, Gilbertson PG, Wakefield M. Vaccination
for child clients and employees in St Louis childcare agencies: vaccine
uptake and policies versus parents’perceptions. Am J Infect Control. 2016;
44(9):1010–5.
11. Social Research Centre. 2016 early childhood education and care national
workforce census. Melbourne; 2017.https://docs.education.gov.au/system/
files/doc/other/2016_ecec_nwc_national_report_sep_2017_0.pdf.
12. Spokes PJ, Ferson MJ, Ressler KA. Staff immunisation: policy and practice in
child care. J Paediatr Child Health. 2011;47:530–4.
13. Corace K, Garber G. When knowledge is not enough: changing behavior to
change vaccination results. Hum Vaccin Immunother. 2014;10:2623–4.
14. Lee I, Thompson S, Lautenbach E, Gasink LB, Watson B, Fishman NO, Chen
Z, Linkin DR. Effect of accessibility of influenza vaccination on the rate of
childcare staff vaccination. Infect Control Hosp Epidemiol. 2008;29:465–7.
15. Black CL, Yue X, Ball SW, Donahue SMA, Izrael D, de Perio MA, Scott Laney
A, Williams WW, Lindley MC, Graitcer SB, et al. Influenza vaccination
coverage among health care personnel—United States, 2014–15 influenza
season. MMWR. 2015;64:993–9.
16. Sartor C, Tissot-Dupont H, Zandotti C, Martin F, Roques P, Drancourt M. Use
of a mobile cart influenza program for vaccination of hospital employees.
Infect Control Hosp Epidemiol. 2004;25:918–22.
17. Lee HY, Fong YT. On-site influenza vaccination arrangements improved
influenza vaccination rate of employees of a tertiary hospital in Singapore.
Am J Infect Control. 2007;35:481–3.
18. Aloe C, Kulldorff M, Bloom BR. Geospatial analysis of nonmedical vaccine
exemptions and pertussis outbreaks in the United States. Proceedings of
the National Academy of Sciences. 2017;114(27):7101–5.
19. Kara EO, Campbell H, Ribeiro S, Fry NK, Litt D, Eletu S, Amirthalingam G.
Survey of household contacts of infants with laboratory-confirmed pertussis infection during a national pertussis outbreak in England and Wales. Pediatr
Infect Dis J. 2017;36:140–5.
20. Wendelboe AM, Njamkepo E, Bourillon A, Floret DD, Gaudelus J, Gerber M,
Grimprel E, Greenberg D, Halperin S, Liese J, et al. Transmission of Bordetella
pertussis to young infants. Pediatr Infect Dis J. 2007;26:293–9.
Publisher’s Note