ADVISORY NOTE
To:
Director of Basic Education Division, Ghana Education
Service
From:
Advisory Unit on Decentralised Education Management,
BED, GES
Document number:
AN003-2013
Date:
25 March 2013
Re: Review Result of Annual District Performance Report 2011-12
Review Result of Annual District Performance Report
2011-12
March 2013
i
[Main point of this report]
1. Overview of the document review
The Advisory Unit on Decentralised Education Management (AUDEM) in the Ghana Education Service (GES) has gone through Annual District Performance Report (ADPR) 2011-12 submitted from MMD Directors of Education to see whether or not quality of the reports has been improved over the previous ADPR 2010-11. The ADPRs from 170 MMDs have been examined and key findings and recommendations are identified as below.
2. Key findings
• This time the submission rate was almost perfect except one district (Wasa Amenfi West District in the Western Region). Last year, in total 35 MMDs did not submit ADPRs.
• Overall, quality of the reports has slightly deteriorated. The percentage of the aggregated scores of all the MMDs against full scores in total is 50.5%, decreased by 1.4 point from 51.9%, the scoring of ADPR 2010-11. The highest score percentage was 92.9% marked by Bolgatanga Municipal in UER. As for the distribution of score percentages of the MMDs, the peak is at the range of 40-60%, same as last year.
• The total score has been positively influenced by good improvement on some of questions such as Q3(All guiding questions in the template are properly answered? ), Q5 (Results of activities listed in ADEOP are properly reported?) and Q6 (Is there any recommendation for the next cycle of ADEOP?). It must be due to enhanced understanding on reporting requirements among officers responsible for writing the reports. However, Q1 (The template revised this year is used in the ADPR?), Q4 (Is analysis on indicators in good quality?) and especially Q7 (Is financial status accurately reported?) have deteriorated. This means that the most important parts of the report still remain very poor.
3. Recommendations Formalities on reporting
1) Checking by the certificate holders
It is recommended that there should be a process established within the MMD office to check the reports before the submission to see whether or not these are meeting reporting requirements. Prior to finalisation by MMD directors, the holders of the training certificate (participants of the training programme on DEOPPR) should sign on the cover page to show that the reports are thoroughly checked by those who have been trained and are without any missing points or mistakes.
2) Giving strong budgetary sanction on ignorance of key reporting requirements
ii Quality of reporting
1) Continuous training
The training programme on DEOPPR should be continuously provided every year with focusing on more practical exercises on knowledge and skills for addressing actual problems demonstrated in the submitted reports rather than providing theoretical lectures without regard to the actual problems.
2) Involvement of the training certificate holders
It should be made sure that all the ADPRs should be signed by the training certificate holders to let them declare that their reports are free of errors and are along with all the reporting requirements, as recommended above.
3) Creating incentives for report writers
Unless report writers are effectively motivated to provide quality reports, even though good training is provided, they just repeat copying and pasting from last year's reports. There should be opportunities to create their incentives through peer pressure. The score ranking of MMDs on ADPR/ADEOP should be presented to training participants during the training prorgamme or should be disseminated to all the MMD Directors and Regional Directors. Even in the annual regional review meetings, if regional directors praise MMD directors with high score reports, it must create motivation.
Data discrepancy
As seen above, discrepancy of figures between ADPRs and EMIS data was not improved. To overcome this situation, the followings are recommended.
1) Online data entry (all data entered in MMDs)
The best way is to enable MMDs to go with online data entry accessing directly to the database at the headquarters to make the data source only one. As access to internet expands throughout MMDs, the online data entry should be also expanded in a step by step approach.
2) EMIS Data Website
In collaboration with the EMIS Team of the MOE, the ICT Team of the GES is currently preparing a website of EMIS data with support from JICA, which enable users to download required data for ADPR in the same format with the reporting template. Use of this website makes it easy for MMD officers to obtain required data without difficult handling. The website will contain all the data required for ADPR since 2001.
3) Use of the EMIS reporting module
1.
Introduction
[image:6.595.59.569.237.298.2]As an annual recurrent exercise, Annual District Performance Reports (ADPR) 2011-12 which covers the results of the Annual School Census conducted as of November 2011 and operations during the Fiscal Year 2011 have been developed by all the education offices of Metropolis, Municipalities and Districts (MMDs) and submitted to the regional offices and headquarters. Contrary to the ADPR 2010-11, its submission rate was greatly improved from 79.4% to 99.4%. Except Wasa Amenfi West District in the Western Region, all the MMD offices submitted their ADPRs 2011-12.
Table 1: Submission rate
Total AR BAR CR ER GAR NR UER UWR VR WR
ADPR 2011-12 99.4% 100.0% 100.0% 100.0% 100.0% 100.0% 100.0% 100.0% 100.0% 100.0% 94.1%
ADPR 2010-11 79.4% 59.3% 68.2% 76.5% 95.2% 100.0% 100.0% 77.8% 77.8% 72.2% 82.4%
Gap 20.0% 40.7% 31.8% 23.5% 4.8% 0.0% 0.0% 22.2% 22.2% 27.8% 11.8%
This report reviews quality of the submitted ADPR 2011-12 as done for ADPR 2010-11 to find out lessons learned and recommendations to further improve the quality of the document. This paper first goes through the evaluation questions that are used for the review and see results of scoring question by question to find challenges and present detailed recommendations.
2. Evaluation questions
[image:6.595.59.489.538.774.2]Evaluation questions are almost the same as the previous review except the one added this time. In addition to the evaluation questions that are used for scoring, this time additional questions are also set to see some particular issues. Questions used in this review are listed below. Details can be referred in the scoring guidelines attached as Annex 1
Table 2: Evaluation questions
Question Scoring Remarks
Q1 The latest reporting
template is used ? The latest template used=2, The latest template not used=0
Scoring: Score 2 is given if the latest template was used. Score 0 is given if not so.
Q2 All data used in the report are accurate?
Fully accurate=2, Partially accurate=1, Not accurate at all=0
Scoring: Score 2 is given if there is no inaccurate data or chart presented in the report. Score 1 is given if there are some inaccurate data. Score 0 is given if all data reported are inaccurate.
Q3 All guiding questions in the template are answered?
All answered=2, Partially answered=1, Not answered at all=0
Scoring: Score 2 is given if all the guiding questions are answered. Score 1 is given if some of the questions are ignored. Score 0 is given if the questions are totally ignored.
Q4 Analysis on indicators is in good quality?
Good quality=2, Fair quality=1, Poor quality=0
Scoring: Score 2 is given if the indicator analysis for KG, PS and JHS include not only description of trends of data like increase or decrease, but also analysis on possible causes of increase/decrease and possible solutions for problems. Score 0 is given if there is no analysis on indicators or just description of increase or
decrease. The rest gets Score 1. Q5 Results of ADEOP
are properly reported?
Fully reported=2, Partially reported=1, Not reported=0
Scoring: Score 2 is given if all the planned activities are reported. Score 1 is given if part of planned activities are reported. Score 0 is given if there is no report on actual expenses or outputs, or if this part is entirely ignored.
Q6 There are any recommendations for next ADEOP?
Proper
recommendations=2, Fair recommendation=1, No recommendation=0
Scoring: Score 2 is given if there are some activities (operation or project) recommended to be included in the next ADEOP. Score 1 is given if there are some overall recommendation to ADEOP though there is no specific activity recommended. Score 0 is given if no recommendation made or this is totally ignored. Q7 Financial status is
accurately reported?
Accurate=2,
Not accurate=0 Scoring: Score 2 is given if total figures of the two financial tables (by budget item and by funding source) are identical. Score 0 is given if these are not identical.
Additional questions
• DEOC is reported?
• District Performance Review meeting is convened?
• DACF figures are reported?
• Name of Chair of DEOC is on the cover page?
3. Calculation of scores
The same method as used in the previous review is used to calculate scores as below. Actual scores in details are attached as Annex 2.
1. Scores for respective questions are summed up to show the total score of a district (See
○
A in the table below).2. Scores of all districts in a region for a particular question are summed up to make the total score of a region on the question (See
○
B below).3. Percentage of the total score against the full score for a particular question in a region is calculated (See
○
C below).4. All regional total scores for respective questions are summed up to make the grand total scores (See
○
D below)5. Percentage of the grand total score against the full score for a particular question is calculated (See
○
E below).Table 3: Scoring example
Name of district Score
Q1 Q2 … Q16 District total District 1 2 1 2 ○A
District 2 District 3 … District 20 Regional total ○B
% against full score ○C
…
Grand total ○D
% against full score ○E
6. Percentages of districts that obtained the score 2, 1 and 0 for each question are calculated to see breakdowns of obtained scores.
7. Distributions of total scores obtained by districts for their ADPRs are shown to see the trend of obtained scores.
4. Observations and findings
General observations
Overall, quality of ADPR 2011-12 has slightly deteriorated. The percentage of the aggregated scores of all the MMDs against full scores in total is 50.5%. This time one question (Q7) is added to the list of evaluation questions, which is related to consistency of financial figures. In order to make fair comparison, scores of ADPR 2010-11 have been calculated this time on Q7 and the total scores have been adjusted by reflecting the Q7 results. Then it is found that the total score percentage this time deteriorates by 1.4 point as seen below compared to the last year.
UER has got the highest score percentage of 61.1% while GAR has got the lowest of 42.1%. NR shows the highest increase of 8.6% while the biggest fall has been observed in BAR.
As for individual districts, Bolgatanga Municipal in UER has got the highest score of 13 out of 14 (92.9%) while the lowest was 0 of Wasa Amenfi West in WR which pretended their submission by sending the last year's report.
Table 4: Total score percentage by region
Total AR BAR CR ER GAR NR UER UWR VR WR
ADPR 2011-12 50.5% 51.3% 42.5% 53.4% 43.9% 42.1% 57.5% 61.1% 47.6% 50.4% 50.5%
ADPR 2010-11
(adjusted) 51.9% 56.7% 53.8% 55.5% 44.6% 51.4% 48.9% 62.2% 58.2% 43.4% 55.1%
Gap -1.4% -5.4% -11.3% -2.1% -0.8% -9.3% 8.6% -1.1% -10.5% 7.0% -4.6%
The total score has been positively influenced by some questions such as Q3(All guiding questions in the template are properly answered? ), Q5 (Results of activities listed in ADEOP are properly reported?) and Q6 (Is there any recommendation for the next cycle of ADEOP?). It must be due to enhanced understanding on reporting requirements among MMD officers. However, Q1 (The template revised this year is used in the ADPR?), Q4 (Is analysis on indicators in good quality?) and especially Q7 (Is financial status accurately reported?) have been deteriorated. This shows that the most important parts of the report still remain very poor.
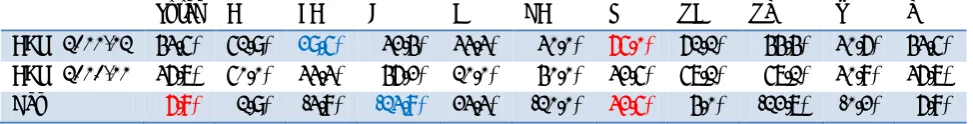
Table 5: Total score percentage by question
Q1 Latest
template Q2 Accuracy Q3 All Qs answered Q4 Analysis Q5 ADEOP
results
Q6 Recom
for ADEOP Q7 Financial
ADPR 2011-12 83.4% 50.3% 63.3% 46.7% 58.3% 43.5% 7.7%
ADPR 2010-11 93.3% 48.5% 59.3% 50.4% 49.6% 36.7% 25.2%
Gap -9.9% 1.8% 4.1% -3.6% 8.7% 6.8% -17.5%
Below is the distribution of the total score percentages of the MMDs. Total Score 0 here means non-submission. Although the number of non-submission is greatly decreased, the peak of the score percentages is still at the range of 40-60%.
[image:9.595.56.501.392.475.2]Figure 1: Distribution of total score percentage
The latest reporting template is used (Q1)
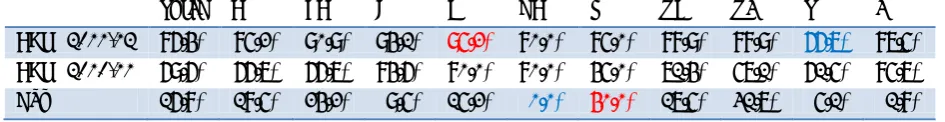
[image:10.595.59.553.475.539.2]All the MMDs are supposed to use the latest reporting template as it was revised in order to improve quality of the reports. The result shows that more MMDs than the previous year did not pay attention to the reporting template. UER shows the perfect score continuously from the previous year while BAR greatly deteriorated to the lowest. NR shows the highest improvement.
Table 6: Score percentage on Q1
Total AR BAR CR ER GAR NR UER UWR VR WR
ADPR 2011-12 83.4% 77.8% 63.6% 88.2% 85.7% 90.0% 90.0% 100.0% 88.9% 83.3% 83.4%
ADPR 2010-11 93.3% 100.0% 93.3% 92.3% 95.0% 100.0% 80.0% 100.0% 100.0% 88.5% 93.3%
Gap -9.9% -22.2% -29.7% -4.1% -9.3% -10.0% 10.0% 0.0% -11.1% -5.1% -9.9%
All data used in the report are accurate (Q2)
To get the score for the question, a particular focus is put on the following points: 1) whether the number of public primary school students reported is the same as EMIS, and 2) whether total GAR/GER is consistent with male/female GAR/GER.
The total score percentage has been slightly improved but the table below shows most of the MMDs have got Score 1.
Table 7: Score percentage on Q2
Total AR BAR CR ER GAR NR UER UWR VR WR
ADPR 2011-12 50.3% 51.9% 50.0% 50.0% 50.0% 50.0% 50.0% 50.0% 50.0% 50.0% 50.3%
ADPR 2010-11 48.5% 50.0% 50.0% 50.0% 47.5% 50.0% 50.0% 50.0% 50.0% 42.3% 48.5%
Gap 1.8% 1.9% 0.0% 0.0% 2.5% 0.0% 0.0% 0.0% 0.0% 7.7% 1.8%
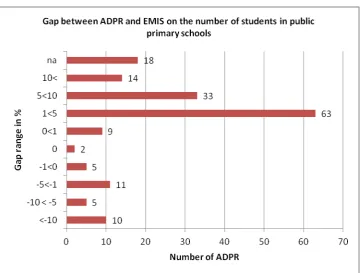
[image:10.595.56.528.711.772.2]Except Kassena Nankana West in UER and Kwabre in AR, no MMD shows in the ADPR the figure identical with the one in the EMIS report. Below is the extent of the gap between the ADPR figures and the EMIS figures (formula: EMIS figure/ ADPR figure -1). Though it is assumed that the EMIS figures added some data lately submitted to the EMIS team directly, 31 MMDs show that their ADPR figures are more than the EMIS figures as seen below.
Figure 2: Gap between ADPR and EMIS
All guiding questions in the template are answered (Q3)
[image:11.595.57.538.710.771.2]Guiding questions are indicated in the reporting template not to miss any key points for the performance review. Only 46 MMDs out of 170 (27.1%) responded all the guiding questions while the others omited answering some questions. The total score percentage on this question is 63.3%, increased by 4.1 point. While UER shows the highest score since previous year, GAR deteriorated to the lowest.
Table 8: Score percentage on Q3
Total AR BAR CR ER GAR NR UER UWR VR WR
ADPR 2011-12 63.3% 70.4% 54.5% 61.8% 52.4% 50.0% 72.5% 88.9% 61.1% 58.3% 63.3%
ADPR 2010-11 59.3% 56.3% 60.0% 73.1% 45.0% 70.0% 57.5% 78.6% 64.3% 53.8% 59.3%
Gap 4.1% 14.1% -5.5% -11.3% 7.4% -20.0% 15.0% 10.3% -3.2% 4.5% 4.1%
Analysis on indicators is in good quality (Q4)
Analysis on the performance indicators is one of the most critical parts of the performance report. Without proper analysis made, no lesson learnt or good recommendation is drawn.
This question too deteriorated in total to 46.7%, decreased by 3.6 point. While NR shows the highest score with slight improvement, GAR shows the lowest without showing any improvement. BAR shows great deterioration (28 point) while VR shows fairly good improvement.
Some reports only put indicator charts without explaining them. Others show their analysis of indicator figures excluding the ones in 2011/12, which are the main data that should be analysed. A most typical stereotyped example of their analysis is like 1) just describing increase/ decrease of indicator figures, 2) attributing the changes to the capitation grant, the school feeding programme and the enrolment drive on the positive side and to lack of parental awareness, migration, poverty and lack of funds and facilities on the negative side, then 3) demanding more funds and
continuation of these programmes.
[image:12.595.55.545.508.571.2]In order to make effective analysis, particular circuits or schools that show weak performance should be identified, circuit supervisors/ headteachers responsible and other stakeholders should be interviewed to find specific problems down there, then effective solutions identified through the discussions should be proposed. More ideally, a series of analysis such as problem tree analysis and result tree analysis to find out solutions, which is learned in the training programme of DEOPPR should be exercised in a participatory manner.
Table 9: Score percentage on Q4
Total AR BAR CR ER GAR NR UER UWR VR WR
ADPR 2011-12 46.7% 51.9% 38.6% 52.9% 33.3% 30.0% 60.0% 44.4% 44.4% 52.8% 46.7%
ADPR 2010-11 50.4% 62.5% 66.7% 50.0% 37.5% 30.0% 57.5% 64.3% 42.9% 46.2% 50.4%
Gap -3.6% -10.6% -28.0% 2.9% -4.2% 0.0% 2.5% -19.8% 1.6% 6.6% -3.6%
Results of ADEOP are properly reported (Q5)
One of the core contents of the ADPR is to review results of activities that have been planned in the ADEOP, whether planned activities have been implemented, how much money has been spent, and what outputs have been produced. The score result shows that this has been improved by 8.7 point from previous year. Especially UER, VR and CR contributed this improvement while GAR, UWR and ER negatively contributed to the result.
Table 10: Score percentage on Q5
Total AR BAR CR ER GAR NR UER UWR VR WR
ADPR 2011-12 58.3% 51.9% 61.4% 88.2% 45.2% 40.0% 65.0% 72.2% 44.4% 55.6% 58.3%
ADPR 2010-11 49.6% 46.9% 60.0% 61.5% 47.5% 50.0% 45.0% 42.9% 50.0% 26.9% 49.6%
Gap 8.7% 5.0% 1.4% 26.7% -2.3% -10.0% 20.0% 29.4% -5.6% 28.6% 8.7%
[image:13.595.59.418.342.406.2]Looking at the actual scores, in total, only 33.1% of MMDs get Score 2 while 16.6% get Score 0. CR shows good performance with 76.5% of the MMDs getting Score 2 while GAR and UWR have only one MMD with Score 2. Score 0 means that they failed or ignored the reporting duty on results of ADEOP. Score 1 means that produced outputs are not reported, actual expenses are not reported, or results of some activities are not reported. Mostly, it can be said that reporting on ADEOP results is incomplete.
Table 11: Number of MMDs on Q5
Total AR BAR CR ER GAR NR UER UWR VR WR
Score 2 56 6 11 13 3 1 8 4 1 4 5
Score 1 85 16 5 4 13 6 10 5 6 12 8
Score 0 28 5 6 0 5 3 2 0 2 2 3
There are any recommendations for next ADEOP (Q6)
Giving recommendation for the next ADEOP is also a critical part of ADPR. Without it, a project cycle going from planning, implementation, monitoring, evaluation, and to the next planning is not established.
The total score percentage has been improved by 6.8 point for this question. NR and ER contributed to the improvement while CR, GAR and UWR have negatively influenced on it.
Table 12: Score percentage on Q6
Total AR BAR CR ER GAR NR UER UWR VR WR
ADPR 2011-12 43.5% 51.9% 29.5% 32.4% 33.3% 30.0% 65.0% 61.1% 44.4% 30.6% 43.5%
ADPR 2010-11 36.7% 50.0% 33.3% 46.2% 10.0% 40.0% 32.5% 57.1% 57.1% 30.8% 36.7%
Gap 6.8% 1.9% -3.8% -13.8% 23.3% -10.0% 32.5% 4.0% -12.7% -0.2% 6.8%
Looking at the actual scores, 75 out of 169 (44.4%) MMDs get Score 0. BAR, ER and VR have more than 10 MMDs with Score 0. They just ignored this reporting requirement. Especially in these regions, the number of MMDs with Score 0 should be greatly reduced.
[image:13.595.58.545.603.665.2]Table 13: Number of MMDs on Q6
Total AR BAR CR ER GAR NR UER UWR VR WR
Score 2 53 3 5 2 5 3 11 3 3 3 8
Score 1 41 2 3 7 4 0 4 5 2 5 3
Score 0 75 4 14 8 12 7 5 1 4 10 5
Financial status is accurately reported (Q7)
Credibility of the ADPR would be greatly damaged if financial figures and status are not properly reported. There should be accurate financial data disclosed and proper analysis should be made if there are financial problems in MMDs. The focus for this question has been put on whether or not the expenditure table on budget items and that on funding sources are consistent.
This is an evaluation question newly added this time and all the ADPR 2010-11 have been revisited to make comparison. The result is totally deteriorated. All the regions except VR decreased their score percentage. This is the poorest among the evaluation questions. Most of the tables are inconsistent, incomplete or inadequate.
This result might be attributed to 1) totally inadequate capacity on financial management and reporting at MMDs, 2) this reporting duty not seriously taken by the MMD directors, or 3) motivation to hide actual financial records.
Table 14: Score percentage on Q7
Total AR BAR CR ER GAR NR UER UWR VR WR
ADPR 2011-12 7.7% 3.7% 0.0% 0.0% 7.1% 5.0% 0.0% 11.1% 0.0% 22.2% 7.7%
ADPR 2010-11 25.2% 31.3% 13.3% 15.4% 30.0% 20.0% 20.0% 42.9% 42.9% 15.4% 35.7%
Gap -17.5% -27.5% -13.3% -15.4% -22.9% -15.0% -20.0% -31.7% -42.9% 6.8% -28.0%
Others
This is to check whether or not the following points are also properly reported because not small number of MMDs tend to ignore reporting requirements related to District Assemblies. The percentage figures below are not the score percentage but the percentage of MMDs against the total number as these points do not take scores.
1) DEOC reported
This has been improved. In total 86.4% of MMDs reported results of DEOC meetings in their reports. While NR shows great improvement, VR still remains low.
[image:14.595.45.573.465.529.2]Table 15: Percentage of MMDs reporting on DEOC
Total AR BAR CR ER GAR NR UER UWR VR WR
ADPR 2011-12 86.4% 85.2% 90.9% 94.1% 95.2% 80.0% 85.0% 88.9% 88.9% 66.7% 87.5%
ADPR 2010-11 69.6% 66.7% 66.7% 84.6% 80.0% 80.0% 45.0% 71.4% 57.1% 61.5% 85.7%
Gap 16.8% 18.5% 24.2% 9.5% 15.2% 0.0% 40.0% 17.5% 31.7% 5.1% 1.8%
2) DACF figures reported
[image:15.595.57.533.371.434.2]Although significant improvement is shown, the percentage in total is still less than half. Only GAR deteriorated while all others improved or remained the same. GAR, NR, WR and UWR show their weakness on this information.
Table 16: Percentage of MMDs reporting DACF
Total AR BAR CR ER GAR NR UER UWR VR WR
ADPR 2011-12 41.4% 48.1% 40.9% 47.1% 38.1% 30.0% 30.0% 66.7% 33.3% 50.0% 31.3%
ADPR 2010-11 27.4% 33.3% 33.3% 30.8% 25.0% 40.0% 30.0% 57.1% 0.0% 7.7% 14.3%
Gap 14.0% 14.8% 7.6% 16.3% 13.1% -10.0% 0.0% 9.5% 33.3% 42.3% 17.0%
3) Name of DCE on the cover page
This is to see whether or not names of DEOC chairs (i.e. DCE) are written on the cover pages of their ADPR for their endorsement signatures. This is a critical requirement as per the ADPR guidelines. In total, 68.6% of the MMDs ignored this requirement. While UER shows much better status, all others show disappointing situations as seen below.
Table 17: Percentage of ADPRs with DCE names
Total AR BAR CR ER GAR NR UER UWR VR WR
DCE signature 31.4% 40.7% 18.2% 23.5% 23.8% 10.0% 30.0% 77.8% 55.6% 33.3% 25.0%
4) District Annual Performance Review Meeting held or not
Annual Performance Review Meeting at the district level is crucial to share results of the last school year and discuss about measures for improvement especially with headteachers, representatives of SMCs and other MMD stakeholders. However, the reports show that only 44.4% of MMDs held the meeting. Others totally ignored it or could not hold it because of lack of funds. Especially in GAR the percentage of the MMDs is only 20% while in UER most of the MMDs held the meetings.
Table 18: Percentage of ADPRs holding DPRMs
Total AR BAR CR ER GAR NR UER UWR VR WR
DPRM 44.4% 33.3% 45.5% 41.2% 38.1% 20.0% 65.0% 88.9% 33.3% 38.9% 50.0%
5) Cover Page
[image:16.595.62.539.286.318.2]It is found that as many as 26 MMDs (16.0% of the total) submitted their ADPRs without its cover page. Especially GAR (30%), CR (29.4%) and ER (28.6%) are the worst regions. This is a clear evidence of less attention of MMD Directors paid on importance of this document.
Table 19: Percentage of ADPRs without cover page
Total AR BAR CR ER GAR NR UER UWR VR WR
No cover page 16.0% 18.5% 18.2% 29.4% 28.6% 30.0% 10.0% 0.0% 11.1% 0.0% 6.3%
5. Recommendations
Formalities on reporting
Failure of covering any reporting requirement such as lack of cover page, lack of endorsement by the chair of DEOC, lack of indicator analysis, lack of reporting on ADEOP results and lack of financial reporting could be attributed 1) to just careless errors on one hand, 2) to inability of collecting relevant information such as financial figures within their offices because of poor management, or 3) to some intentions to hide uncomfortable facts or performance failure on the other.
1) Checking by the certificate holders
For the problem 1), it is recommended that there should be a process established within the MMD office to check the reports before the submission to see whether or not these are meeting
reporting requirements. Since a number of MMD officers are already or being trained through the training programme on District Education Operational Planning and Performance Review (DEOPPR), these trainees should be fully utilised to assure quality of the reports. Prior to finalisation of the MMD directors, the holders of the training certificate (participants of the training programme) should sign on the cover page to show that the reports are thoroughly checked by those who have been trained and are without any missing points or mistakes.
2) Giving strong budgetary sanction on ignorance of key reporting requirements
For the problem 2) and 3), Regional Directors should intensify their control over MMD Directors for their effective functioning. They should check whether MMD Directors effectively lead their entire offices to proceed with the ADPR process. Especially those who ignore the key reporting
requirements such as ADEOP results and financial figures, they should be given certain sanction such as 5% reduction of their next year budget or suspension of budget release until proper reports come.
Quality of reporting
As mentioned above, quality of indicator analysis and financial reporting is particularly poor. This is why many MMDs are not able to recommend relevant actions for the next year ADEOP. These poor quality could be attributed to 1) lack of knowledge and skills of report writers, 2) ineffective use of the training certificate holders, and 3) lack of motivation of report writers to raise quality of the analysis.
1) Continuous training
The training programme on DEOPPR should be continuously provided every year with focusing on more practical exercises on knowledge and skills for addressing actual problems demonstrated in the submitted reports rather than providing theoretical lectures without regard to the actual problems.
2) Involvement of the training certificate holders
Visits to MMDs after the DEOPPR training programme last year revealed that many of the participants were not involved in drafting the ADPRs. It is huge waste of efforts and resources if these trainees are not used for the report writing. To avoid such a situation, it should be made sure that all the ADPR should be signed by the training certificate holders to let them declare that their reports are free of errors and are along with all the reporting requirements, as recommended above.
3) Creating incentives for report writers
Unless report writers are effectively motivated to provide quality reports, even though good training is provided, they just repeat copying and pasting of last year's reports. It might be best to give special monetary reward to quality report writers, but budget constraints restrict this option. The second best option could be to use peer pressure. If, for example, the score ranking of MMDs on ADPR/ADEOP is presented to training participants during the training prorgamme or
disseminated to all the MMD Directors and Regional Directors, those who are in higher ranks receive good reputations among peers and those who are in lower ranks create motivation for improvement. Even in the annual regional review meetings, if regional directors praise MMD directors with high score reports, it must create motivation. Using peer pressure must be worth trying.
Data discrepancy
As seen above, discrepancy of figures between ADPRs and EMIS data was not improved. Apparently it is because of lately submitted census questionnaires which are directly processed by the EMIS team in the headquarters, not by MMD offices. However, this time it is found that in 31 MMDs the figures of ADPRs are higher than the ones of EMIS. This situation critically damages credibility of data, both in EMIS and ADPRs. Unless the situation where two kinds of database (the one at the EMIS headquarters and the others at MMDs) operate is dissolved, the discrepancy issue cannot be solved. To overcome this situation, the followings are recommended.
1) Online data entry (all data entered in MMDs)
The best way is to enable MMDs to go with online data entry accessing directly to the database at the headquarters. The ICT Team of the GES tested the online data entry in the Central Region where most of the MMDs are connected to the EDU Net. Apparently there has been no problem in
the pilot. As access to internet expands throughout MMDs, the online data entry should be also expanded in a step by step approach.
2) EMIS Data Website
In collaboration with the EMIS Team of the MOE, the ICT Team of the GES is currently preparing a website of EMIS data, which enables users to download required data for ADPR in the same format with the reporting template. Use of the website makes it easy for MMD officers to obtain required data without difficult handling. The website will contain all the data required for ADPR since 2001.
3) Use of the EMIS reporting module
However, the data of the latest Annual School Census cannot be ready in the website by the submission deadline of the ADPR every year. Normally the census result is published in May while the ADPR deadline is at the end of March. It is still necessary to use the EMIS reporting module, which was disseminated to all the MMDs last year, to extract the latest data for ADPR in an Excel format from the EMIS database at MMDs.
(end)
Annex 1 11 October 2012 AUDEM
Guidelines for regional officers
on reviewing ADEOP 2013-15 and ADPR 2011
1. Roles of regional offices on ADEOP and ADPR
Regional offices are expected to play the following roles in terms of ADEOP/ADPR:
Guide district officers to formulate their ADEOPs/ADPRs in a proper manner
Monitor implementation of ADEOPs
Analyse ADPRs for regional situation analysis and target setting in the regions
Reviewing ADEOPs/ADPRs and give proper recommendations to improve the documents is one of the key actions to contribute to the above tasks.
2. Check points for ADEOP 2013-15
There are two types of check points: one for scoring and the other for not scoring. The one for scoring is the check point directly linked to quality of the plan. The other is just for checking whether or not expected formality is followed. The check points below with the question numbers are the one for scoring. Below are the check points going through sheet by sheet in the ADEOP.
Cover
Names of district, district director and chair of DEOC are put in the cover page
There are ADEOPs without names of signers or even district names. These documents may not be consulted nor approved by those signers. Districts should be instructed to complete the cover page.
Vision and mission
Vision and mission are properly stated (Q3)
Still in many documents, vision and mission are confused. It should be made sure that vision is the ideal situation that they are going to realise and mission is the means to realise the vision.
According to the ESP. "providing quality education to all children" is the mission. Vision is what could be seen as a result of accomplishing the mission.
Scoring: If both vision and mission are properly stated, Score 2 is given. If either of them is not appropriate, Score 1 is given. If both of them are inadequate or no statement is given, Score 0 is given.
Population projection
Population projection is properly made (Q4)
Population projection is all the basis for quantitative planning. There should be no irregularity among figures such as sudden increase/decrease or single age figures higher than multi-age figures, for example. Scoring: Score 2 is given if there is no irregularity among figures. Score 1 is given if there are some but not serious irregularities. Score 0 is given if figures are totally confused or no data is shown.
Use of the projection template
This time, a tentative projection template was distributed by using the latest census result. It should be also checked whether ADEOPs use the template or not.
Past enrolment & key indicators
Past enrolment figures properly entered according to EMIS
All MMDs are encouraged to use figures of EMIS. Accuracy of data should also be checked because sometimes only public school figures are put or some irregular figures are put.
Key indicator targets
Relevance of targets of key indicators (Q5)
There should not be any inappropriate targets such as downward target setting of NAR/NER, NAR/NER targets over 100%, upward target setting of PCRR and any irregular figures like figures below zero. It has been found that it is difficult to have proper targets for Senior High Schools as the figures are not disclosed on the district basis in EMIS. Therefore it is not necessary to check figures of the Senior Secondary Cycle.
Scoring: If there is no such inappropriate target in Basic Education, Score 2 is given. If all targets are totally wrong or no target shown in BE, Score 0 is given. The rest gets Score 1.
Operational matrix
Activity statements are SMART (Q9)
Activity statements should be described in SMART manner. SMART stands for Specific,
Measurable, Achievable, Relevant and Time-bound (see P.8 of DEOPPR Training Manual). If the statement is not clear, it is difficult to implement, monitor and evaluate the activity.
Scoring: If all statements are specific, measurable and relevant, Score 2 is given. If all
statements are not specific, measurable and relevant, Score 0 is given. The rest gets Score 1.
Activities are placed under proper strategies
Some activities are placed in strategies which are not necessarily related to the activities. MMDs should be guided to properly relate activities to relevant strategies.
Relevant activities against outcome targets are sufficiently listed (Q6)
There should be sufficient activities which are all required to achieve the outcome targets listed such as GER and NER.
Scoring: Score 2 is given if there is no irrelevant activity or missing crucial activity. Score 0 is given if all activities are irrelevant. Score 1 is given if some activities are irrelevant (like increasing teachers while increasing PTR) or some crucial activities are missing (like no construction work or furniture provision though decreasing PCRR).
Activities of DPs other than DFID are reflected? (Q11)
ADEOP is supposed to list up all activities funded by various finding sources. All the MMDs are strongly encouraged to mobilise funding potentials and list up all the activities funded by development partners, NGOs, civil society organisations and other government funding sources.
Scoring: Score 2 is given if activities funded by more than two DPs other than DFID are listed. Score 0 is given if no DP support other than DFID is listed. The rest gets Score 1.
Activities of DACF are included? (Q12)
As one of the major funding sources, the District Assembly Common Fund needs to be actively utilised especially for infrastructure development. MMDs should be strongly encouraged to include plans for DACF.
Scoring: If activities funded by DACF are fully included in ADEOP, Score 2 is given. If partially included, Score 1 is given. If nothing included, Score 0 is given.
PJ/OP are properly distinguished
As per instructions from the Ministry of Finance and Economic Planning, activities should be re-categorised into two types: Project and Operation. Project is meant to be investment activities such as construction of classrooms, system development and other assets acquisition while operation is meant to be recurrent activities such as enrolment drives, training
workshops, purchasing office supplies, etc. Then proper cost aggregation should be made for Goods and Services as sum of OPs and Assets as sum of PJs. It should be checked if proper distinction is made between OPs and PJs and MMDs that did not do so should be instructed to do so.
Serial numbers are properly put.
Serial numbers headed by PJ or OP should be given to all activities consecutively from the first one and should not be overlapped. It should be checked if consecutive numbers are given to activities and MMDs should be guided if not so.
Output targets are properly shown in comparison with its baseline (achievements in 2011) (Q7)
Output is a direct result of an activity. Normally output target is a numerical target to be produced by an activity. Not only figures themselves but also what the output is should be stated. For example, in case of teacher training workshop, instead of putting only a figure, like "100", but It should be stated as "100 teachers". Then, output targets cannot be very different from what has been actually done in the base year unless much larger funding commitment is made for the activity. Consistency of output targets should be checked with achievements in the base year.
Scoring: Score 2 is given if all output figures are appropriate compared to the baselines. Score 1 is given if some output targets are not appropriate compared to its baselines. Score 0 is given if no target is shown or all irrelevant.
Estimated costs are properly shown in comparison with its baseline (actual expense in 2011) (Q8)
Similar to the output target, estimated costs should also be made in line with the actual expense in the base year, unless much larger funding commitment is made for the activity.
Scoring: Score 2 is given if all cost estimates are appropriate compared to the baseline. Score 1 is given if some cost estimates are too high or low compared to the baseline. Score 0 is given if no cost estimate is shown or no baseline is shown to see relevance of cost estimates.
All the figures are stated in thousand Cedis
There are many ADEOPs that ignore the instruction asking to indicate financial figures in thousand Cedis. It should be checked whether all the financial figures are indicated in thousand Cedis and if not so MMDs should be instructed to do so.
Total costs (A) and (B) are identical
Total costs (A) and (B) in each operational matrix should be identical as these two costing tables just show the total cost estimates in different financial aspects: budget items and funding sources. If not identical, MMDs should be instructed to do so.
Summary Cost Matrix
Total costs (A) (B) (C) are identical (Q13)
As mentioned above, total costs (A) (B) (C) in the Summary Cost Matrix should be identical as these three tables show the MMD aggregated cost estimates with breakdown by education level, budget item and funding source. If not so, MMDs should be instructed to do so. Scoring: Score 2 is given if the (A) (B) (C) are all identical. Score 1 is given if some of them are not identical. Score 0 is given if all the three figures are different to each other.
Growth rates of the total cost (A) are appropriate (less than 20% for each) (Q14)
In general, available resources cannot be suddenly increased or decreased. Plans should be made by avoiding such huge gaps between fiscal years.
Scoring: Score 2 is given if growth rates for the three years are all less than 20%. Score 0 is given if the growth rate of some particular year is more than 50%. The rest gets Score 1.
Unit costs are not unusually high or low (between ¢100 to 700) (Q15)
Unit cost is a good tool to see whether each student can benefit adequately from the ADEOP as it can be compared by year and with other districts/ regional and national average.
Scoring: Score 2 is given if the unit costs are properly calculated and in the range
between ¢100 to 700. Score 1 is given if the unit costs are properly calculated but outside the above range. Score 0 is given if the unit costs are not properly calculated.
General
The new form with enrolment projection sheets is used (Q1)
All the MMDs are supposed to use the new form of ADEOP with enrolment projection sheets. Scoring: Score 2 is given if the new form is used. Score 0 is given if the new form is not used.
Form is completely filled (Q2)
All the MMDs are supposed to complete all the sheets in the form for submission.
Scoring: Score 2 is given if all the sheets are completed. Score 0 is given if some of the sheets are incomplete or left blank.
Recommendations from ADPR are reflected in the plan? (Q10)
ADPRs are supposed to give recommended activities based on the performance review of the previous school year. ADEOPs need to properly reflect these recommended activities.
Scoring: Score 2 is given if recommended activities in ADPRs are included. Score 0 is given if there is no recommended activity in ADPR or no reflection in ADEOP though recommended.
3. Check points for ADPR 2011-12
The latest reporting template is used (Q1)
All the MMDs are supposed to used the latest reporting template as it was revised in order to improve quality of reports.
Scoring: Score 2 is given if the latest template was used. Score 0 is given if not so.
All data used in the report are accurate (Q2)
Needless to say, accurate data should be reported. Particular focus can be made on the following points: 1) whether the number of primary school students is same as EMIS, and 2) total GAR/GER is consistent with male/female GAR/GER.
Scoring: Score 2 is given if there is no inaccurate data or chart presented in the report. Score 1 is given if there are some inaccurate data. Score 0 is given if all data reported are inaccurate.
All guiding questions in the template are answered (Q3)
Guiding questions are indicated in the reporting template not to miss any key points for the performance review.
Scoring: Score 2 is given if all the guiding questions are answered. Score 1 is given if some of the questions are ignored. Score 0 is given if the questions are totally ignored.
Analysis on indicators is in good quality (Q4)
Analysis on the indicators is one of the most critical parts of the performance report. Without proper analysis made, no lesson learnt or good recommendation is drawn.
Scoring: Score 2 is given if the indicator analysis for KG, PS and JHS include not only description of trends of data like increase or decrease, but also analysis on possible causes of
increase/decrease and possible solutions for problems. Score 0 is given if there is no analysis on indicators or just description of increase or decrease. The rest gets Score 1.
Results of ADEOP are properly reported (Q5)
One of the core contents of the ADPR is to review results of activities that have been planned in the ADEOP, whether planned activities have been implemented, how much have been spent, and what outputs have been produced.
Scoring: Score 2 is given if all the planned activities are reported. Score 1 is given if part of planned activities are reported. Score 0 is given if there is no report on actual expenses or outputs, or if this part is entirely ignored.
There are any recommendations for next ADEOP (Q6)
The main purpose of the performance review is to see whether the ADEOP has been
implemented effectively and efficiently and give recommended activities for the next ADEOP if needed as a result of review. ADPR must include them to improve the next plan.
Scoring: Score 2 is given if there are some activities (operation or project) recommended to be included in the next ADEOP. Score 1 is given if there are some overall recommendation to ADEOP though there is no specific activity recommended. Score 0 is given if no
recommendation made or this is totally ignored.
Financial status is accurately reported (Q7)
Credibility of the ADPR would be greatly damaged if financial figures and status are not properly reported. There should be accurate financial data disclosed and proper analysis should be made if there are financial problems in MMDs.
Scoring: Score 2 is given if total figures of the two financial tables (by budget item and by funding source) are identical. Score 0 is given if these are not identical.
Others
It is also good to check whether or not the following points are also properly reported because not small number of MMDs tend to ignore reporting points related to District Assemblies.
• DEOC reported
• DACF figures reported
4. Scoring
1) Scoring for each evaluation question
By using the scoring sheet, scores should be given to those questions targeted for scoring mentioned above according to the scoring standard. Remarks should be made to justify reasons for scoring for each MMD or to note findings during the review.
2) Aggregate scores in regions
Aggregate scores of the MMDs in a region by question. 3) % against total
The aggregated scores in a region are compared to the total scores for each question to see the percentage.
4) General observation
General findings for a region should comment on which questions have better or worse performance and what are expected to be improved.
5. Reporting and feedback 1) Reporting
The review process on ADEOP and ADPR in a region should be completed by 26 October 2012 and the results should be submitted to the AUDEM through [email protected] by COB 26 October 2012.
2) Feedback to districts
The review results should be shared with MMDs and urge them to revise their ADEOP/ADPR according to the recommendations mande by regional offices.
(end)
Annex
Scoring sheet for ADEOP 2013-15
Scores of ADEOP 2013-15 Additional check points
GHANA DISTRICTS
Subm issio
n
Q1 N ew fo
rm us ed?
Q2 Fo rm fi
lled?
Q3 V ision a
nd m issio
n
rele vant
?
Q4 R elev
ance of
pop ulat
ion p rojec
tion ?
Q5 R elev
ance o f tar
gets
of ke y ind
icator s?
Q6 R eleva
nce o f act
ivitie s
agai nst o
utcom e ta
rgets ?
Q7 R elev
anc e of o
utput
targ ets o
f acti vities
?
Q8 R elev
ance of cos
t
estim ates a
gain st o
utput
targ ets?
Q9 A ctiviti
es S MAR
T?
Q10 R ecom
menda tions
from ADP
R ref lected
?
Q11 DP ac
tiviti es o
ther
than D FID re
flect ed?
Q12 DACF i
nclude d?
Q13: Thr
ee budg et ta
bles
cons iste
nt to eac
h oth er?
Q14 Grow
th ra tes o
f Tota l
Cost (A) a
ppro priat
e?
Q15 Unit c
ost appr opria te? Tota l Rem arks Cove r pag
e cor rect
?
Use of p
rojec tion
tem plat
e? All fig
ures acc urat e in Past Enr olm ent s
heet
All a ctiv
ities unde
r
prop er st
rate gies
PJ/O P pro
perly dist ingui
shed Prop
er S N?
All fig ures
in 0 00 C
edis?
Tota l cos
ts (A )(B)
iden tical i
n all shee ts? Ashanti Region.
1 Adansi North 0
2 Adansi South 0
3 Afigya-Kwabre new 0
4 Ahafo Ano North 0
5 Ahafo Ano South 0
6 Amansie Central 0
7 Amansie West 0
8 Asante Akim North Municipal 0
9 Asante Akim South 0
10 Atwima Kwanwoma new 0
11 Atwima Mponua 0
12 Atwima Nwabiagya 0
13 Bekwai Asante 0
14 Bosome Freho new 0
15 Bosomtwe 0
16 Ejisu-Juaben Municipal 0
17 Ejura/ Sekyedumase 0
18 Kumasi Metropolitan 0
19 Kwabre 0
20 Mampong Municipal 0
21 Obuasi Municipal 0
22 Offinso Municipal 0
23 Offinso North new 0
24 Sekyere Afram Plains new 0
25 Sekyere Central new 0
26 Sekyere East 0
27 Sekyere South 0
Actual Score total 0 0 0 0 0 0 0 0 0 0 0 0 0 0 0 0 0 0 0 0 0 0 0 0 0
Full score total 27 0 0 0 0 0 0 0 0 0 0 0 0 0 0 0 0 #### #DIV/0! #DIV/0! #DIV/0! ###### ### #DIV/0! #DIV/0!
% 0.0% #DIV/0! #DIV/0! #DIV/0! #DIV/0! #DIV/0! #DIV/0! #DIV/0! #DIV/0! ######DIV/0! #DIV/0! ###### #DIV/0! #DIV/0! #DIV/0! #####
Scoring sheet for ADPR 2011
Review of ADPR 2011-12
Q1: U se of th
e rev ised
templa te? Q2: A
ll data accur
ate?
Q3: A ll guidi
ng que stions
answe red?
Q4: Q uality
of an alysis
on
indicat ors
Q5: R esults o
f ADE OP
report ed?
Q6: A ny re
com. for ne
xt
ADEO P?
Q7: F inancial
statu s
accurat ely re
porte d?
Total S core
Gener al Rem
arks
2010 -11 re
view Number of primary school students same as EMIS? Total GAR/GER consistent with male/femal e GAR/GER? DEOC reported? DACF figures reported? Ashanti Region.
1 Adansi North 0 0 1
2 Adansi South 0 8
3 Afigya-Kwabre 0 10
4 Ahafo Ano North 0 0
5 Ahafo Ano South 0 4
6 Amansie Central 0 0
7 Amansie West 0 7
8 Asante Akim North Municipal 0 0 1
9 Asante Akim South 0 0
10 Atwima Kwanwoma 0 0 1
11 Atwima Mponua 0 11
12 Atwima Nwabiagya 0 6
13 Bekwai Asante 0 10
14 Bosome Freho 0 10
15 Bosomtwe 0 0 1
16 Ejisu-Juaben Municipal 0 6
17 Ejura/ Sekyedumase 0 0
18 Kumasi Metropolitan 0 0 1
19 Kwabre 0 0 1
20 Mampong Municipal 0 0
21 Obuasi Municipal 0 5
22 Offinso Municipal 0 8
23 Offinso North 0 5
24 Sekyere Afram Plains 0 6
25 Sekyere Central 0 7
26 Sekyere East 0 6
27 Sekyere South 0 8
Actual Score total 0 0 0 0 0 0 0 0 117 6
Full score total 0 0 0 0 0 0 0 0 192 #DIV/0! #DIV/0! #DIV/0! #DIV/0!
% #DIV/0! #DIV/0! #DIV/0! #DIV/0! #DIV/0! #DIV/0! #DIV/0! #DIV/0! 60.9%
Total Number submitted 0
% of submission
0.0%
Annex 2: Scores of ADPR 2011-12
Review of ADPR 2011-12
Q1: Use
of th e la
test
temp late?
Q2: All d
ata ac curat
e?
Q3: All g
uidi ng que
stio ns ans wer ed? Q4: Qua lity o
f ana lysis on indi cato rs Q5: Resu lts o
f ADE OP repo rted ? Q6: Any reco
m. f or n
ext ADEO P? Q7: Finan cial stat us accur atel
y repo rted?
Tot al S
core Scor
e per cen
tage
Gene ral R
emark s
Ashanti Region.
1 Adansi North 2 1 1 1 0 2 0 7 50.0% Population figure of age 6-11 in 2011/12 shown in
Chart 1 wrong, same old analysis, result of ADEOP 2010 reported instead of 2011, DSPAM not reported,
2 Adansi South 2 1 2 2 1 2 0 10 71.4% there is no "fiscal school year",
3 Afigya-Kwabre 2 1 2 1 1 1 0 8 57.1% there is no "fiscal school year", target school year
should be 2011/12, no construction reported in ADEOP though indicated,
4 Ahafo Ano North 0 1 1 0 0 0 0 2 14.3% target FY on CP wrong, no financial figures on 2011
reported,
5 Ahafo Ano South 2 1 1 0 1 1 0 6 42.9% No analysis on indicators,
6 Amansie Central 2 1 2 2 1 1 0 9 64.3% statement of target school/fiscal year wrong, no
construction reported in ADEOP though indicated,
7 Amansie West 0 1 1 1 1 0 0 4 28.6% No cover page, submission of the main report with
Excel not appropriate, no construction reported in ADEOP though indicated,
8 Asante Akim North Municipal 2 1 2 1 1 2 0 9 64.3% No cover page,
9 Asante Akim South 2 1 1 1 0 2 0 7 50.0% Target fiscal year should be 2011,
10 Atwima Kwanwoma 2 1 2 2 2 2 0 11 78.6% Target fiscal year should be 2011, primary GER
201% is wrong,
11 Atwima Mponua 2 1 2 1 1 1 0 8 57.1% no construction reported in ADEOP though
indicated,
12 Atwima Nwabiagya 2 1 1 1 1 1 0 7 50.0% No cover page, introduction unnecessarily too long
(30p/58p), no output reported on ADEOP,
13 Bekwai Asante 2 1 1 0 1 2 0 7 50.0% Target fiscal year should be 2011, figures of
SY2011/12 are not analysed, in addition some analysis is wrong, no construction reported in ADEOP though indicated,
14 Bosome Freho 2 1 1 1 2 2 0 9 64.3% some charts not appropriate, no INSET report,
15 Bosomtwe 2 1 2 1 1 1 0 8 57.1% Target fiscal year should be 2011, no construction
reported in ADEOP though indicated,
16 Ejisu-Juaben Municipal 0 1 1 1 1 0 0 4 28.6% Target fiscal year should be 2011, form not
completely followed, no construction reported in ADEOP though indicated,
17 Ejura/ Sekyedumase 2 1 2 0 1 1 2 9 64.3% Target fiscal year should be 2011, no construction
reported in ADEOP though indicated,
18 Kumasi Metropolitan 2 1 2 0 1 2 0 8 57.1% Target fiscal year should be 2011, indicator analysis
should explain why these are stagnated, construction activity not reported,
19 Kwabre 2 2 2 2 2 2 0 12 85.7% Target fiscal year should be 2011, introduction too
much (9p),
20 Mampong Municipal 0 1 1 2 0 0 0 4 28.6% No cover page,
21 Obuasi Municipal 0 1 1 0 2 0 0 4 28.6% No analysis on 2011/12 figures,
22 Offinso Municipal 2 1 1 2 1 0 0 7 50.0% No cover page, no construction reported in ADEOP
though indicated,
23 Offinso North 0 1 1 1 1 2 0 6 42.9% Different cover page,
24 Sekyere Afram Plains 2 1 1 2 2 0 0 8 57.1% Different cover page,
25 Sekyere Central 2 1 2 2 1 1 0 9 64.3% Different cover page, no construction reported in
ADEOP though indicated,
26 Sekyere East 2 1 1 1 0 0 0 5 35.7%
27 Sekyere South 2 1 1 0 2 0 0 6 42.9% Different cover page, no analysis on 2011/12
figures,
Actual Score total 42 28 38 28 28 28 2 194
Full score total 54 54 54 54 54 54 54 378
% 77.8% 51.9% 70.4% 51.9% 51.9% 51.9% 3.7% 51.3%
Total Number submitted 27
% of submission
100.0% 59.3%
Brong Ahafo Region
1 Asunafo North Municipal 0 1 1 1 2 1 0 6 42.9% Not following the structure of the form, some
analysis wrong,
2 Asunafo South 2 1 1 1 1 0 0 6 42.9% Cover page not indicating target SY/FY, outputs of
ADEOP not indicated,
3 Asutifi 0 1 1 0 2 0 0 4 28.6% no cover page,
4 Atebubu-Amantin 2 1 1 1 2 1 0 8 57.1% no cover page,
5 Berekum Municipal 2 1 1 1 2 2 0 9 64.3% Target FY should be 2011, no credit of DEOC chair,
some chart wrong,
Review of ADPR 2011-12
Q1: Use
of th e la
test
temp late?
Q2: All d
ata ac curat
e?
Q3: All g
uidi ng que
stio ns ans wer ed? Q4: Qua lity o
f ana lysis on indi cato rs Q5: Resu lts o
f ADE OP repo rted ? Q6: Any reco
m. f or n
ext ADEO P? Q7: Finan cial stat us accur atel
y repo rted?
Tot al S
cor e
Scor e per
cen tage
Gene ral R
emark s
6 Dormaa East 0 1 1 1 0 0 0 3 21.4% Details of indicator figures should be placed in
Annex
7 Dormaa Municipal 0 1 1 2 2 2 0 8 57.1% Charts not indicate figures of 2011-12,
8 Jaman North 2 1 2 2 2 2 0 11 78.6% Cover page not indicating target SY/FY, analysis
stereotyped,
9 Jaman South 0 1 1 1 0 0 0 3 21.4% Charts should be explained in the analysis, causes
of changes and improvement measures should be described by sub-sector,
10 Kintampo North Municipal 2 1 1 1 1 0 0 6 42.9% population projection with wrong charts without
any explanation, output statements of ADEOP not very clear,
11 Kintampo South 2 1 1 1 1 1 0 7 50.0% no cover page, analysis of enrolment rates ignored,
outputs of ADEOP not clearlu stated, unit cost calculation wrong,
12 Nkoranza North 2 1 1 1 0 0 0 5 35.7% Use of charts not appropriate,
13 Nkoranza South 2 1 1 1 2 2 0 9 64.3% situation anaysis is ok but no solutions proposed,
14 Pru 2 1 1 0 1 0 0 5 35.7% No cover page, no spent amount repored on
ADEOP,
15 Sene 2 1 1 0 2 0 0 6 42.9% figures of 2011/12 not reported= one year old
useless report,
16 Sunyani Municipal 2 1 1 0 0 0 0 4 28.6% figures of 2011/12 not analysed, results of ADEOP
in 2011 should have been reported,
17 Sunyani West 2 1 1 0 2 0 0 6 42.9% very little or no analysis,
18 Tain 0 1 1 0 0 0 0 2 14.3% very little or no analysis,
19 Tano North 0 1 1 0 1 0 0 3 21.4%
20 Tano South 2 1 1 0 2 0 0 6 42.9% Target FY on cover page wrong, use of charts not
relevant, detailed data not attached,
21 Techiman Municipal 2 1 2 2 2 2 0 11 78.6% Target SY should be 2011/12,
22 Wenchi Municipal 0 1 1 1 0 0 0 3 21.4% no cover page,
Actual Score total 28 22 24 17 27 13 0 131
Full score total 44 44 44 44 44 44 44 308
% 63.6% 50.0% 54.5% 38.6% 61.4% 29.5% 0.0% 42.5%
Total Number submitted
22 49.6%
% of submission
100.0%
Central Region
1 Abura/ Asebu/ Kwamankese 2 1 2 2 2 1 0 10 71.4% Target FY should be 2011,
2 Agona East 0 1 1 1 1 0 0 4 28.6% use of charts not relevant,
3 Agona West Municipal 0 1 1 1 2 0 0 5 35.7%
4 Ajumako/ Enyan/ Essiam 2 1 2 1 2 1 0 9 64.3% no cover page, some analysis
5 Asikuma/ Odoben/ Brakwa 2 1 1 1 2 1 0 8 57.1% GPI getting worse because of interventions?
6 Assin North Municipal 2 2 1 2 2 2 0 11 78.6%
7 Assin South 2 1 1 0 2 1 0 7 50.0% Target SY should be 2011/12, no analysis on
2011/12 figures,
8 Awutu-Senya 2 1 1 1 2 0 0 7 50.0% no cover page, no solutions suggested,
9 Cape Coast Metropolitan 2 1 1 1 1 1 0 7 50.0% no cover page, analysis of some indicators like PCRR
missing, primary GER greatly reduced to 72% in 2011/12 but no explanation given, no numerical outputs and spent amount reported on ADEOP,
10 Effutu Municipal 2 1 2 2 1 1 0 9 64.3%
11 Gomoa East 2 1 1 1 2 2 0 9 64.3% no cover page, some charts are wrong,
12 Gomoa West 2 1 1 2 0 0 6 42.9% Target FY should be 2011, ADPR should be
endorsed by DEOC, some charts are wrong, structure of analysis confused,
13 Komenda/ Edina/ Eguafo/ Abirem 2 1 1 0 2 0 0 6 42.9% no analysis on 2011/12 figures, seems confused
with regional form,
14 Mfantseman Municipal 2 1 1 1 2 0 0 7 50.0% Cover page without signature,
15 Twifo/ Heman/ Lower Denkyira 2 1 2 1 1 1 0 8 57.1% No cover page, something wrong with PP,
16 Upper Denkyira East Municipal 2 1 1 1 2 0 0 7 50.0% cause of GER decline not explained,
17 Upper Denkyira West 2 1 1 1 2 0 0 7 50.0% PP in 2011/12 wrong,
Actual Score total 30 17 21 18 30 11 0 127
Full score total 34 34 34 34 34 34 34 238
% 88.2% 50.0% 61.8% 52.9% 88.2% 32.4% 0.0% 53.4%
Total Number submitted
17 62.3%
% of submission
100.0%
Eastern Region
1 Akuapim North 2 1 1 1 1 2 0 8 57.1% no cover page, analysis not made for each indicator,
2 Akuapim South Municipal 2 1 1 0 2 2 0 8 57.1% PP wrong, figures of indicators look very different
from EMIS,
Review of ADPR 2011-12
Q1: Use
of th e la
test
temp late?
Q2: All d
ata ac curat
e?
Q3: All g
uidi ng que
stio ns ans wer ed? Q4: Qua lity o
f ana lysis on indi cato rs Q5: Resu lts o
f ADE OP repo rted ? Q6: Any reco
m. f or n
ext ADEO P? Q7: Finan cial stat us accur atel
y repo rted?
Tot al S
cor e
Scor e per
cen tage
Gene ral R
emark s
3 Akyemansa 2 1 1 1 1 0 0 6 42.9% no cover page, no construction work reported,
4 Asuogyaman 2 1 1 1 0 0 1 6 42.9%
5 Atiwa 2 1 1 0 1 0 1 6 42.9% Target SY should be 2011/12 and FY 2011, result of
SY2011/12 not analysed, no construction reported,
6 Birim Central Municipal 2 1 1 1 2 0 1 8 57.1%
7 Birim North 2 1 1 1 1 1 0 7 50.0%
8 Birim South 2 1 1 0 1 0 0 5 35.7% V/M confused, result of SY2011/12 not analysed, no
construction reported,
9 East Akim Municipal 2 1 1 2 1 0 0 7 50.0% Target FY should be 2011, detailed table not
attached,
10 Fanteakwa 2 1 2 1 2 2 0 10 71.4% no cover page,
11 Kwaebibirem 2 1 1 0 1 0 0 5 35.7% no cover page, similar charts should be combined
into one, some analysis wrong, ADEOP outputs not properly stated, construction not reported,
12 Kwahu East 0 1 1 1 0 0 0 3 21.4%
13 Kwahu North 2 1 1 0 0 0 0 4 28.6% no analysis of figures of SY2011-12, no report on
results of ADEOP 2011,
14 Kwahu South 2 1 1 1 1 1 0 7 50.0% no ADEOP output reported,
15 Kwahu West Municipal 2 1 1 0 0 0 0 4 28.6% no indicator analysis but only charts,
16 Lower Manya Krobo 0 1 1 1 1 0 0 4 28.6% result of ADEOP in 2011 not 2013 should have been
reported, expenditure of some ADEOP activities not reported,
17 New-Juaben Municipal 2 1 1 0 1 2 0 7 50.0% ADPR should be endorsed by DEOC, similar charts
should be combined, no analysis of indicators, no construction reported,
18 Suhum/ Kraboa/ Coaltar 2 1 1 1 0 2 0 7 50.0% Annex should not be put in main part,
19 Upper Manya Krobo 0 1 1 0 1 0 0 3 21.4% no cover page, no construction reported,
20 West Akim Municipal 2 1 1 1 1 1 0 7 50.0% no construction reported,
21 Yilo Krobo 2 1 1 1 1 1 0 7 50.0% no cover page, no annex attached,
Actual Score total 36 21 22 14 19 14 3 129
Full score total 42 42 42 42 42 42 42 294
% 85.7% 50.0% 52.4% 33.3% 45.2% 33.3% 7.1% 43.9%
Total Number submitted
21 50.0%
% of submission
100.0%
Greater Accra Region
1 Accra Metropolitan 0 1 1 0 1 0 0 3 21.4% target SY should be 2011/12, population figures
wrong, expenditure of some ADEOP activities not reported,
2 Adenta municipal 2 1 1 1 2 2 0 9 64.3% no cover page, no annex attached,
3 Ashaiman municipal 2 1 1 1 1 0 0 6 42.9% no cover page, ADEOP outputs not properly stated,
no annex attached,
4 Dangme East 2 1 1 0 1 0 0 5 35.7% no analysis on indicators, ADEOP outputs not stated
properly, no annex attached,
5 Dangme West 2 1 1 1 0 0 0 5 35.7% target SY on CP should be 2011/12, no
improvement measures for indicator performance indicated
6 Ga East Municipal 2 1 0 0 0 0 0 3 21.4% target SY should be 2011/12, most of guiding
questions not answered, no annex attached,
7 Ga West Municipal 2 1 1 0 0 2 1 7 50.0% target SY on CP should be 2011/12, analysis of
2011/12 figures not shown, solutions not shown, useless to show result of ADEOP 2007,
8 Ga South (Weija) municipal 2 1 2 2 1 2 0 10 71.4% target SY on CP should be 2011/12, no construction
reported for ADEOP, no annex attached,
9 Ledzekuku-Krowor municipal 2 1 1 0 1 0 0 5 35.7% introduction too long, little indicator analysis, no
construction reported, annex not complete,
10 Tema Metropolitan 2 1 1 1 1 0 0 6 42.9% no CP, solutions not shown in indicator analysis,
ADEOP outputs not properly shown,target SY should be 2011/12, five year data not shown in annex,
Actual Score total 18 10 10 6 8 6 1 59
Full score total 20 20 20 20 20 20 20 140
% 90.0% 50.0% 50.0% 30.0% 40.0% 30.0% 5.0% 42.1%
Total Number submitted 10
% of submission
100.0%
Northern Region
1 Bole 2 1 2 2 2 2 0 11 78.6% no CP,