It’s not the ’what’, but the ’how’: Exploring the
role of debt in natural resource (un)
sustainability
Julen Gonzalez-Redin1,2☯*, J. Gareth Polhill1☯, Terence P. Dawson2,3☯, Rosemary Hill4,5☯, Iain J. Gordon1,5,6☯
1 Information and Computational Sciences, James Hutton Institute (JHI), Aberdeen, Scotland, United Kingdom, 2 Geography and Environmental Science, School of Social Sciences, University of Dundee (UoD), Dundee, Scotland, United Kingdom, 3 Department of Geography, King’s College London (KCL), Strand, London, England, United Kingdom, 4 CSIRO Land and Water, Division of Tropical Environments and Societies, James Cook University (JCU), Cairns, Queensland, Australia, 5 Tropical Environments and Societies, James Cook University (JCU), Townsville, Queensland, Australia, 6 Fenner School of
Environment & Society, Australian National University (ANU), Canberra, Australian Capital Territory, Australia
☯These authors contributed equally to this work. *Julen.Gonzalez@hutton.ac.uk
Abstract
A debt-based economy cannot survive without economic growth. However, if private debt consistently grows faster than GDP, the consequences are financial crises and the current unprecedented level of global debt. This policy dilemma is aggravated by the lack of analy-ses factoring the impact of debt-growth cycles on the environment. What is really the rela-tionship between debt and natural resource sustainability, and what is the role of debt in decoupling economic growth from natural resource availability? Here we present a concep-tual Agent-Based Model (ABM) that integrates an environmental system into an ABM repre-sentation of Steve Keen’s debt-based economic models. Our model explores the extent to which debt-driven processes, within debt-based economies, enhance the decoupling bet-ween economic growth and the availability of natural resources. Interestingly, environmental and economic collapse in our model are not caused by debt growth, or the debt-based nat-ure of the economic system itself (i.e. the ‘what’), but rather, these are due to the inappropri-ate use of debt by privinappropri-ate actors (i.e. the ‘how’). Firms inappropriinappropri-ately use bank credits for speculative goals–rather than production-oriented ones–and for exponentially increasing rates of technological development. This context creates temporal mismatches between natural resource growth and firms’ resource extraction rates, as well as between economic growth and the capacity of the government to effectively implement natural resource conser-vation policies. This paper discusses the extent to which economic growth and the availabil-ity of natural resources can be re-coupled through a more sustainable use of debt, for instance by shifting mainstream banking forces to partially support environmental conserva-tion as well as economic growth.
a1111111111 a1111111111 a1111111111 a1111111111 a1111111111
OPEN ACCESS
Citation: Gonzalez-Redin J, Polhill JG, Dawson TP, Hill R, Gordon IJ (2018) It’s not the ’what’, but the ’how’: Exploring the role of debt in natural resource (un)sustainability. PLoS ONE 13(7): e0201141.
https://doi.org/10.1371/journal.pone.0201141
Editor: Marı´a Carmen Dı´az Rolda´n, Universidad de Castilla-La Mancha, SPAIN
Received: April 19, 2018
Accepted: July 8, 2018
Published: July 20, 2018
Copyright:©2018 Gonzalez-Redin et al. This is an open access article distributed under the terms of theCreative Commons Attribution License, which permits unrestricted use, distribution, and reproduction in any medium, provided the original author and source are credited.
Data Availability Statement: All relevant data are within the paper and its Supporting Information files.
Funding: The authors received no specific funding for this work.
Introduction
Humanity has failed to make sufficient progress in solving most environmental challenges, such as climate change, freshwater availability, deforestation, marine fisheries collapses, among others [1]. This has produced a number of discussions that highlight the impossibility of continuous economic growth within the ecological boundaries of our planet [2,3]. There-fore, preventing the collapse of the systems that support life on this planet will probably require economic growth to be decoupled from the environmental impact of the economy [4].
A popular critique of the economic-financial system says that, because banks create money in the form of interest-bearing debt, the system necessarily requires an expanding money sup-ply to pay this interest [5]. The expanding money supply is argued to enhance an economic growth imperative that forces society to generate an ever-increasing income flow. As a result, more and more debt is accumulated, while more future growth is needed to repay the debt [6]. Thus, the cycle continues. This monetary business-as-usual trajectory requires the production of more goods and services [7]–along with pollution and resource use–and enhances the prob-ability of system breakdown [8].
In this regard, the last financial crisis in 2008 confirmed that the dominant neoclassical models of macroeconomics were seriously flawed [9]. Policy makers, who relied upon models that were not able to predict the actual behaviour of financial markets, were misled, and the credibility of economic theory has been widely called into question [10]. Hence, there is a need to develop new economic models that replicate the actual nature of the economy [9] and transdisciplinary app-roaches that address the impact of the economy on natural systems [11,12]. While there has been much attention on studying the actual nature of both economic and ecological systems indepen-dently, the attempts to do so for coupled social-ecological systems (SES) are at an early stage [13]. SESs are dynamically complex systems composed of people and nature [14], emphasizing that humans should be seen as a part of, not apart from, nature [15]. Modelling and exploring coupled SESs is an important step forward, since those economic models not considering environmental implications (e.g. resource availability, pollution) are more likely to show pathways towards false sustainable economic states [16]. Yet, the capture of environment constraints, through integration of environmental variables within economic models, could help developing more realistic, long-run scenarios [17].
models solving the paradox of how monetary profits can be generated by private actors in debt-based economies. As explained in the methodology, we argue that this idea justifies a continuous, yet potentially unsustainable, economic growth. However, Keen’s models do not consider the impacts that debt-growth cycles have on the environment, which in our view provides a suitable platform to explore the relationship between debt and natural resource (un)sustainability. The next sections describe the modelling framework in detail, followed by model findings and a dis-cussion on the extent to which monetary debt is a key factor driving natural resource (un)sus-tainability in complex SES.
Methodology
Agent-based social-ecological systems modelling: Integrating an
environmental system into Steve Keen’s economic models
The lack of complexity in neoclassical economic models reduces their capacity to describe, in detail, any society ever observed [24]. For instance, scholars argue that the mainstream economic models used by some financial entities (e.g. Wall Street) have not been built to understand the complexities of the economic system, but rather to provide tractable results and straight-forward ways to implement policies [25]. Furthermore, while attempts to model the economic system exist, for instance through system dynamics modelling (e.g. [26]), most economic models only focus on financial processes and do not analyse their impacts on the environment. These models have been capable of modelling economic phenomena such as money [26], bounded rationality [27] or income distribution [28], yet they are especially weak in regard to ecological variables and to feedback channels between the environment and economy. Thus, the contribution of eco-nomic models that explore alternative structures for more sustainable economies, such as “green growth” [29], “steady state” or “degrowth” approaches [30,31], is rare.
There is a need to understand complex systems behaviour, such as those between economic systems and the environment, through novel non-linear modelling tools. In this regard, ABM has been receiving significant attention recently, being widely employed across fields that are as diverse as biology [32], business [33], education [34], geography [35], health care [36], political sciences [37] and sociology [38]. ABM explores how interactions between agents (e.g. entities, people, non-human beings) affect the system and their own behaviour through the property of emergence [39]. The main characteristics of ABMs, and the benefits of using ABM to simulate complex SESs, include: (i) capturing ofemergentsystem phenomena; (ii) agentheterogeneity (allowing modelling complex and non-linear behaviour); (iii) integration of socio-economic networksand physical space-basedinteractions; and (iv)dynamical naturaldescriptions of SESs, instead of solely analysing final model results [40].
These characteristics provide ABM the capacity to model complex SESs through interdisci-plinary approaches. Yet, the majority of ABMs in literature are single-disciinterdisci-plinary. For ins-tance, the field of Agent-Based Computational Economics (ACE) has explored features of economies as complex systems [26,27], while Individual-Based Modelling (IBM) has been widely used in ecology, even to a greater extent than in economics [41,42].
using Keen’s work lies in its capacity to explain the paradox of how monetary profits are gener-ated in debt-driven capitalist systems–an explanation that economics had failed to provide satis-factorily until then [44]. In short, Keen’s models demonstrated how firms and banks can make profits, through credit borrowing and lending, regardless of their increasing debt burdens and the potential economic collapse that these processes may cause. This scenario justifies the profit-seeking behaviour of these actors, as well as never-ending economic growth, where firms priori-tize debt-driven resource extraction processes because these provide them with short-term prof-its. This economic context, which we argue aligns with the business-as-usual paradigm of the current economic system, could be detrimental to achieving natural resource sustainability.
The model presented in this paper uses Keen’s debt-based approach to economic growth as a basis in order to build an ABM that explores the impacts of debt-based economies on natural resource sustainability. In particular, the model examines those debt-driven socio-economic factors that could be enhancing the decoupling between economic growth (i.e. GDP) and nat-ural resource availability.The following section describes the ABM, based on a coupled SES that integrates a simple environmental system (and the corresponding economic-environmen-tal feedbacks) within a debt-based economic system inspired by Keen’s models [9,25].
Model description: Overview, Design Concepts and Details (ODD)
The model was built using NetLogo as the modelling software [45]. Grimmet al.’s [46,47] ODD (Overview, Design concepts and Details) model description protocol was used to give an overview of the model. Here the ‘Entities, state variables and scales’ and ‘Process overview and scheduling’ sections of the ODD are integrated and presented as one single section, while the rest of the protocol can be found in theS1 Appendix.
The model consists of agents interacting within three different markets, i.e. credits, goods and labour markets, as well as the environment. The environment consists of a grid of 100×100 land parcels (patches), each of them with a biomass (resource) stock. The different types of agents in the model include: firms–which use bank credits to finance production of goods (for which extracting natural resources is needed) that are then sold to households; a commercial bank–which lends credits (loans) to firms under different financial situations; speculators–which also borrow credits to bet on the goods (assets) produced by firms, but have no hand in the sale of such goods; and the government–which implements conservation policies to preserve the stock of natural resources and counterbalance the environmental impacts exerted by economic growth. Note that only debt dynamics originated by firms and speculators are considered, i.e. neither households nor the gov-ernment borrows credits from the bank in our model. Fig A inS1 Appendixpresents a Unified Modelling Language (UML) class diagram of the model, specifying and showing the links among model entities and parameters; Table A inS1 Appendixshows a description of the parameters modelled for each entity (i.e. agent type), as well as their initial values.
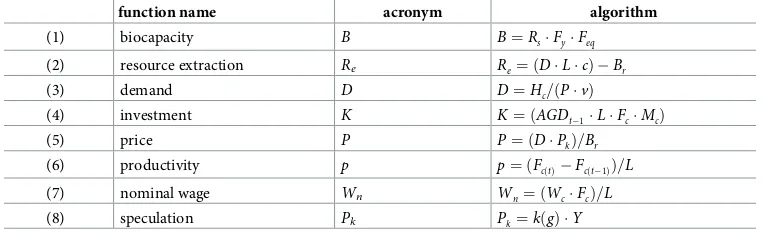
First, each land parcel (patch) computes one resource stock (Rs), which increases over time following a resource growth function. Related to this, each patch computes its own biocapacity (B) (function 1,Table 1), which refers to the capacity of the land to produce useful biomass (i.e. resources with potential to be converted to production goods), and to absorb waste biomass generated by firms [48].Bvaries based onRs, yield factor (Fy) and equivalence factor (Feq);Fy accounts for differences between countries in productivity of a given land type, whileFeq con-verts a specific land type into a universal unit of biologically productive area [48]–note that our model uses the values for forest-land for bothFyandFeq, due to the similarity between the natural resource modelled (in terms of growth-rate and extraction process) and forest-land plantations. Firms extract resources from their current patch location through a resource extracting (Re) function (function 2). The amount of resources extracted by each firm varies with each time step based on demand (D) for goods (function 3), labour (L) (i.e. workforce), the amount of resources available in firms’ biomass reserve (Br) (which permits firms to cope with periods with excess of demand or lack of resource availability), and a resource conversion factor (c). Firms’ resource extraction processes have a monetary cost for them (function 4), related to the investment (K) needed, in each time step, to generate enough goods to meet the aggregate household demand (AGD), also consideringL, the firm’s monetary capital (Fc) and an extraction-demand correction mechanism (Mc). Harvested resources are stored in each firm’s reserve, and then sold to households–after conversion to goods–at a specific price (P) value (function 5);Pvaries uponD,Br, and a speculation rate (Pk) (explained below); note that all firms in the model sell the same type of good (modelling different types of good will be sub-ject of a future version of the model).Din our model changes based onP, households’ mone-tary capital (Hc), an accelerator effect (v), and distance–note that (v) is related to the GDP, where an increase in GDP enhances (Fc) investment spending in resource extraction. Produc-tivity (p) (function 6) states the effectiveness of firms’ productive effort, which varies depending upon each firm’s profits from one year to the next (Fc(t)−Fc(t-1)) andL. Households work for
firms and receive a nominal wage (Nw) followingfunction 7.
[image:5.612.198.581.92.208.2]With regard to the bank, it possesses two different monetary capital stocks–withdrawable capital and bank reserves; while the bank reserve stock holds the monetary capital designated to lend credits to firms, withdrawable capital retains household deposits available for direct with-drawal for consumption of goods. The bank lends credits to firms based on each firm’s particu-lar financial situation, and firms have to pay the debt (with interests) back to the bank. The bank also pays deposit interests to households. Thus, the bank’s net profits vary based on the surplus generated from the difference between household deposits (losses) and credit interests from firms and speculators (gains)–note that households do not borrow credits in our model, thus not influencing debt dynamics. Credits are used by firms to cover different expenses, i.e. Table 1. Main model functions and the corresponding algorithms.
function name acronym algorithm
(1) biocapacity B B¼RsFyFeq
(2) resource extraction Re Re¼ ðDLcÞ Br
(3) demand D D¼Hc=ðPvÞ
(4) investment K K¼ðAGDt 1LFcMcÞ
(5) price P P¼ ðDPkÞ=Br
(6) productivity p p¼ ðFcðtÞ Fcðt 1ÞÞ=L
(7) nominal wage Wn Wn¼ ðWcFcÞ=L
(8) speculation Pk Pk¼k gð Þ Y
resource extraction processes, wages, investments in improving technological efficiency, and equipment and materials–note that technological efficiency is only applied to the resource ex-traction processes, i.e. to increase the productivity of extracting resources. Similarly, firms may use credits to fund business expansion, based on creating one new branch/firm in an area with high resource availability. The monetary capital available from the bank for credit lending varies based on the type of economic/banking system modelled. Thus, two different systems are com-puted: fractional-reserve banking system–with high capital available for credit lending–and full-reserve banking–with limited capital (see ‘Scenario rationale’ below).
Furthermore, speculators also borrow credits from the bank in order to carry out specula-tive processes (Pk), based on purchasing derivatives throughfunction 8, i.e. instruments to bet on what price the produced good (i.e. asset) will reach by a future date. Speculation increases with further economic growth rate (kg) and model output (Y), i.e. amount of goods producer per time step. Speculators have no hand in the sale of goods, i.e. they are not the buyer or the seller, yet they are able to affect prices through inflationary and deflationary processes. Both speculators and firms repay credits, with interests, to the bank. Finally, the government imple-ments different policies to enhance conservation of resources when the system’s natural res-ource stocks drop below specific thresholds (see ‘Scenario rationale’ below).
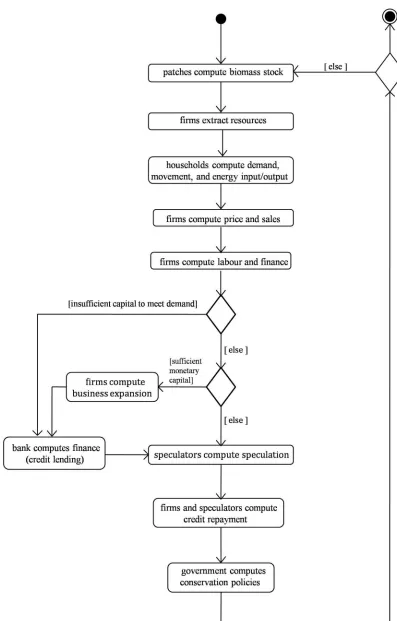
Fig 1shows a UML activity diagram of the model. This shows the links among the above-noted processes and the order in which these processes occur in each time step.
Scenario rationale, sensitivity analysis and model calibration
The model simulates two scenarios; namely fractional-reserve and full-reserve banking sys-tems. The fractional-reserve computes a cash reserve ratio of 0.02 –following the European Union’s reserve [49]. Cash reserve ratios set the minimum amount ofreserves(i.e. the bank’s holding of deposits that are not lent out as credits) that must be held by the bank. Thus, 2% is the amount of households’ deposits available for withdrawal from banks (i.e. withdrawable capital, for consumption of goods) under fractional systems, while 98% is available solely for credit allocation to firms (i.e. bank reserves). By contrast, the full-reserve banking system com-putes a cash reserve ratio of 1, where the amount of capital available for credit borrowing is very limited, since the bank must keep 100% of households’ deposits available for withdrawal. Due to the gains that the bank makes from the difference between credit interest (gains) and deposit interest (losses)–where the former are normally higher than the latter–the bank, under full-reserve systems, normally allocates more than 0% of capital for credit lending.
Fig 1. UML activity diagram. Structure diagram for each time-step in the model, showing the step by step processes computed
by agents and patches.
due to the very limited impacts exerted on the environment by the economy in this scenario–al-most non-existent compared to fractional reserve systems.
An OFAT (One-factor-at-a-time) sensitivity analysis was performed [50]. The sensitivity analysis consisted of observing changes in agents’ behaviour, as well as in model outputs, with all except one of the parameters held constant. Due to the model being particularly sensitive to changes in thecritical-biomass-stockparameter, this variable was varied through a series of dif-ferent values. This parameter states difdif-ferent natural resource threshold values, where the gov-ernment starts implementing conservation policies (i.e. govgov-ernment intervention) if the total stock of natural resources in the system drops below predefined values for critical-biomass-stock. Thus, the sensitivity analysis performed–seeS2 Appendix–shows the extent to which the main environmental (i.e. ‘Natural resource stock’) and economic (i.e. ‘Real GDP growth’) indi-cators are affected under different values of this parameter. Eachcritical-biomass-stockvalue selected for the analysis was run 100 times, which is considered a reasonable number of runs to generate valid and stable predictions in stochastic simulations [51]. The average and stan-dard error values from all the runs regarding the indicators selected are shown in the result figures.
Model calibration–seeS3 Appendix–followed a comparative analysis between our model’s and Keen’s [9,23] results, where the objective was to assess as to whether our model was able to reproduce similar patterns to those from Keen’s models. Among the scenarios modelled, the results from the fractional-reserve system (with no government intervention) were used for the calibration process. This is because Keen’s models are based on pure debt-based macroeconomic systems, with no full-reserve system included. Furthermore, government intervention in Keen’s models do not have the same objective as in our model; where the role of government in his model is to help overcoming an exogenously (to the model) set credit crunch, while our model seeks to explore the endogenous role of conservation governance in preserving natural resources. Regardless of the conceptual nature of our model, its qualitative behaviour shows matching pat-terns with regard to those from Keen [9,23]–seeS3 Appendix; especially during the first period of the simulation (i.e. economic boom) under our fractional-reserve system (seeResults). After then, our results and Keen’s partially differ, mainly based on the integration of environmental constraints to our model, which contrast to Keen’s pure macroeconomic approach.
Results
The results analysis compares and identifies qualitative differences in trends among indicators.
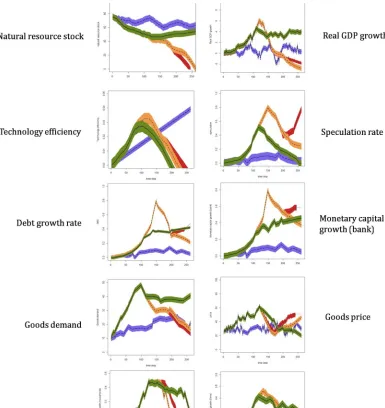
Fig 2shows the modelling results obtained under non-debt (full-reserve) and debt-based (frac-tional-reserve) economic systems, the latter also including government intervention through conservation policies for two differentcritical-biomass-stockthresholds (25% and 50%). The selection of these two values–among a total of twelve–was based on the results obtained from the sensitivity analysis (seeS2 Appendix).
Fractional-reserve and full-reserve systems (no government intervention)
capital’ indicators, red-dotted curve,Fig 2). From an environmental perspective, the increasing extraction of resources affects natural resource stocks, thus showing decreasing values during the simulation.
[image:9.612.187.572.75.483.2]At the same time, the rise in speculation shows that some monetary capital funding eco-nomic growth enters the system according to speculative goals, instead of purely production-oriented goals. This is due to the presence of speculator agents, which also borrow credits to gain future profits by trading assets on a rising market. As credit borrowing by speculator agents occurs when prices and GDP increase, this process starts enhancing price inflation and, as a result, further speculation. This reinforcing cycle enhances a growing debt burden that adds no productivity value to the system(see the period 0–120 for ‘Debt growth rate’). Fig 2. Simulation results. Results obtained for the indicators selected under a fractional-reserve system–without
government intervention (red dotted line) and with government intervention when the total natural resource stock is at 25% (yellow short-dash) and 50% (green solid line)–and under a full-reserve system (purple long-dash line). Black coloured curves (i.e. dotted, solid, short and long-dashed) show the mean values, whereas coloured bands represent the standard error bars including all the runs computed for each indicator under every scenario.
Once the simulation exceeds 100-time-steps, price inflation has reached its peak due to speculation, economic growth and the increasing debt burden. As a result, demand over goods and firms’ monetary capital decreases, which in turn reduces labour–due to the inability of firms to pay for households’ wages. This loss of purchasing power by households enhances a deflationary process, while firms are no longer able to fund investment in technological devel-opment for improving production efficiency. Furthermore, price deflation reduces specula-tion, since the number of speculators in the system is directly correlated with inflationary processes. Thus, most speculators go bankrupt, which reinforces further price deflation. In particular, bankruptcy takes place among those speculators with low monetary capital, who are not willing to borrow further credits. Because most speculators are not able to pay back debt credits to the bank, unpaid debt stocks become the bank’s debt. This reduces the capital available from the bank for credit lending, thus creating a domino effect affecting firms. From an environmental perspective, the reduction of resource extraction processes benefits natural resource stocks, which show steady state values for the first time during the simulation (see the period 125–175 for ‘Natural resources stock’ indicator).
Eventually, the reduction in prices encourages higher household demand for goods and a period of system stability. However, because this rise is not sufficient to increase firms’ mone-tary capital, GDP values continue to decrease–albeit at a lower rate than under high speculation values. The economy starts to recover slightly, and the rise in prices (>175-time-steps) attracts speculator agents again, which enhances debt stocks and further increase in prices–albeit at a lower rate than at the beginning of the simulation. Because natural resources are almost fully depleted from the excessive resource extraction, both firms’ income and production of goods are affected, thus reducing the capacity of firms to repay borrowed credits back to the bank. This new context affects banks, firms and speculator agents negatively. Eventually, natural resource collapse occurs, thus creating the breakdown of the system and ending the simulation.
Fig 2also shows the results obtained under a full-reserve system (see purple long-dashed curves in this figure), where the bank is forced to keep 100% of the deposits available for with-drawal. As previously explained, the amount of capital allocated by the bank for credit lending is not 0%–albeit very low, since the bank still generates money for credit lending from the dif-ference between credit interests (gains) and deposit interests (losses).
Under this scenario, most environmental and economic indicators remain relatively stable over time, compared to those under fractional-reserve systems. Yet, this stability is achieved at low ranges of values regarding ‘Natural resources stock’, ‘Real GDP growth’, ‘Debt growth rate’, ‘Speculation rate’, and ‘Monetary capital growth (firms, households and bank)’, as well as the rest of indicators. Basically, the low allocation of credits (debt) by the bank for both pro-duction-oriented (through firms) and speculative (through speculators) goals creates a system with low income and profits, yet also with low environmental impacts. As a result, model results neither show economic nor environmental collapses during the simulation period, since the risk of natural resource depletion, as well as high speculation, debt or inflation rates (which increase the probability of economic collapses) is low.
Government intervention in fractional-reserve systems
points), our analysis focuses on the importance of government intervention, as a whole, under potentially unsustainable debt-based economic systems.
Fig 2shows that conservation policies implemented only after ‘Natural resources stock’ drops below 25% of its initial capacity are not able to prevent system collapse (see yellow short-dash curves). In particular, the small amount of natural resources left by then, as well as the high rates of technological development and resource extraction processes, create an unsolvable context for the government in terms of avoiding system collapse. Interestingly, GDP, after government intervention, decreases over time at a higher rate than under frac-tional-reserve systems with no government intervention. In contrast, conservation policies implemented before the system’s total natural resource stock drops below 50% (green solid curves) are able to enhance natural resource stability over time, with no system collapses dur-ing the simulation period.
Discussion
The robustness of our model results is based on the integration of Steve Keen’s economic mod-els, which were calibrated against key variables in OECD economies. Thus, the economic dimension of our ABM integrates functions, processes and entities that were able to reproduce real macroeconomic trends (e.g. for debt dynamics) between 1970 and 2010 (see calibration in
S3 Appendix). With regard to the environmental dimension, the ABM computes simple envi-ronmental equations, and processes, which are integrated into the economic system–thus forming the SES presented. Considering that there is no perfect model that works in all settings [52], our theoretical (environmental) algorithms and coefficients cannot be applied worldwide. Yet, the overall results obtained for the debt-sustainability relationship are considered to be reliable and stable to reasonable changes in specifications, above all in those countries with strong debt-sustainability relationships. Furthermore, our model provides a platform that can be further specified and applied across multiple empirical case-studies.
Answering our research question (seeIntroduction), the exploration of the viability and sustainability of the system modelled reveals its susceptibility towards instabilities related to monetary debt. Debt is an economic phenomenon that has been widely accepted by neoclassi-cal and the so-neoclassi-called Keynesian approaches of the economy [53]. Our model shows that the current debt-driven monetary system creates the conditions in which continual economic growth–which is the overriding economic objective of most countries–becomes a necessity. The model of debt-fuelled growth requires ever-faster growth rates to allow the repayment of ever-increasing debt [54], and ever-faster growth requires, currently, an ever-increasing pro-duction and sale of goods and services, thus increasing the use of resources and emission of pollutants [7]. Under this context, natural resource sustainability is challenged by the depletion of natural resources driven by increasing debt stocks. Thus, the difficulty of avoiding collapse under these conditions may help explaining why monetary debt is a key factor with regard to (un)sustainable outcomes.
our results, we argue that the system does not impose a growth imperativeper se, i.e. the debt-based economic system may not be, by definition, environmentally unsustainable. Rather, agents’ behaviour through the use of credits and the system’s dynamics show a tendency to increase natural resource unsustainability. In short, is not only the “what”–the (type of) sys-tem–that matters, but the “how”–the role of entities and credits in the system, and their rela-tionships with the environment.
This idea aligns partially with the hypothesis proposed in this paper, which stated that highly-debt dependent economies exert negative effects on natural resource stocks. Yet, our results show that this is not due to debt itself, but the type of use that is made of it. The impor-tance of this argument lies in the fact that one of the many criticisms of the monetary system is that the growth imperative is induced by the system itself because society receives less money (the principal of a loan) than that they have to pay back (principal + interest) [5]; this would induce agents to either monetize and liquidate the natural capital still available as unused resources, or to increase productivity. However, because the total factor productivity (TFP)– which refers to the portion of output not explained by the amount of inputs used in produc-tion–only grows at an average of 1.006% in the OECD including energy [55]–which could be increased to yield the required growth–, economic growth is achieved mainly by using greater stocks of natural resources. Thus, the profit-seeking behaviour of firms and speculative agents, i.e. seeHomo economicusin [56], drives the inappropriate use of credits (debt), which conse-quently brings about systemic instability and negative implications for sustainable
development.
In our model, the specific uses that firms make of credits are based on (i) processes related to asset speculation and (ii) exponential investments in technological development, both of them enhancing the disjunction between economic and environmental systems. The following sections analyse the implications of these elements for (de)coupling economic growth from environmental pressures.
The speed of technological development
In the model, the government implements restrictive credit lending policies that prevent firms from further investing in technological development. Thus, technological efficiency–and with that, the production of goods–grows at a faster rate with no government intervention (seeFig 2). Unexpectedly, natural resource collapse, under no government intervention scenarios in fractional-reserve systems, occurs when technology efficiency shows lower values compared to full-reserve systems. It would have been expected that technological development should reach higher values in the former, due to higher investments through credits (see ‘Technology effi-ciency’,Fig 2). Therefore, collapses in the model are not specifically driven by the net peak val-ues reached by technology efficiency (i.e. the higher the technological efficiency, the higher the chances for system collapses to occur), but rather by thespeed(i.e. growth rate) at which tech-nological development takes place. Thus, technology efficiency under full-reserve systems– with low investments in technological development–reaches a higher long-term net value compared to fractional reserve systems (with no government intervention), yet the speed of reaching this value is higher in the latter.
technology and innovation [57], considering that technology efficiency and development have tended to accelerate over the last decades [58]. It should be highlighted that economists have usually resorted to technology and innovation as a source of ever-increasing efficiency and eco-nomic growth, regardless of the uncertainty and unpredictable nature of technological innova-tion [59]. However, technological progress is, in fact, a discontinuous process, where most significant innovations occur by “fits and starts” [59]. The discontinuous nature of technology has the risk of affecting the entire economic system and can lead to far-reaching changes in dif-ferent social factors [60], as well as socioeconomic collapse [61]. Moreover, the Jevons Paradox establishes that increases in efficiency of resource use are usually outpaced by the rate at which consumption of those resources increases [62]. Overall, there is a tendency, in our society, to believe in technology despite the lack of support for this proposition; it is either an article of faith or based on statistically flawed extrapolations of historical trends [63].
Nevertheless, it is important to note that technological development can be applied to dif-ferent fields and, therefore, have difdif-ferent implications for natural resource sustainability. In our model, technology refers to improving resource extraction efficiency and production pro-cesses, thus enhancing the above-noted negative environmental impacts. However, technologi-cal development focused on improving waste management (i.e. increase the amount of waste re-used and re-cycled), for instance, would probably be beneficial for the environment. There-fore, it is important to specify and analyse the particular use of technological development at the time of performing sustainability analysis. Under our particular context, a slower, yet con-stant, increase in technological development, focused on production efficiency (such as that shown under our full-reserve system scenario), could help creating win-win scenarios for GDP and natural resource availability.
Speculation and price volatility
International policy makers and non-governmental actors have become increasingly con-cerned that the entry of speculators into the system might distort commodity prices by creat-ing excess price volatility [64,65]. In our model, the fractional-reserve banking scenario tends to create volatile, artificial and difficult-to-predict speculative markets. Thus, monetary debt is not used by the private sector to increase profits through increasing productivity and, thereby, benefit society (e.g. by enhancing technological efficiency); rather, it is mainly used by specula-tors to increase their own profits. Our results align with Keen [23], who states that money funding in the current debt-based economic system occurs according to speculation, instead of production-oriented goals–which enhances the possibility of economic collapses, instability and natural resource unsustainability, as shown by our model.
and economic instability was observed in the U.S. oil market–see [68] and [69] for a detailed description.
Commodity price changes need to be linked to supply-demand processes and the availability of natural resources, rather than speculative processes. Our model shows the extent to which prices and demand processes, under fractional-reserve systems, are highly influenced by eco-nomic factors (i.e. the grade of speculation in the system), rather than environmental (i.e. resource availability). Thus, those periods when speculation follows positive increasing trends (seeFig 2) show weak coupling values between the economy (represented by the GDP) and the environment (represented by natural resource stocks). In contrast, those periods where artificial speculative markets are absent show contexts where economic elements are strongly coupled to the environment. Under low debt stocks, therefore, the market economy is highly influenced by the state of the environment, i.e. economic growth is aligned with the availability of natural resources, while the opposite is the case in systems with high debt-based speculative processes. It is important to reduce the level of speculation and speculative markets originated in the sys-tem, which could help moving towards decoupling GDP and natural resource use values.
Government responses to natural resource unsustainability
Our results show that the economy does not necessarily have to grow or become unstable due to the debt burden encouraged by the monetary system; yet this is the common outcome because of the inappropriate use that firms make of credits, i.e. for speculative and the pace of increasing technology efficiency processes. In the model, this conflict is addressed by imple-menting government policies focused on enhancing natural resource conservation and more sustainable firm practices. In particular, late government intervention is not able to neither enhance a reduction of firms’ resource extraction rate nor increase resource replenishment rates. In this regard, a problem arises related to the difficulty to detect tipping points and pre-dict environmental changes in complex coupled SES [70]. Complex systems are characterized for having multiple scales, non-linearity and interactive dynamics that are often unpredictable [71,72]. Therefore, institutions have the difficult task of anticipating the complexity of SES dynamics over multiple temporal and spatial scales to avoid SES collapse, as seen, for example, in common pool resources, such as marine fisheries [73,74]. In this regard, system unpredict-ability is enhanced not only by high technological development rates, but also due to specula-tion. As previously discussed, prices and demand processes are highly influenced by the grade of speculation in the system under fractional reserve systems, rather than by the availability of natural resources. Hence, high speculative debt-driven economies enhance the decoupling between economic and environmental systems.
environmental degradation reinforced by the private sector. Using climate change as an example, Nordhaus [78] argues that limited and gradual government interventions in the economy are necessary. Optimal regulation should reduce long-run growth by only a modest amount. Stern’s view [79] is less optimistic; it calls for more extensive and immediate interventions and argues that these interventions need to be in place permanently even though they may entail significant economic cost. The more pessimistic answers, such as those coming from degrowth economics [31,80,81], argue that, essentially, all growth needs to come to an end in order to save the planet. We argue that our results stand between Stern and Nordhaus viewpoints: gradual, yet not mar-ginal, and strong interventions under business-as-usual scenarios are needed to prevent the economy from collapsing–not because the current debt-based market economy is,per se, unsus-tainable (as previously discussed), but rather because natural resource unsustainability is en-hanced by agents’ and entities’ particular behaviours and dynamics.
Conclusion
The results of our model show that debt-bearing economic systems can result in a complete collapse of both natural and economics systems. Debt is an enabling factor in the exploitation of natural resources for rational individual benefit and short-term gain, hindering long-term environmental and economic sustainability. However, our results show that debt-driven frac-tional-reserve economic systems do not impose a growth imperativeper se, i.e. the debt-based system is not by definition unsustainable. Rather, the behaviour of entities and agents, and their decisions and relationships with regard to the environment, show a tendency to increase natural resource unsustainability. In the model, the particular uses that firms make of credits– causing the decoupling between GDP and resource availability–are based on (i) speculation, and (ii) exponential investments on technological development. Thus, it is argued that the profit-seeking behaviour of firms and speculative agents drives the inappropriate use of credits (debt), which consequently brings about systemic instabilities and negative implications for sustainable development.
The current version of the model should be considered as a conceptual tool that can be used to theoretically examine the relationship between debt and natural resource sustainability. Moreover, the model provides an analysis of the role of the monetary system in the economy and strongly suggests that macro-economic models should incorporate the banking sector if they are to become more relevant. Future versions of the model will include the integration of households as credit borrowers, thus including household speculation and desires. Further-more, areas for improvement of the model include (1) disaggregating resources into ‘conven-tional’ (e.g. oil, food) and ‘non-conven‘conven-tional’ (e.g. timber), reflecting higher or lower household consumption dependences on such resources; (2) disaggregating conservation policies; and (3) introducing multiple coupled regions to represent countries with different policies.
Supporting information
S1 Appendix. Overview, Design Concepts and Details (ODD) Protocol. Standardized
proto-col describing the ABM in detail. (PDF)
S2 Appendix. Sensitivity analysis. Sensitivity analysis of the ABM, focused on analysing
changes in model outputs with all parameters constant but thecritical-biomass-stockparameter (for which a series of different values are considered).
S3 Appendix. Model calibration. Calibration of the ABM, based on a comparative
(qualita-tive) analysis between Keen’s (2009, 2010a) results and our ABM results. (PDF)
Author Contributions
Conceptualization: Julen Gonzalez-Redin, J. Gareth Polhill, Terence P. Dawson, Iain J.
Gordon.
Data curation: Julen Gonzalez-Redin. Formal analysis: Julen Gonzalez-Redin.
Investigation: Julen Gonzalez-Redin, Terence P. Dawson. Methodology: Julen Gonzalez-Redin, J. Gareth Polhill. Software: Julen Gonzalez-Redin, J. Gareth Polhill.
Supervision: J. Gareth Polhill, Terence P. Dawson, Rosemary Hill, Iain J. Gordon. Validation: Julen Gonzalez-Redin, J. Gareth Polhill.
Writing – original draft: Julen Gonzalez-Redin.
Writing – review & editing: Julen Gonzalez-Redin, J. Gareth Polhill, Terence P. Dawson,
Rosemary Hill, Iain J. Gordon.
References
1. Ripple WJ. World Scientists’ Warning to Humanity: A Second Notice. Bioscience. 2017; bix 125. 2. Jackson T. Prosperity without Growth–economics for a finite planet. London: Routledge; 2009. 3. Martinez-Alier J, Pascual U, Vivien F-D, Zaccai E. Sustainable de-growth: mapping the context,
criti-cisms and future prospects of an emergent paradigm. Ecological Economics. 2010; 69: 1741–1747. 4. Smith M, Hargroves KC., Desha, C. Cents and Sustainability—Securing Our Common Future by
Decoupling Economic Growth from Environmental Pressures, London: Earthscan; 2010. 5. Sorrell S. Energy, Growth and Sustainability: Five Propositions, Sussex Energy Group Conference
‘Energy transitions in an interdependent world’, 25–26 February. Sustainability. 2010; 2:1784–1809. 6. Daly H. From a failed-growth economy to a steady-state economy. Solutions. 2010; 1:37–43. 7. Huber J, Robertson J. Creating New Money–A Monetary Reform for the Information Age. 2000.
Lon-don: New Economics Foundation.
8. Korotayev AV, Tsirel SV. A Spectral Analysis of World GDP Dynamics: Kondratiev Waves, Kuznets Swings, Juglar and Kitchin Cycles in Global Economic Development, and the 2008–2009 Economic Cri-sis". Structure and Dynamics. 2010; 4(1): 3–57.
9. Keen S. Solving the paradox of monetary profits. Economics: The Open-Access, Open Assessment E-Journal. 2010a; 4(2010–31): 1864–6042.
10. Keen S. A model of endogenous credit creation and a credit crunch. Paul Woolley Financial Markets Dysfunctionality Conference, 2011.
11. Lang DJ, Wiek A, Bergmann M, Stauffacher M, Martens P, Moll P, et al. Transdisciplinary research in sustainability science: practice, principles, and challenges. Sustain Sci. 2012; 7: 25–43.
12. Mauser W, Klepper G, Rice M, Schmalzbauer BS, Hackmann H, Leemans R, et al.Transdisciplinary global change research: the co-creation of knowledge for sustainability. CurrOpin Environ Sustain. 2013; 5: 420–431.
13. Fischer J, Gardner TA, Bennett EM, Balvanera P, Biggs R, Carpenter S, et al. Advancing sustainability through mainstreaming a social-ecological systems perspective." Current Opinion in Environmental Sustainability. 2015; 14: 144–149.
15. Berkes F, Folke C (Eds.). Linking Social and Ecological Systems: Management Practices and Social Mechanisms for Building Resilience. Cambridge University Press, New York; 1998.
16. Keen S. Finance and economic breakdown: modeling Minsky’s financial instability hypothesis. Journal of Post Keynesian Economics. 1995; 17 (4): 607–635.
17. Giraud G, Isaac FM, Bovari E, Zatsepina E. Coping With The Collapse: A Stock-Flow Consistent, Mone-tary Macro-dynamics of Global Warming. AIEE Energy Symposium; 2016.
18. Ferber J. Multi-agent systems: an introduction to distributed artificial intelligence. Addison-Wesley Longman, Harlow, UK, 509; 1999.
19. Balbi S; Giupponi C. Agent-Based Modelling of Socio-Ecosystems: A Methodology for the Analysis of Adaptation to Climate Change. International Journal of Agent Technologies and Systems. 2010; 2: 17–38. 20. Filatova T, Verburg PH, Parker DC, Stannard CA. Spatial agent-based models for socio-ecological
sys-tems: challenges and prospects. Environ. Model. Softw. 2013; 45 (0): 1–7.
21. Schulze J, Muller B, Groeneveld J. Grimm V. Agent-Based Modelling of Social-Ecological Systems: Achievement, Challenges, and a Way Forward. JASS. 2017; 20(2): 8.
22. Antoniades A., Antonarakis A. and Schroeder P. (2017). Assessing the impact of Debt on Forest Cover, Air Pollution and Resource Efficiency. Sussex Sustainability Research Programme (SSRP), University of Sussex.
23. Keen S. Household Debt-the final stage in an artificially extended Ponzi Bubble, Australian Economic Review. 2009; 42: 347–357.
24. Moss S. Agent-Based Modelling and Neoclassical Economics: A critical Perspective. In Meyers R.A. (Ed.), Complex Systems in Finance and Econometrics (pp. 22–23). New York, NY: Springer; 2009. 25. Farmer JD, Foley D. The economy needs agent-based modelling. Nature. 2009; 460(7256): 685–686.
https://doi.org/10.1038/460685aPMID:19661896
26. Godley W, Lavoie M. Monetary Economics: An Integrated Approach to Credit, Money, Income, Produc-tion and Wealth. Basingstoke: Palgrave Macmillan, 2007.
27. Tesfatsion L. Agent-based Computational Economics (ACE). 2006. Available from:http://www2.econ. iastate.edu/tesfatsi/ace.htm. Cited 14 Nov 2017.
28. Hein E. Finance-dominated capitalism and re-distribution of income–a Kaleckian perspective. Cam-bridge Journal of Economics. 2014; 36: 325–354.
29. OECD. Towards green growth–A summary for policy makers. OECD Meeting of the Council at Ministe-rial Level, 25–26 May 2011, Paris.
30. Daly H. Towards an environmental macroeconomics. Land Econ. 1991; 67(2): 255–259. 31. Jackson T, Victor PA. Does slow growth lead to rising inequality? Some theoretical reflections and
numerical simulations. Ecological Economics. 2015; 121: 206–219.
32. Politopoulos I. Review and Analysis of Agent-based Models in Biology. 2007. Available from:https:// www2.csc.liv.ac.uk/research/techreports/tr2007/ulcs-07-021.pdf. Cited 13 Mar. 2018.
33. North MJ, Macal CM. Managing Business Complexity: Discovering Strategic Solutions with Agent-Based Modelling and Simulation, Oxford: Oxford University Press; 2007.
34. Abrahamson D, Blikstein P, Wilensky U. Classroom model, model classroom: Computer-supported methodology for investigating collaborative-learning pedagogy. Proceedings of the Computer Sup-ported Collaborative Learning (CSCL) Conference. 2007; 8(1): 46–55.
35. Brown DG; Robinson DT. Effects of heterogeneity in residential preferences on an agent-based model of urban sprawl. Ecology and Society. 2006; 11(1).
36. Effken JA, Carley KM, Lee J.-S, Brewer BB. Verran JA. Simulating Nursing Unit Performance with OrgAhead: Strengths and Challenges. Computers Informatics Nursing. 2012; 30(11): 620–626. 37. Epstein JM. Modelling civil violence: An agent-based computational approach. Proceedings of the
National Academy of Sciences of the United States of America. 2002; 99(3): 7243–7250.
38. Gilbert N, Troitzsch KG. Simulation for the Social Scientist. Milton Keynes: Open University Press, Second Edition; 2005.
39. Epstein JM. Generative Social Science: Studies in Agent-Based Computational Models. Princeton Uni-versity Press. 2006.
40. Bonabeau E. Agent-based modelling: Methods and techniques for simulating human systems. PNAS. 2002; 99(3): 7280–7287.
42. Grimm V. Ten years of individual-based modelling in ecology: what have we learned and what could we learn in the future? Ecological Modelling. 1999; 115(2–3): 129–148.
43. Graziani A. The Theory of the Monetary Circuit. Economies et Societes. 1990; 24(6): 7–36.
44. Bruun C; Heyn-Johnsen C. The Paradox of Monetary Profits: An Obstacle to Understanding Financial and Economic Crisis? Managing Financial Instability in Capitalist Economies. 2009; 25.
45. Wilensky U. NetLogo [computer software]. Center for Connected Learning and Computer-Based Modeling. Northwestern University, Evanston, IL. 1999. Available from:http://ccl.northwestern.edu/ netlogo. Cited 13 October 2017.
46. Grimm V, Berger U, Bastiansen F, Eliassen S, Ginot V, Giske J, et al. A standard protocol for describing individual-based and agent-based models. Ecological Modelling. 2006; 198(1–2): 115–126.
47. Grimm V, Berger U, DeAngelis DL, Polhill JG, Giske J, Railsback SF. The ODD protocol: a review and first update. Ecological Modelling. 2010; 221(23): 2760–2768.
48. Global Footprint Network. Glossary–Biological capacity or biocapacity. 2018. Available from: footprint-network.org/resource/glossary. Cited 11 Apr 2018.
49. European Central Bank. The Monetary Policy of the ECB. 2011 [online]. Available from:https://www. ecb.europa.eu/pub/pdf/other/monetarypolicy2011en.pdf. Cited 16 Apr 2018.
50. ten Broeke G, van Voorn G. Ligtenberg A. Which Sensitivity Analysis Method Should I Use for My Agent-Based Model? Journal of Artificial Societies and Social Simulation. 2016; 199(1): 5. 51. Ritter FE, Schoelles MJ, Quigley KS, Klein LC. Determining the number of simulation runs: Treating
simulations as theories by not sampling their behaviour. In: Narayanan S. and Rothrock L. (Eds.). Human-in-the-loop Simulations: Methods and Practice. London: Springer-Verlag: pp. 97–116; 2011. 52. Ostrom E. A diagnostic approach for going beyond panaceas. Proceedings of the National Academy of
Sciences of the United States of America. 2007; 104: 15181–15187https://doi.org/10.1073/pnas. 0702288104PMID:17881578
53. Keen S. Straight Talk with Steve Keen: It’s All About the Debt (by Adam Taggart). 2010b. Available from:https://www.peakprosperity.com/blog/straight-talk-steve-keen/47466#_ftn1. Cited 18 Nov 2017. 54. Daly H. Growth, Debt and the World Bank. Ecological Economics. 2011; 72: 5–8.
55. Murillo-Zamorano LR. Total Factor Productivity Growth, Technical Efficiency Change and Energy Input. An International Frontier Analysis. The University of York Discussion Papers in Economics No. 2003/ 09; 2003.
56. Persky J. Retrospectives: The Ethology of Homo Economicus. The Journal of Economic Perspectives. 1995; 9(2): 221–231.
57. OECD. Science, Technology and Innovation in the New Economy–Poly Brief. 2000. Available from:
http://www.oecd.org/science/sci-tech/1918259.pdf. Cited 23 Jan 2018.
58. Modis T. Forecasting the growth of complexity and change. Technological Forecasting and Social Change. 2002; 69(4):377–404.
59. Lafforgue G. Stochastic technical change, non-renewable resource and optimal sustainable growth. Resource and Energy Economics. 2008; 30(4): 540–554.
60. Helpman E, ed. General Purpose Technologies and Economic Growth. MIT Press, Cambridge MA; 1998.
61. Diamond J. Collapse: How Societies Choose to Fail or Succeed. Viking press, United States; 2005. 62. Jevons WS. The Question of Coal. Macmillan, London; 1985.
63. Brown JH, Burnside WR, Davidson AD, DeLong JP, Dunn WC, Hamilton MJ, et al. Energetic Limits to Economic Growth. BioScience. 2011; 61(1): 19–26.
64. Cox CC. Futures trading and market information. J. Polit. Econ. 1976; 84: 1215–1237 24. 65. UNCTAD. Price Formation in Financialized Commodity Markets–The Role of Information, United
Nations; 2011.
66. Galaz V, Pierre J. Superconnected, Complex and Ultrafast: Governance of Hypoerfunctionality in Financial Markets. Complexity, Governance & Networks. 2017; 3(2): 12–28.
67. Gorton G, Rouwenhorst KG. Facts and fantasies about commodity futures. Financ. Anal. J. 2006; 62: 47–68.
68. Clark J. How does oil speculation raise gas prices? HowStuffWorks–Stock. 2016. Available from:
https://money.howstuffworks.com/stock-market-channel.htm. Cited 29 Jan 2018.
70. Dawson TP, Rounsevell MDA, Kluva´nkova´-Oravska´ T, Chobotova V, Stirling A. Dynamic properties of complex adaptive ecosystems: implications for the sustainability of service provision. Biodiversity and Conservation. 2010; 19(10): 2843–2853.
71. Axelrod R, Michael DC. Harnessing Complexity: Organizational Implications of a Scientific Frontier. Reprint edition. New York: Basic Books; 2001.
72. Holling CS, Berkes C, Folke C. Science, Sustainability, and Resource Management. In: Berkes F. and Folke C. (Eds.) Linking Social and Ecological Systems: Management Practices and Social Mechanisms for Building Resilience, pp. 342–362. Cambridge, UK: Cambridge University Press; 1998.
73. Beddington JR, Agnew DJ, Clark CW. Current problems in the management of marine fisheries. Sci-ence. 2007; 316:1713–1716.https://doi.org/10.1126/science.1137362PMID:17588923
74. Hardin G. The tragedy of the commons. Science. 1968; 162: 1243–1248.
75. Lebel L. Governance and the Capacity to Mange Resilience in Regional Social-Ecological Systems. Ecology and Society. 2006; 1191: 19.
76. Stiglitz DJ. Moving beyond market fundamentalism to a more balanced economy. Annals of Public and Cooperative Economics. 2009; 80(3): 345–360.
77. Koslowski P. The Ethics of Banking On the Ethical Economy of the Credit and Capital Market, of Specu-lation and Insider Trading in the German Experience. In: The Ethical Dimension of Financial Institutions and Markets. Springer, Berlin, Heidelberg; 1995.
78. Nordhaus WD. A review of the Stern Review on the economics of climate change. Journal of Economic Literature. 2007; 45: 686–702.
79. Stern N. The Economics of Climate Change: The Stern Review. Cambridge and New York: Cambridge University Press; 2007.
80. Meadows DH, Meadows DL, Randers J. Limits to Growth: The 30-Year Update. Chelsea Green Pub-lishing Co., White River Junction, Vermont; 2004.