Prolonged Evolution of Virus-Specific Memory T Cell Immunity
after Severe Avian Influenza A (H7N9) Virus Infection
Min Zhao,a,bJunbo Chen,cShuguang Tan,aTao Dong,dHui Jiang,eJiandong Zheng,eChuansong Quan,fQiaohong Liao,e Hangjie Zhang,fXiling Wang,cQianli Wang,cYuhai Bi,aFengfeng Liu,eLuzhao Feng,ePeter W. Horby,gPaul Klenerman,h George F. Gao,a,b,fWilliam J. Liu,fHongjie Yuc,e
aBeijing Institutes of Life Science, Chinese Academy of Sciences, Beijing, China
bCAS Key Laboratory of Pathogenic Microbiology and Immunology, Institute of Microbiology, Chinese Academy of Sciences, Beijing, China
cSchool of Public Health, Fudan University, Key Laboratory of Public Health Safety, Ministry of Education, Shanghai, China
dMedical Research Council Human Immunology Unit, Radcliffe Department of Medicine, University of Oxford, Oxford, United Kingdom
eDivision of Infectious Disease, Key Laboratory of Surveillance and Early-Warning on Infectious Disease, Chinese Center for Disease Control and Prevention, Beijing, China
fNHC Key Laboratory of Medical Virology and Viral Diseases, National Institute for Viral Disease Control and Prevention, Chinese Center for Disease Control and Prevention, Beijing, China
gCentre for Tropical Medicine and Global Health, Nuffield Department of Medicine, University of Oxford, Oxford, United Kingdom
hPeter Medawar Building for Pathogen Research, University of Oxford, Oxford, United Kingdom
ABSTRACT Since 2013, influenza A H7N9 virus has emerged as the most common avian influenza virus subtype causing human infection, and it is associated with a high fatality risk. However, the characteristics of immune memory in patients who have recovered from H7N9 infection are not well understood. We assembled a co-hort of 45 H7N9 survivors followed for up to 15 months after infection. Humoral and cellular immune responses were analyzed in sequential samples obtained at 1.5 to 4 months, 6 to 8 months, and 12 to 15 months postinfection. H7N9-specific antibody concentrations declined over time, and protective antibodies persisted longer in se-verely ill patients admitted to the intensive care unit (ICU) and patients presenting with acute respiratory distress syndrome (ARDS) than in patients with mild disease.
Frequencies of virus-specific gamma interferon (IFN-␥)-secreting T cells were lower in
critically ill patients requiring ventilation than in patients without ventilation within
4 months after infection. The percentages of H7N9-specific IFN-␥-secreting T cells
tended to increase over time in patientsⱖ60 years or in critically ill patients
requir-ing ventilation. Elevated levels of antigen-specific CD8⫹T cells expressing the
lung-homing marker CD49a were observed at 6 to 8 months after H7N9 infection com-pared to those in samples obtained at 1.5 to 4 months. Our findings indicate the prolonged reconstruction and evolution of virus-specific T cell immunity in older or critically ill patients and have implications for T cell-directed immunization strategies.
IMPORTANCE Avian influenza A H7N9 virus remains a major threat to public health. However, no previous studies have determined the characteristics and dynamics of virus-specific T cell immune memory in patients who have recovered from H7N9 in-fection. Our findings showed that establishment of H7N9-specific T cell memory af-ter H7N9 infection was prolonged in older and severely affected patients. Severely ill patients mounted lower T cell responses in the first 4 months after infection, while T cell responses tended to increase over time in older and severely ill patients. Higher
levels of antigen-specific CD8⫹ T cells expressing the lung-homing marker CD49a
were detected at 6 to 8 months after infection. Our results indicated a long-term
im-Received12 June 2018Accepted15 June 2018
Accepted manuscript posted online20 June 2018
CitationZhao M, Chen J, Tan S, Dong T, Jiang H, Zheng J, Quan C, Liao Q, Zhang H, Wang X, Wang Q, Bi Y, Liu F, Feng L, Horby PW, Klenerman P, Gao GF, Liu WJ, Yu H. 2018. Prolonged evolution of virus-specific memory T cell immunity after severe avian influenza A (H7N9) virus infection. J Virol 92:e01024-18. https://doi.org/10.1128/JVI.01024-18.
EditorStacey Schultz-Cherry, St. Jude Children's Research Hospital
Copyright© 2018 American Society for Microbiology.All Rights Reserved.
Address correspondence to William J. Liu, [email protected], or Hongjie Yu, [email protected].
M.Z., J.C., and S.T. contributed equally to this article. W.J.L. and H.Y. jointly supervised this work.
PATHOGENESIS AND IMMUNITY
crossm
on November 6, 2019 by guest
http://jvi.asm.org/
pact of H7N9 infection on virus-specific memory T cells. These findings advance our understanding of the dynamics of virus-specific memory T cell immunity after H7N9 infection, which is relevant to the development of T cell-based universal influenza vaccines.
KEYWORDS avian influenza A H7N9 virus, immune memory, antibodies, T cells
M
ore than 5 years have passed since avian influenza A H7N9 virus infections werefirst detected among humans in eastern China (1, 2). As of 21 May 2018, 1,625 laboratory-confirmed cases of H7N9 virus infection have been reported in mainland China, most associated with severe disease; 623 (38%) of the infections were fatal. This virus remains a major concern and a potential pandemic threat (44). Human infections with other avian influenza A H7 viruses (H7N1, H7N2, H7N3, and H7N7) have been reported sporadically (3). Most patients with H7 virus infection developed mild influenza-like symptoms such as lower respiratory tract disease, though there was one fatal case of H7N7 infection (3–5). In contrast, H7N9 viruses predominantly infect older people and have a high case fatality risk (6, 7). Although infection with H7N9 viruses can cause severe illness with a high risk of acute respiratory distress syndrome and pneumonia, a small number of mild cases or even subclinical infections have been reported (2, 8, 9). Despite these distinctive features of H7N9 infection, our knowledge of the detailed immune patterns associated with H7N9 virus infection is still limited.
Several studies of immune responses during acute H7N9 virus infection have been reported, indicating studies of host immune pathogenesis and protection mechanisms. Like with other severe avian influenza virus infections, hypercytokinemia is associated with disease severity (10). Huang et al. demonstrated that lower levels of plasma inflammatory cytokines are correlated with quick recovery, while levels of angiotensin II may be a biomarker for a fatal outcome in H7N9 infections (11). Dysfunction of interferon-induced transmembrane protein-3 (IFITM3) has been reported to be associ-ated with early hypercytokinemia in H7N9 patients and may also be predictive of a fatal outcome, as indicated in 2009 pandemic H1N1 influenza virus (pH1N1) infections (12, 13). Regarding T cell immunity, multiple reports suggest that impaired antigen-presenting capacity of monocytes and delayed T cell responses in the acute phase are associated with severe H7N9 infection (14, 15), while the presence of an early robust
CD8⫹T cell response is correlated with recovery from severe H7N9 disease (16). These
findings suggest that T cell responses in the acute phase play a pivotal role in protection against severe H7N9 disease. However, little is known about the magnitude and dynamic characteristics of the virus-specific immune memory after H7N9 infection and the association between disease severity and immune responses after recovery.
Vaccination is the most effective way to relieve the disease burden of influenza. Current influenza vaccines aim to induce neutralizing antibodies against the surface glycoproteins but are ineffective against antigenically distinct strains. An alternative approach is to elicit T cell responses targeting highly conserved internal proteins of influenza viruses (17). Cellular immunity had been showed to protect against influenza by promoting viral clearance and reducing disease severity, especially for antigenically shifted reassortant viruses (18–22). It was reported that T cell responses are better correlates of vaccine protection in the elderly than antibodies (23). However, few studies have reported the magnitude and functional dynamics of virus-specific T cell responses after influenza infection, especially considering the clinical determinants of the patients, such as different severities and ages. In the present study, we followed a cohort of patients who recovered from H7N9 infection in the 2013 and 2013-2014 epidemic seasons for up to 15 months to investigate the magnitude and functional features of H7N9 virus-specific T cell memory after H7N9 infection. We also analyzed the relationship between the H7N9 virus-specific immune response and clinical parameters and found distinct patterns of immune responses in patients with different ages and disease severities. Our findings indicate prolonged reconstruction of virus-specific T cell
September 2018 Volume 92 Issue 17 e01024-18 jvi.asm.org 2
on November 6, 2019 by guest
http://jvi.asm.org/
memory after H7N9 infection in older or critically ill patients, suggesting a distinct pattern of immune responses to this virus.
RESULTS
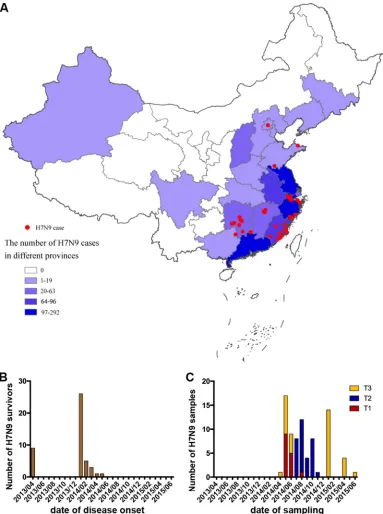
Virus-specific antibody responses in H7N9 survivors 1 year after infection.We assembled a cohort of 45 patients who recovered from H7N9 infection from six provinces across China (Fig. 1A to C). Patients from two waves of H7N9 infection were
FIG 1Geographic distribution of the H7N9 survivors and dates of disease onset and sample collection. (A) Geographic distribution of H7N9 survivors in this study (red) in comparison with the number of laboratory-confirmed cases of H7N9 virus infection in each province detected in mainland China (purple and blue). (B) Dates of disease onset in the subjects. (C) Dates of sampling of the study subjects. Samples were assigned to three time points according to the date of revisit, i.e., 1.5 to 4 months after disease onset for T1, 6 to 8 months for T2, and 12 to 15 months for T3.
Antigen-Specific Immune Memory among H7N9 Survivors Journal of Virology
on November 6, 2019 by guest
http://jvi.asm.org/
[image:3.585.42.425.71.585.2]included, nine subjects from the 2013 epidemic season and 36 subjects from the 2013-2014 epidemic season (Fig. 1B). Demographic and clinical features of these subjects are shown in Table 1. The median age was 50 years (interquartile range [IQR], 36 to 65), 42% of the patients were older than 60 years, and 71% were male. We had the acute-phase clinical data for part of the cohort. No patient received influenza vaccine within 1 year before H7N9 infection. Clinical complications included acute respiratory distress syndrome (ARDS) (50%) and respiratory failure (47%). All patients required hospitalization, and the median time of hospitalization was 21 days (IQR, 16 to 29). Thirty-nine percent of the patients required admission to the intensive care unit (ICU), and the median ICU stay time was 23 days (IQR, 11 to 26). Many patients received oseltamivir (95%), corticosteroids (61%), and mechanical ventilation treatment (35%). One to three samples were obtained from each patient within 15 months after infection. The biological sampling of the subjects was categorized into three time periods, i.e., 1.5 to 4 months after disease onset for T1, 6 to 8 months for T2, and 12 to 15 months for T3 (Fig. 1C); the median times after symptom onset were 110 days (IQR, 92 to 122) for T1, 201 days (IQR, 188 to 237) for T2, and 375 days (IQR, 362 to 397) for T3 (Table 1). Serum samples and peripheral blood mononuclear cells (PBMCs) were provided by most of the patients (Table 1). To exclude the possibility of inflammation or infection at the time of sampling, white blood cells and creatine kinase levels were tested for each subject. No patient showed leukopenia, neutropenia, lymphopenia, or raised creatine kinase or creatine phosphokinase isoenzyme levels at the time of sample collection (Table 1). To minimize the influence of recent seasonal influenza virus
TABLE 1Demographic and clinical characteristics of 45 H7N9 survivors in China
Characteristic
Valuea
All cases (nⴝ45) T1 (nⴝ19) T2 (nⴝ33) T3 (nⴝ28) Demographic features
Males 32/45 (71) 14/19 (74) 25/33 (76) 21/28 (71)
Age
Median, yr (IQR) 50 (36–65) 41 (32–73) 50 (36–65) 52 (34–65)
ⱖ60 yr 19/45 (42) 6/19 (32) 14/33 (42) 12/28 (43)
Influenza vaccination 0/28 (0) 0/12 (0) 0/20 (0) 0/16 (0)
Complications
ARDS 18/36 (50) 12/19 (63) 12/24 (50) 9/22 (41)
Respiratory failure 18/38 (47) 9/19 (47) 12/27 (44) 10/24 (42)
Treatment and clinical course
Hospitalization 45/45 (100) 18/18 (100) 32/32 (100) 28/28 (100) Median (IQR) time, days
Symptom onset to hospital admission 4 (3–6) 4 (3–6) 4 (3–6) 4 (3–6) Hospitalization 21 (16–29) 25 (17–31) 24 (15–30) 17 (13–27) ICU
Admission 14/36 (39) 9/17 (53) 12/26 (46) 6/22 (27)
Median (IQR) time of stay, days 23 (12–26) 24 (12–27) 24 (12–27) 13 (7–25)
Oseltamivir treatment 35/37 (95) 16/17 (94) 26/28 (93) 20/22 (91) Corticosteroid treatment 23/38 (61) 12/19 (63) 16/27 (59) 11/21 (52) Mechanical ventilation 12/34 (35) 5/17 (29) 8/25 (32) 7/21 (33)
Follow-up
Median (IQR) time after symptom onset, days 110 (92–122) 201 (188–237) 375 (362–397) Serum sampling 77/80 (96) 19/19 (100) 33/33 (100) 25/28 (89)
PBMC sampling 78/80 (98) 18/19 (95) 32/33 (97) 28/28 (100)
Laboratory findings at sample collection time
Leukopenia 0/78 (0) 0/19 (0) 0/31 (0) 0/28 (0)
Neutropenia 0/78 (0) 0/19 (0) 0/31 (0) 0/28 (0)
Lymphopenia 0/78 (0) 0/19 (0) 0/31 (0) 0/28 (0)
Raised creatine kinase 0/66 (0) 0/17 (0) 0/28 (0) 0/21 (0) Creatine phosphokinase isoenzymes⬎25 U/liter 0/58 (0) 0/14 (0) 0/25 (0) 0/19 (0)
aValues are numbers (percentages) unless stated otherwise.
September 2018 Volume 92 Issue 17 e01024-18 jvi.asm.org 4
on November 6, 2019 by guest
http://jvi.asm.org/
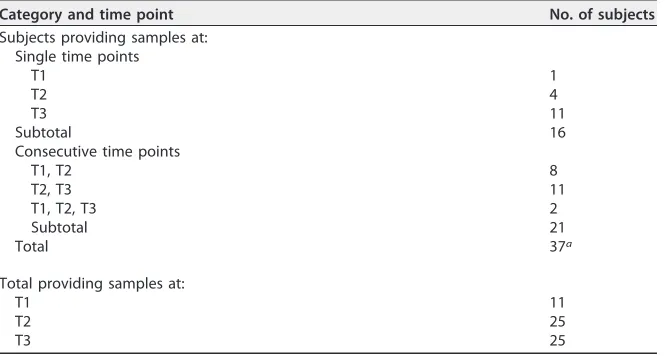
infection, which might generate spurious H7N9-specific immune responses, eight subjects with elevated (4-fold-increased) hemagglutination inhibition (HI) titers to seasonal influenza virus in sequential samples were excluded from further analyses (Fig. 2A to C); the remaining 37 patients were designated eligible subjects. The number of eligible subjects providing serum samples and PBMCs at each time point, as well as the number of patients with samples at only one time point and at two time points, is shown in Table 2.
H7N9-specific HI titers of the eligible subjects showed a significant drop at T3 (geometric mean titer [GMT], 18.1) compared with those at T1 (51.5) and T2 (38.9), indicating the decline of H7N9-specific antibody titers at 1 year postinfection (T1 versus
T3,P⫽0.02; T2 versus T3,P⫽0.003) (Fig. 2D). H7N9 HI titers wereⱖ40 in 91% (10/11),
68% (17/25), and 29% (6/21) of the subjects at T1, T2, and T3, respectively. In contrast, antibody titers against seasonal influenza A viruses (H3N2 and H1N1) were relatively stable across different time points (Fig. 2E and F). There were no detectable H7N9-specific antibodies in the control subjects (Fig. 2D). H3N2- and H1N1-H7N9-specific antibodies were not significantly different between patients and healthy controls (Fig. 2E and F).
FIG 2Humoral immune responses in H7N9 survivors after recovery. (A to C) HI titers against H7N9 (A), H3N2 (B), and H1N1 (C) in eight individuals with elevated seasonal influenza virus antibody at the T1, T2, or T3 time points. Four patients had serial samples at T1, T2, and T3, and four patients had paired specimens at T1 and T2. (D to F) HI titers against H7N9 (A/Anhui/01/2013), H3N2 (A/Switzerland/9715293/ 2013), and H1N1 (A/California/04/2009) in the H7N9 survivors (n⫽38). All eligible patients (categorized in Table 2), except for three patients who did not provide serum samples at T3, were analyzed. One patient provided samples at T1, 4 at T2, 8 at T3, 8 at T1 and T2, 11 at T2 and T3, and 2 at T1, T2, and T3. Generalized estimating equations (GEEs) were used to analyze all longitudinal data. (G to I) Patients were divided into groups by ICU admission (G), ARDS presentation (H), and ventilation status (I), and HI titers against H7N9 are shown. In the ICU admission group, one patient provided samples at T2, 2 at T3, 4 at T1 and T2, 3 at T2 and T3, and 1 at T1, T2, and T3; in patients without ICU admission, one patient provided samples at T1, 1 at T2, 4 at T3, 3 at T1 and T2, 6 at T2 and T3, and 1 at T1, T2, and T3 (G). In the ARDS group, three patients provided samples at T3, 7 at T1 and T2, and 1 at T1, T2, and T3; in patients without ARDS, one patient provided samples at T1, 1 at T2, 5 at T3, 1 at T1 and T2, 5 at T2 and T3, and 1 at T1, T2, and T3 (H). In the ventilation group, three patients provided samples at T3, 3 at T1 and T2, and 3 at T2 and T3; in patients without ventilation, one patient provided samples at T1, 1 at T2, 4 at T3, 5 at T1 and T2, 5 at T2 and T3, and 2 at T1, T2, and T3 (I). Generalized estimating equations (GEEs) were used to analyze longitudinal data in the same group across time points. The Mann-Whitney test was used for nonparametric comparisons between groups at each time point.
Antigen-Specific Immune Memory among H7N9 Survivors Journal of Virology
on November 6, 2019 by guest
http://jvi.asm.org/
[image:5.585.46.472.70.387.2]H7N9-specific antibody titers at T2 were higher in patients admitted to the ICU than in those who were not (Fig. 2G) and also were higher in patients who presented with ARDS than in those who did not (Fig. 2H). H7N9-specific antibody titers at T2 tended to be higher in patients requiring ventilation than in those without ventilation, although the difference was not significant (Fig. 2I). H7N9-specific antibody titers were not correlated with days of hospitalization or of ICU stay. These results showed that H7N9-specific antibodies decreased over time in survivors and persisted longer in patients with more severe disease.
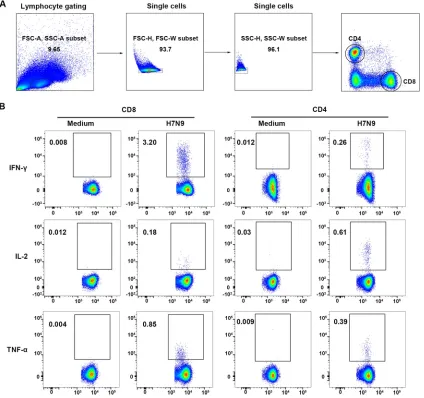
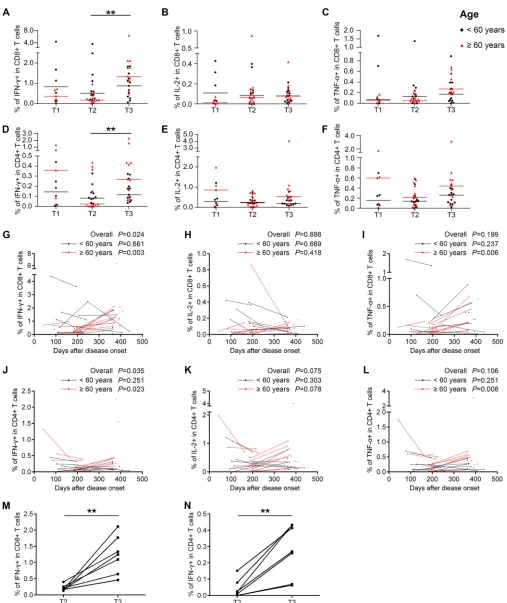
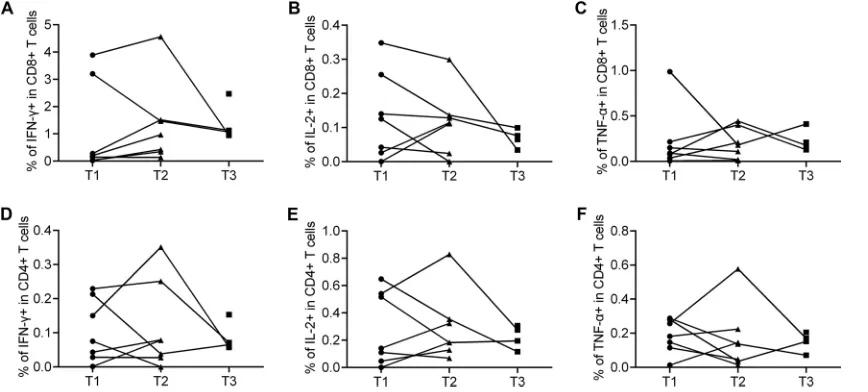
Memory T cell responses to H7N9 are associated with the age of the patient and the disease severity during infection.To characterize the cellular immune status of the recovered H7N9 patients, percentages and phenotypes of cytokine-secreting T cells in peripheral blood mononuclear cells (PBMCs) at different time points were analyzed by intracellular cytokine staining and flow cytometry after stimulation with live H7N9 viruses. The gating strategies and representative flow plots are shown in Fig. 3. The results showed that H7N9 virus-specific T cells could be detected at high levels at T3. Unexpectedly, the percentages of H7N9 virus-specific gamma interferon-positive
(IFN-␥⫹) CD8⫹T cells and IFN-␥⫹CD4⫹T cells were significantly higher at T3 than at
T2 (Fig. 4A and D). Additionally, the levels of virus-specific interleukin-2-positive (IL-2⫹)
CD8⫹T cells remained stable across the three time points (Fig. 4B), while the
frequen-cies of H7N9-specific tumor necrosis factor alpha-positive (TNF-␣⫹) CD8⫹T cells and
IL-2⫹or TNF-␣⫹CD4⫹T cells tended to increase from T2 to T3, although this was not
statistically significant (Fig. 4C, E, and F). As patients older than 60 years had a higher risk of death from H7N9 infections than patients below 60 years, we compared the levels and dynamic changes of virus-specific T cell responses between these two age
groups. The percentages of virus-specific IFN-␥⫹, IL-2⫹, and TNF-␣⫹CD8⫹T cells were
lower at T1 in patientsⱖ60 years (Fig. 4, red symbols) than in patients⬍60 years (black
symbols), although this was not significant. The percentages of virus-specific IFN-␥⫹
and TNF-␣⫹ CD8⫹ T cell responses and IFN-␥⫹, IL-2⫹, and TNF-␣⫹ CD4⫹ T cell
responses were significantly higher at T3 than at T2 in patientsⱖ60 years, while they
remained unchanged across T2 and T3 in patients⬍60 years (Fig. 4A to F).
To avoid the improper grouping of samples into time frames, which might lead to an artifact of time slots chosen, the frequencies of virus-specific T cells were plotted by sampling time, and longitudinal points from the same subjects were connected (Fig. 4G to L). A generalized estimating equation (GEE) approach was used to study the changes of virus-specific T cell responses over time, and the significance level was set at 0.05. First, all eligible subjects were included in the analysis, and the percentage of
H7N9-TABLE 2Numbers of subjects providing sera and PBMCs
Category and time point No. of subjects Subjects providing samples at:
Single time points
T1 1
T2 4
T3 11
Subtotal 16
Consecutive time points
T1, T2 8
T2, T3 11
T1, T2, T3 2
Subtotal 21
Total 37a
Total providing samples at:
T1 11
T2 25
T3 25
aEight subjects with elevated (4-fold-increased) HI titers to seasonal influenza viruses in sequential samples
(Fig. 2B and C) were excluded; the remaining 37 eligible patients were included.
September 2018 Volume 92 Issue 17 e01024-18 jvi.asm.org 6
on November 6, 2019 by guest
http://jvi.asm.org/
[image:6.585.42.375.83.261.2]specific IFN-␥⫹CD8⫹T cells (P⫽0.016) and IFN-␥⫹CD4⫹T cells (P⫽0.035) increased over time (Fig. 4G and J). Next, the patients were divided into groups by age.
H7N9-specific T cell responses remained stable in patients⬍60 years (black dots and
lines), while percentages of IFN-␥⫹, TNF-␣⫹CD8⫹T cells and IFN-␥⫹, TNF-␣⫹CD4⫹T
cells in patientsⱖ60 years (red dots and lines) tended to increase significantly over time
(Fig. 4G to L). Furthermore, when the analysis was restricted to longitudinal paired samples at T2 and T3, the results demonstrated that the percentages of H7N9-specific
IFN-␥⫹CD8⫹ T cells and IFN-␥⫹CD4⫹ T cells were increased from T2 to T3 in all
patientsⱖ60 years (Fig. 4M and N).
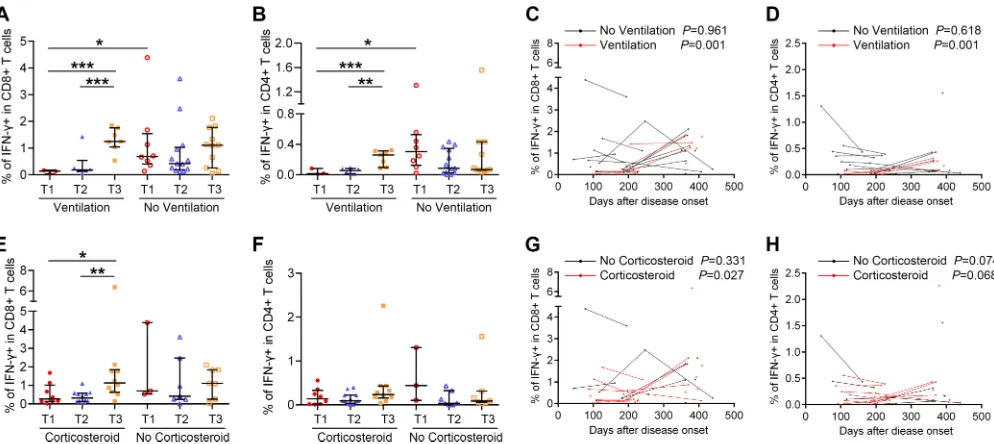
Subsequently, the magnitude and dynamic changes of virus-specific T cell responses were studied in relation to several variables, including length of hospital stay, ICU admission and days, ARDS, respiratory failure, and ventilation status during the acute phase of H7N9 infection. Among these variables, the ventilation status was found to be
related to T cell responses. The frequencies of IFN-␥⫹CD8⫹T cells and IFN-␥⫹CD4⫹
T cells at T1 were lower in patients requiring ventilation than in patients without
ventilation (Fig. 5A and B). In patients requiring ventilation, IFN-␥⫹CD8⫹and IFN-␥⫹
CD4⫹T cell responses tended to be higher at T3 than at T1 and T2 (Fig. 5A and B), and
FIG 3Flow cytometry analysis of H7N9-specific IFN-␥-, IL-2-, and TNF-␣-secreting T cells in PBMCs of H7N9 survivors. (A) Gating of CD8⫹and CD4⫹T cells. (B) Representative flow plots for the determination of IFN-␥-, IL-2-, and TNF-␣-secreting T cells. Medium, PBMCs exposed to RPMI medium containing 10% fetal calf serum as negative controls; H7N9, PBMCs stimulated with live H7N9 at an MOI of 3 for 1 h.
Antigen-Specific Immune Memory among H7N9 Survivors Journal of Virology
on November 6, 2019 by guest
http://jvi.asm.org/
[image:7.585.42.466.73.471.2]FIG 4Virus-specific T cell responses in H7N9 survivors at 1 year after infection. (A to F) Frequency of cytokine-secreting CD8⫹or CD4⫹T cells in the T1, T2, and T3 phases following H7N9 virus stimulation in all eligible patients. The frequencies of H7N9 virus-specific IFN-␥-secreting CD8⫹(A) or CD4⫹(D) T cells, IL-2-secreting CD8⫹(B) or CD4⫹(E) T cells, and TNF-␣-secreting CD8⫹(C) or CD4⫹(F) T cells were determined. Patients were divided into groups by age at disease onset of⬍60 years (black symbols) andⱖ60 years (red symbols). Generalized estimating equations (GEEs) were used to analyze longitudinal data across time points. (G to L) Frequencies of virus-specific T cells and sampling times for all eligible patients; points from the same patient are connected. Patients were divided into groups by age at disease onset of⬍60 years (black dots and lines) andⱖ60 years (red dots and lines). In the⬍60-year group, two patients provided
(Continued on next page)
September 2018 Volume 92 Issue 17 e01024-18 jvi.asm.org 8
on November 6, 2019 by guest
http://jvi.asm.org/
[image:8.585.39.546.66.669.2]they increased over time as indicated by generalized linear modeling (Fig. 5C and D). Corticosteroids had been used in the treatment of some patients during H7N9 infec-tion, which may influence the patient’s immune response. However, the percentages of
H7N9-specific IFN-␥⫹CD8⫹and CD4⫹T cells were not significantly different between
patients with and without corticosteroid treatment at each time point (Fig. 5E and F).
The percentage of IFN-␥⫹ CD8⫹ T cells was higher at T3 than at T1 and T2 in
corticosteroid-treated subjects (Fig. 5E). The results of GEE estimation showed that the
frequencies of virus-specific IFN-␥⫹CD8⫹T cells increased significantly over time in
corticosteroid-treated patients (Fig. 5G), while no correlation between T cell response and time was found in patients without corticosteroid treatment. Information about the duration of corticosteroid treatment and how patients were chosen to receive therapy was not available in this study. Patients treated with corticosteroids had more severe disease, with more of them progressing to ARDS and requiring ventilation than patients without corticosteroid treatment. The correlation between corticosteroid treatment and T cell response might be attributed to other factors. To clarify the contributions of age group, ventilation status, and corticosteroid treatment on the magnitude and dynamic changes of virus-specific T cell responses, multivariable models were adjusted for age, ventilation status, and corticosteroid treatment. The results showed that age group and ventilation status but not corticosteroid treatment were independent predictors of an increase of virus-specific T cell responses over time. To rule out that these observations were not influenced by H7N9 reinfection or seasonal influenza virus
FIG 4Legend (Continued)
samples at T2, 7 at T3, 4 at T1 and T2, 4 at T2 and T3, and 2 at T1, T2, and T3; in theⱖ60-year group, one patient provided samples at T1, 2 at T2, 4 at T3, 4 at T1 and T2, and 7 at T2 and T3 (A to L). GEEs were used to analyze the dynamic changes of virus-specific T cell responses over days after disease onset in all patients and in patients⬍60 years orⱖ60 years (A to L). (M and N) Changes of frequencies of IFN-␥-secreting CD8⫹(M) and CD4⫹(N) T cells in longitudinal paired samples at T2 and T3 from patients agedⱖ60 years following H7N9 virus stimulation. Seven patients with samples at both T2 and T3 were included. The pairedttest was used for the pairwise analysis.
FIG 5Relationship between H7N9-specific T cell responses and disease variables and severity. (A and B) Percentages of H7N9 virus-specific IFN-␥-secreting CD8⫹or CD4⫹T cells at T1, T2, and T3 in subjects requiring ventilation or not during H7N9 infection. (C and D) Frequencies of virus-specific T cells and sampling times for the patients requiring ventilation or not; points from the same patients are connected. In the ventilation group, four patients provided samples at T3, 3 at T1 and T2, and 3 at T2 and T3; in the patients not requiring ventilation, one provided samples at T1, 1 at T2, 4 at T3, 5 at T1 and T2, 5 at T2 and T3, and 2 at T1, T2, and T3 (A to D). (E and F) Percentages of H7N9 virus-specific IFN-␥-secreting CD8⫹or CD4⫹T cells at T1, T2, and T3 in subjects with or without corticosteroid treatment during H7N9 infection. (G and H) Frequencies of virus-specific T cells and sampling times for the patients with or without corticosteroid treatment; points from the same patients are connected. In the corticosteroid treatment group one patient provided samples at T1, 2 at T2, 6 at T3, 6 at T1 and T2, 3 at T2 and T3, and 1 at T1, T2, and T3; in the patients not requiring corticosteroid treatment, two patients provided samples at T2, 4 at T3, 2 at T1 and T2, 2 at T2 and T3, and 1 at T1, T2, and T3 (E to H). Generalized estimating equations (GEEs) were used to analyze longitudinal data across time points in each group (A to H). In comparisons between two groups at the same time point, the Mann-Whitney test was used (A to H).
Antigen-Specific Immune Memory among H7N9 Survivors Journal of Virology
on November 6, 2019 by guest
http://jvi.asm.org/
[image:9.585.44.541.70.292.2]infection, the H7N9/H1N1/H3N2-specific HI titers in paired samples at T2 and T3 were analyzed (Table 3). None of the subjects experienced a seroconversion during this period. H7N9-specific T cell responses in subjects with elevated seasonal influenza A virus-specific antibody remained stable or decreased across the three time slots (Fig. 6), which indicated that potential infection with seasonal influenza viruses was not likely to contribute to the observed increase of H7N9-specific T cell responses. Overall, H7N9-specific cellular immune responses were lower in severely ill patients requiring ventilation than in patients with milder disease within 4 months of disease onset, and they increased in severely ill patients and patients older than 60 years to a level similar to that in patients with milder disease and younger patients at 1 year after infection.
Functional characteristics of virus-specific T cell memory after H7N9 infection.
Previous studies have shown that CD4⫹and/or CD8⫹T cells with multiple cytokine
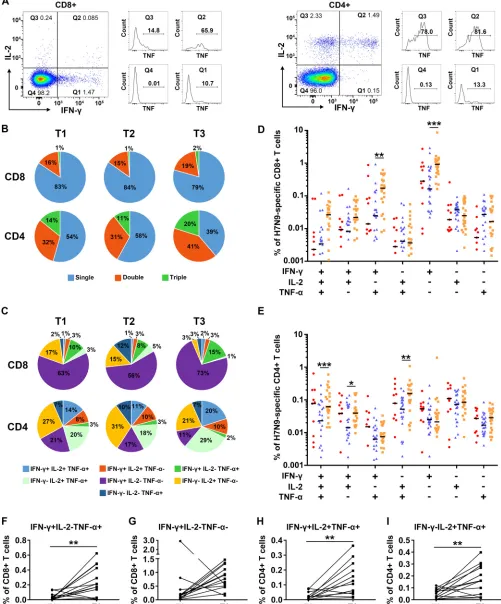
production might be more efficient in controlling virus infection (24). We therefore analyzed the proportion of single-cytokine-secreting and multiple-cytokine-secreting H7N9 virus-specific T cells across the time points (Fig. 7). Representative flow plots for multiple cytokine determination are shown in Fig. 7A. The results showed that
[image:10.585.41.375.82.253.2]single-cytokine-secreting CD8⫹ T cells dominated virus-specific CD8⫹ T cells (79 to 84%)
TABLE 3HI titers in serial samples (T2 and T3) included in analysis
Patient
HI titer
H7N9 H1N1 H3N2
T2 T3 T2 T3 T2 T3
C10 40 20 20 20 5 5
C11 20 20 20 20 5 5
C12 80 80 80 80 5 10
C13 10 10 10 10 5 5
C17 5 5 5 5 20 20
C26 80 20 20 20 10 10
C30 40 40 5 10 5 20
C31 20 20 20 20 5 5
C32 160 40 40 40 20 10
C33 10 10 10 10 20 20
C35 20 10 10 10 10 5
C36 80 20 20 20 5 5
C37 20 10 10 10 10 10
FIG 6Functional characterization of H7N9-specific T cell responses in eight individuals with elevated seasonal influenza virus antibody titers at T1, T2, or T3. Four patients provided PBMCs at T1 and T2, three at T1, T2, and T3, and one at T3 only. Percentages of H7N9 virus-specific IFN-␥-secreting CD8⫹(A) or CD4⫹(D) T cells, IL-2-secreting CD8⫹(B) or CD4⫹(E) T cells, and TNF-␣-secreting CD8⫹(C) or CD4⫹(F) T cells are shown.
September 2018 Volume 92 Issue 17 e01024-18 jvi.asm.org 10
on November 6, 2019 by guest
http://jvi.asm.org/
[image:10.585.41.475.503.699.2]FIG 7Functional characterization of H7N9-specific T cell memory responses. (A) Gating strategies for multiple cytokine analyses. (B) Percentages of T cells secreting IFN-␥, IL-2, or TNF-␣only (single), simultaneously secreting two of IFN-␥, IL-2, or TNF-␣(double), or simultaneously secreting IFN-␥, IL-2, and TNF-␣ (triple) in virus-specific CD8⫹or CD4⫹T cells at T1, T2, and T3. (C) Percentages of T cells secreting IFN-␥, IL-2, and/or TNF-␣as indicated in virus-specific CD8⫹ or CD4⫹T cells at T1, T2, and T3. (D and E) Percentages of virus-specific CD8⫹or CD4⫹T cells secreting IFN-␥, IL-2, and/or TNF-␣as indicated in CD8⫹or CD4⫹
(Continued on next page)
Antigen-Specific Immune Memory among H7N9 Survivors Journal of Virology
on November 6, 2019 by guest
http://jvi.asm.org/
[image:11.585.40.541.77.681.2](Fig. 7B). On the other hand, the distribution of functional subsets of virus-specific CD4⫹ T cells was much more balanced between multiple- and single-cytokine secretion (Fig.
7B). The proportion of multiple-cytokine-secreting CD4⫹T cells tended to increase at T3
compared with those at T1 and T2, while the proportion of CD8⫹ T cells remained
stable (Fig. 7B).
Comparative analysis of the proportions of functional subsets across the three time
points showed that the percentages of some of the subsets detected at T3, either CD8⫹
(IFN-␥⫹IL-2⫺TNF-␣⫹and IFN-␥⫹IL-2⫺TNF-␣⫺) or CD4⫹(IFN-␥⫹IL-2⫹TNF-␣⫹, IFN-␥⫹
IL-2⫹TNF-␣⫺and IFN-␥⫺IL-2⫹TNF-␣⫹) T cells, were significantly higher than those at
T2 (Fig. 7D and E). IFN-␥⫹IL-2⫺TNF-␣⫹and IFN-␥⫹IL-2⫺TNF-␣⫺CD8⫹T cells were the
dominant subsets of virus-specific CD8⫹T cells (Fig. 7C). In patients with longitudinal
paired samples at T2 and T3, the percentage of H7N9-specific IFN-␥⫹IL-2⫺ TNF-␣⫹
CD8⫹T cells was significantly higher at T3 (Fig. 7F), while the percentage of IFN-␥⫹
IL-2⫺TNF-␣⫺CD8⫹T cells increased at T3 in 11 out of 13 subjects (Fig. 7G). IFN-␥⫹
IL-2⫹TNF-␣⫹and IFN-␥⫺IL-2⫹TNF-␣⫹CD4⫹T cells were among the most frequent
H7N9-specific CD4⫹T cells; the percentages of both subsets were significantly higher
at T3 in paired samples (Fig. 7C, H, and I). In all of the patients agedⱖ60 years with
longitudinal samples at T2 and T3, the percentages of IFN-␥⫹IL-2⫺TNF-␣⫹and IFN-␥⫹
IL-2⫺TNF-␣⫺CD8⫹T cells and percentages of IFN-␥⫹IL-2⫹TNF-␣⫹and IFN-␥⫺IL-2⫹
TNF-␣⫹CD4⫹T cells at T3 were higher than those at T2. Taken together, these results
demonstrated that the percentages of the main subsets of H7N9-specific CD8⫹and
CD4⫹T cells increased at 1 year after H7N9 infection, most consistently in patients aged
ⱖ60 years.
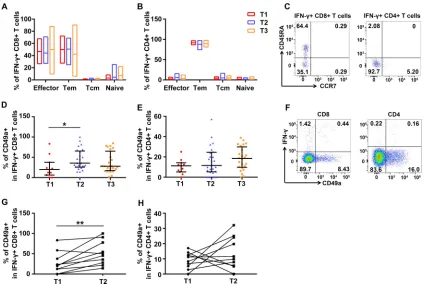
Establishment of H7N9-specific memory T cell immunity. To investigate the phenotypes of H7N9 virus-specific T cells, different subsets were analyzed based on the expression of CCR7 and CD45RA. Representative flow plots are shown in Fig. 8C.
The results demonstrated that virus-specific CD8⫹T cells were composed mainly of
effector and effector memory T cells (Fig. 8A), while the majority (⬎80%) of
virus-specific CD4⫹T cells were effector memory T cells (Fig. 8B). No significant differences
were observed across three time points for each subset.
Further, expression of CD49a on T cells was analyzed to investigate the lung/ mucosa-associated homing efficacy of these T cells. Lung T cells uniformly express
CD49a, and CD49a expression is strongest on the CD8⫹subset, while fewer CD4⫹T
cells express CD49a (25, 26). CD49a seems to be relatively specific for lung T cells (25)
and is responsible for retaining protective memory CD8⫹ T cells in the lung (27).
Representative flow plots are shown in Fig. 8F. The proportion of CD49a⫹ H7N9
virus-specific CD8⫹T cells secreting IFN-␥was significantly higher at T2 than at T1 (Fig.
8D), while IFN-␥secreting CD49a⫹virus-specific CD4⫹T cells showed higher levels at
T2 and T3 than that at T1, although this was not statistically significant (Fig. 8E). In
addition, the percentages of CD49a⫹cells among H7N9-specific IFN-␥⫹CD8⫹T cells
increased in nine out of 10 subjects (Fig. 8G), and those among H7N9-specific IFN-␥⫹
CD4⫹T cells increased in six out of 10 subjects (Fig. 8H), in paired samples at T1 and
T2. The percentages and changes of CD49a⫹cells among H7N9-specific IFN-␥⫹CD8⫹
T cells and CD4⫹T cells did not vary by the age or ventilation status of the patients.
These results indicated that lung/mucosa-homing capability of H7N9 virus-specific T cells experienced dynamic changes long after H7N9 infection.
FIG 7Legend (Continued)
T cells at T1 (red), T2 (blue), and T3 (orange). The means for each cytokine combination for each group are in black. Generalized estimating equations (GEEs) were used to analyze longitudinal data across time points in each group. All eligible patients were included in the analyses (Table 2); one patient provided samples at T1, 4 at T2, 11 at T3, 8 at T1 and T2, 11 at T2 and T3, and 2 at T1, T2, and T3 (B to E). (F to I) Changes of percentages of virus-specific CD8⫹(F and G) or CD4⫹(H and I) T cells secreting IFN-␥, IL-2, and/or TNF-␣as indicated in CD8⫹or CD4⫹T cells of subjects with longitudinal paired samples at T2 and T3. Thirteen patients with longitudinal paired samples at T2 and T3 were included in the analyses (F to I). The pairedttest (F, H, and I) and Wilcoxon matched-pairs signed-rank test (G) were used for pairwise analyses.
September 2018 Volume 92 Issue 17 e01024-18 jvi.asm.org 12
on November 6, 2019 by guest
http://jvi.asm.org/
DISCUSSION
In this study, we established a cohort of 45 H7N9 survivors from the 2013 and 2013-2014 epidemic seasons and followed them for more than 1 year to characterize the dynamic changes of H7N9-specific humoral and cellular memory immunity. To the best of our knowledge, this work is the first of its kind, using serial samples to explore the levels and dynamics of immunity after avian influenza virus infection. During this period, H7N9-specific antibody titers decreased and were undetectable in most
pa-tients at about 1 year after infection. While CD8⫹/CD4⫹ T cell memory immune
responses were lower in critically ill patients within 4 months after infection, these increased significantly in patients older than 60 years and in critically ill patients 1 year
after infection. In addition, the lung homing markers of virus-specific CD8⫹ T cells
increased significantly at 6 to 8 months after infection.
A small number of pH1N1-infected individuals had been followed for 1 year in
previous studies, and the percentages of subjects with HI titers ofⱖ40 (or 64) ranged
from 13.9% to 76.9% at about 1 year after infection in those studies (24, 28, 29). It was reported that antibodies waned faster in H5N1 and pH1N1 patients with mild infections than in those with severe infections (24, 30). Ma et al. reported that 36.4% of H7N9
survivors had HI titers ofⱖ40 at about 1 year after infection, which was similar to our
findings (31). Ma et al. found no clear association between disease severity and antibody response; however, we demonstrated that antibody levels were significantly higher in critically ill patients admitted to the ICU and in patients who presented with ARDS than in patients with milder illness at about 6 months after infection. Previous studies found a significant correlation between the virus-specific antibody titer and
FIG 8Memory and homing phenotypes of H7N9-specific T cells. (A to C) Memory subsets of H7N9-specific, IFN-␥secreting CD4⫹(A) or CD8⫹(B) T cells at three time points based on the expression of CD45RA and CCR7 and representative flow plots (C). Naive, naive T cells (CD45RA⫹CCR7⫹); Tcm, central memory T cells (CD45RA⫺CCR7⫹); Tem, effector memory T cells (CD45RA⫺CCR7⫺) and effector, effector T cells (CD45RA⫹CCR7⫺). (D to F) Percentages of CD49a expression on H7N9-specific CD8⫹(D) and CD4⫹(E) T cells secreting IFN-␥and representative flow plots (F). All eligible patients were included in the analyses (Table 2). One patient provided samples at T1, 4 at T2, 11 at T3, 8 at T1 and T2, 11 at T2 and T3, and 2 at T1, T2, and T3 (A, B, D, and E). Generalized estimating equations (GEEs) were used to analyze longitudinal data across time points. (G and H) Changes of percentages of CD49a expression on IFN-␥⫹ H7N9-specific CD8⫹(G) and CD4⫹(H) T cells in longitudinal samples at T1 and T2. Ten patients with longitudinal paired samples at T1 and T2 were included in the analyses (G and H). The pairedttest was used for the pairwise analyses.
Antigen-Specific Immune Memory among H7N9 Survivors Journal of Virology
on November 6, 2019 by guest
http://jvi.asm.org/
[image:13.585.40.464.70.356.2]virus threshold cycle (CT) value measured by real-time PCR from nasal swabs of acutely
pH1N1-infected patients (13, 32). Unfortunately, information about viral load and shedding was not known in our study.
The magnitude and functional dynamics of virus-specific T cell responses were studied in H7N9 survivors. No significant correlation between T cell responses and antibody titers was observed for the survivors after H7N9 infection. The dynamic changes of humoral immunity and T cell immunity may not parallel each other during
recovery. We found that most subsets of the virus-specific CD8⫹/CD4⫹T cells, but not
IL-2⫹ CD8⫹ T cells and CD4⫹ T cells, tended to increase over time within 1 year
postinfection in patients agedⱖ60 years (Fig. 4G and L), most obviously in those with
longitudinal paired samples at T2 and T3 (Fig. 4M and N). In addition, severely ill patients requiring ventilation mounted lower virus-specific T cell responses than pa-tients with mild disease within 4 months after infection, and T cell responses tended to
increase over time in patients requiring ventilation. Moreover, the increase of CD8⫹T
cells is attributable to IFN-␥⫹IL-2⫺TNF-␣⫺and IFN-␥⫹IL-2⫺TNF-␣⫹CD8⫹T cells, and
the rise of CD4⫹T cells is due to IFN-␥⫹IL-2⫹TNF-␣⫹and IFN-␥⫺IL-2⫹TNF-␣⫹CD4⫹
T cells. These T cell groups were among the most abundant subsets (Fig. 7C). In this study, we found the previously unrevealed phenomenon that H7N9-specific T cell responses tended to increased long after recovery in elderly patients and critically ill patients.
Given the absence of any clinical manifestations and seroconversion of H7N9 or seasonal influenza viruses during this period, the prolonged increase of virus-specific T cell responses 1 year after H7N9 infection was quite unusual. Zhao et al. had reported
that antigen-specific CD8⫹T cells in the lungs were on average 45-fold higher than
those in blood in the acute phase of severe pandemic influenza A virus infection (32). Thus, one possibility is that during the acute infection, there was accumulation of
H7N9-specific CD8⫹T cells in the lungs but not in the blood in elderly patients and
critically ill patients and that some of those cells recirculated to the blood over time. Another possible explanation is memory “inflation,” which had been found in acute parvovirus B19 infections (33, 34) and PARV4 infections (35) in humans; these settings have in common the long-term but low-level persistence of antigen (36). Persistence of H7N9 virus had been found in an HIV-infected patient (37). It might be the case that H7N9 viruses persisted longer in older and critically ill patients due to the inefficient immune responses and caused memory inflation.
Cellular immunity plays a vital role in recovery of patients from new emerging
influenza virus infections. Wang et al. reported that an early robust CD8⫹ T cell
response in the acute phase is correlated with recovery from severe H7N9 disease (16). Bonduelle et al. reported that severely ill subjects maintained high levels of humoral responses, while mildly ill subjects retained strong cellular immunity 1 year after pH1N1 infection (24). In this study, we found that protective antibodies persisted longer in severely affected patients, that patients with more severe disease mounted lower T cell responses early after infection, and that the establishment of T cell immunity showed a significant delay in older and severely ill patients compared with those in younger and mildly affected patients. Together with the earlier reports, our findings here support the theory that when the host encounters newly emerging influenza A viruses, it is the cross-protective cellular memory which contributes to the resolution of infection. We also found that patients older than 60 years mounted lower T cell responses early after infection; although this was not statistically significant, it corre-lated with the more severe disease caused by H7N9 infection in this age group.
Our study had several limitations. First, we did not have access to the full-acute phase clinical data for the patients, which might impact some comparisons (e.g., in Fig. 2I). Second, we did not have enough samples to study the mechanisms for the increase of T cell responses in older and critically ill patients long after recovery, which are worth further investigation. Third, one concern about the T cell responses detected in this study is their origin, which might be due to H7N9 reinfection or cross-reactive T cell responses derived from seasonal influenza virus infection. We and others have found
September 2018 Volume 92 Issue 17 e01024-18 jvi.asm.org 14
on November 6, 2019 by guest
http://jvi.asm.org/
that H7N9 virus-specific mutations in T cell epitopes could have induced immune evasion in subjects naive to H7N9 (38). On the other hand, there are indeed conserved epitopes between H7N9 and seasonal influenza viruses, which may contribute to cross-protection against H7N9 infection (16, 39). Thus, the T cells reactive to H7N9 virus detected in this study could be derived from both H7N9-specific and conserved epitopes. Due to the limited volumes of the samples, we were unable to investigate T cell responses to seasonal influenza viruses during recovery.
In summary, we have followed an H7N9 survivor cohort for over 1 year after infection. The findings of lower virus-specific T cell responses in severely ill patients early after infection indicate that protective T cell responses may contribute to the recovery from H7N9 infections. The unexpected increase of T cell responses in older and severely ill patients 1 year after infection will benefit our understanding of the dynamics of natural virus-specific memory T cell immunity after H7N9 infection and contribute to the development of T cell-based universal influenza vaccines.
MATERIALS AND METHODS
Ethics statement.The study was approved by the ethics committee of Institute of Microbiology, Chinese Academy of Sciences and Chinese Center for Disease Control and Prevention (China CDC). Written informed consent was obtained from each of the subjects. The study was conducted in accordance with the principles of the Declaration of Helsinki, the standards of Good Clinical Practice (as defined by the International Conference on Harmonization), and Chinese regulatory requirements, as stipulated by the Chinese Food and Drug Administration.
Study design.Forty-five patients with laboratory-confirmed H7N9 virus infection in six provinces of China (Beijing, Shandong, Zhejiang, Fujian, Hunan, and Jiangxi) during the 2013 and 2013-2014 seasons (Fig. 1) were recruited. Sera and PBMCs were collected at three time points after the disease onset day, i.e., T1 (1.5 to 4 months), T2 (6 to 8 months), and T3 (12 to 15 months). Among the 45 survivors, there were 28 who had consecutive samples for at least two time points. No influenza-like illness or vaccinations during the follow-up period were reported for any survivors based on questionnaires. In addition, we enrolled 18 age- and gender-matched subjects from the Departments of Surgery and Neurology of the Aviation General Hospital, Beijing, China, in October 2015 to serve as controls. None of the controls showed any symptoms of respiratory infections or any other infectious diseases, and none had known conditions or treatments that would interfere with their immune responses.
HI assay.For the H3N2 hemagglutination inhibition (HI) assay, A/Switzerland/9715293/2013 was used, as it was the dominant H3N2 group during the 2013 to 2014 and 2014 to 2015 winter seasons in mainland China (40). The titers of serum antibodies against H7N9 (A/Anhui/01/2013), H1N1 (A/California/ 04/2009), and H3N2 (A/Switzerland/9715293/2013) were measured in all samples by a microtiter HI assay as described previously (41). Briefly, the serum samples were pretreated with cholera filtrate at 37°C for 16 h. Subsequently, serial 2-fold dilutions of serum samples (with 1:10 as the first dilution) were tested against four hemagglutinin units of antigen with chicken red blood cells. The HI titers were defined as the reciprocal of the highest serum dilution that completely inhibited hemagglutination. For final titers of⬍1:10 we assigned a value of 1:5 (seronegative). All samples were assayed in a blinded manner in duplicate.
Virus-specific T cell stimulation and intracellular cytokine staining.Stimulation of H7N9-specific T cells was performed using thawed PBMCs that had been frozen in liquid nitrogen as described previously (16, 20). Briefly, 1⫻106PBMCs were stimulated with or without (negative control) live H7N9 virus (A/Anhui/01/2013) at a multiplicity of infection (MOI) of 3 for 1 h. Subsequently, 10% fetal bovine serum (FBS) was added to the cultures and incubated for 3 h. The cells were then cultured for an additional 18 h in the presence of monecin (1:2,000; BD). This method had been widely used to detect memory T cells in humans, as the frequencies of antigen-specific naive T cell populations are very low, and naive T cells undergo activation including mRNA and protein synthesis before proliferation ensues 24 h later (17, 42, 43). After stimulation, the PBMCs were stained with fluorescently labeled monoclonal antibodies (MAbs), including CD4, CD8, CD45RA, CCR7, and CD49a MAbs. Subsequently, the cells were fixed and permeabilized with BD Fix/Perm buffer and stained in BD Perm/Wash buffer with intracellular markers, including IL-2, IFN-␥, and TNF-␣. After washing, PBMCs were resuspended in fluorescence-activated cell sorter (FACS) buffer for flow cytometry analysis (BD LSR Fortessa). All the fluorescently labeled antibodies were obtained from BD. The percentages of T cells secreting particular cytokines (IFN-␥, IL-2, or TNF-␣) among the total CD8⫹/CD4⫹T cells, but not the absolute number of the cells, were calculated and compared between groups or across time points. Data were analyzed with FlowJo software version 10.
Statistical analysis.In comparisons between two groups at the same time point, Student’sttest was used for normally distributed data (evaluated by the Kolmogorov-Smirnov test) with equal variance, Welch’sttest was used for normally distributed data with unequal variance, and the Mann-Whitney test was used for nonparametric analyses. As the longitudinal data from the same subjects at different time points were not independent from each other and the time interval varied in different patients, a generalized estimating equation (GEE) approach was chosen for analyses of longitudinal data. For pairwise analyses, the paired ttest was used where the differences between pairs were normally
Antigen-Specific Immune Memory among H7N9 Survivors Journal of Virology
on November 6, 2019 by guest
http://jvi.asm.org/
distributed; the Wilcoxon matched-pairs signed-rank test was used when the differences between pairs were nonnormal. Statistical significance was inferred forP⬍0.05 (*),P⬍0.01 (**), andP⬍0.001 (***). All statistical analyses were performed with GraphPad Prism 6.0 and IBM SPSS 23.0.
ACKNOWLEDGMENTS
This study was funded by grants from the National Science Fund for Distinguished Young Scholars (81525023), the National Natural Science Foundation of China (81401312 and 81373141), the U.S. National Institutes of Health (Comprehensive Inter-national Program for Research on AIDS grant U19 AI51915), and National Science and Technology Major Project of Control and Prevention for AIDS, Viral Hepatitis, and Other Major Infectious Diseases (2017ZX10103009-005 and 2018ZX10713001-007). G.F.G. is a leading principal investigator of the National Natural Science Foundation of China Innovative Research Group (grant 81621091). P.K. is supported by grant WT109965MA from the NIHR Biomedical Research Centre, Oxford, United Kingdom, and by an NIHR Senior Fellowship.
We thank the participating CDCs for assistance in coordinating cases and supporting this study. We thank Shenggen Wu (Fujian Provincial Center for Disease Control and Prevention, Fuzhou, China), Qianlai Sun (Hunan Provincial Center for Disease Control and Prevention, Changsha, China), Shelan Liu, Xiaoxiao Wang, and Zhao Yu (Zhejiang Provincial Center for Disease Control and Prevention, Hangzhou, China), Yun Xie (Jiangxi Provincial Center for Disease Control and Prevention, Nanchang, China), and Shaoxia Song (Shandong Provincial Center for Disease Control and Prevention, Jinan, China). We thank Yiting Zhang (Princeton University, Princeton, NJ, USA) for assistance with drawing the figures.
G.F.G., W.J.L., and H.Y. designed and supervised the study. M.Z., J.C., H.J., J.Z., Q.L., Q.W., F.L., and L.F. collected the samples. M.Z., S.T., C.Q., H.Z., and Y.B. conducted the experiments. M.Z., J.C., T.D., X.W., P.W.H., P.K., W.J.L., and H.Y. analyzed and interpreted data. M.Z., J.C., W.J.L., and H.Y. wrote the initial drafts of the manuscript. T.D., P.W.H., and P.K. commented on and revised drafts of the manuscript.
H.Y. has received investigator-initiated research funding from Sanofi Pasteur, Glaxo-SmithKline, bioMérieux Diagnostic Product (Shanghai), and Yichang HEC Changjiang Pharmaceutical Company. All other authors declare no competing interests.
REFERENCES
1. Gao R, Cao B, Hu Y, Feng Z, Wang D, Hu W, Chen J, Jie Z, Qiu H, Xu K, Xu X, Lu H, Zhu W, Gao Z, Xiang N, Shen Y, He Z, Gu Y, Zhang Z, Yang Y, Zhao X, Zhou L, Li X, Zou S, Zhang Y, Li X, Yang L, Guo J, Dong J, Li Q, Dong L, Zhu Y, Bai T, Wang S, Hao P, Yang W, Zhang Y, Han J, Yu H, Li D, Gao GF, Wu G, Wang Y, Yuan Z, Shu Y. 2013. Human infection with a novel avian-origin influenza A (H7N9) virus. N Engl J Med 368: 1888 –1897.https://doi.org/10.1056/NEJMoa1304459.
2. Li Q, Zhou L, Zhou M, Chen Z, Li F, Wu H, Xiang N, Chen E, Tang F, Wang D, Meng L, Hong Z, Tu W, Cao Y, Li L, Ding F, Liu B, Wang M, Xie R, Gao R, Li X, Bai T, Zou S, He J, Hu J, Xu Y, Chai C, Wang S, Gao Y, Jin L, Zhang Y, Luo H, Yu H, He J, Li Q, Wang X, Gao L, Pang X, Liu G, Yan Y, Yuan H, Shu Y, Yang W, Wang Y, Wu F, Uyeki TM, Feng Z. 2014. Epidemiology of human infections with avian influenza A(H7N9) virus in China. N Engl J Med 370:520 –532.https://doi.org/10.1056/NEJMoa1304617.
3. Belser JA, Bridges CB, Katz JM, Tumpey TM. 2009. Past, present, and possible future human infection with influenza virus A subtype H7. Emerg Infect Dis 15:859 – 865.https://doi.org/10.3201/eid1506.090072. 4. Fouchier RA, Schneeberger PM, Rozendaal FW, Broekman JM, Kemink
SA, Munster V, Kuiken T, Rimmelzwaan GF, Schutten M, Van Doornum GJ, Koch G, Bosman A, Koopmans M, Osterhaus AD. 2004. Avian influ-enza A virus (H7N7) associated with human conjunctivitis and a fatal case of acute respiratory distress syndrome. Proc Natl Acad Sci U S A 101:1356 –1361.https://doi.org/10.1073/pnas.0308352100.
5. Skowronski DM, Tweed SA, Petric M, Booth T, Li Y, Tam T. 2006. Human illness and isolation of low-pathogenicity avian influenza virus of the H7N3 subtype in British Columbia, Canada. J Infect Dis 193:899 –900, (Author reply, 193:900 –901).
6. Cowling BJ, Jin L, Lau EH, Liao Q, Wu P, Jiang H, Tsang TK, Zheng J, Fang
VJ, Chang Z, Ni MY, Zhang Q, Ip DK, Yu J, Li Y, Wang L, Tu W, Meng L, Wu JT, Luo H, Li Q, Shu Y, Li Z, Feng Z, Yang W, Wang Y, Leung GM, Yu H. 2013. Comparative epidemiology of human infections with avian influenza A H7N9 and H5N1 viruses in China: a population-based study of laboratory-confirmed cases. Lancet 382:129 –137.https://doi.org/10 .1016/S0140-6736(13)61171-X.
7. Wang X, Jiang H, Wu P, Uyeki TM, Feng L, Lai S, Wang L, Huo X, Xu K, Chen E, Wang X, He J, Kang M, Zhang R, Zhang J, Wu J, Hu S, Zhang H, Liu X, Fu W, Ou J, Wu S, Qin Y, Zhang Z, Shi Y, Zhang J, Artois J, Fang VJ, Zhu H, Guan Y, Gilbert M, Horby PW, Leung GM, Gao GF, Cowling BJ, Yu H. 2017. Epidemiology of avian influenza A H7N9 virus in human beings across five epidemics in mainland China, 2013–17: an epidemiological study of laboratory-confirmed case series. Lancet Infect Dis 17:822– 832.
https://doi.org/10.1016/S1473-3099(17)30323-7.
8. Gao HN, Lu HZ, Cao B, Du B, Shang H, Gan JH, Lu SH, Yang YD, Fang Q, Shen YZ, Xi XM, Gu Q, Zhou XM, Qu HP, Yan Z, Li FM, Zhao W, Gao ZC, Wang GF, Ruan LX, Wang WH, Ye J, Cao HF, Li XW, Zhang WH, Fang XC, He J, Liang WF, Xie J, Zeng M, Wu XZ, Li J, Xia Q, Jin ZC, Chen Q, Tang C, Zhang ZY, Hou BM, Feng ZX, Sheng JF, Zhong NS, Li LJ. 2013. Clinical findings in 111 cases of influenza A (H7N9) virus infection. N Engl J Med 368:2277–2285.https://doi.org/10.1056/NEJMoa1305584.
9. Ip DKM, Liao Q, Wu P, Gao Z, Cao B, Feng L, Xu X, Jiang H, Li M, Bao J, Zheng J, Zhang Q, Chang Z, Li Y, Yu J, Liu F, Ni MY, Wu JT, Cowling BJ, Yang W, Leung GM, Yu H. 2013. Detection of mild to moderate influenza A/H7N9 infection by China’s national sentinel surveillance system for influenza-like illness: case series. BMJ 346:f3693.https://doi.org/10.1136/ bmj.f3693.
10. Guo J, Huang F, Liu J, Chen Y, Wang W, Cao B, Zou Z, Liu S, Pan J, Bao
September 2018 Volume 92 Issue 17 e01024-18 jvi.asm.org 16
on November 6, 2019 by guest
http://jvi.asm.org/
C, Zeng M, Xiao H, Gao H, Yang S, Zhao Y, Liu Q, Zhou H, Zhu J, Liu X, Liang W, Yang Y, Zheng S, Yang J, Diao H, Su K, Shao L, Cao H, Wu Y, Zhao M, Tan S, Li H, Xu X, Wang C, Zhang J, Wang L, Wang J, Xu J, Li D, Zhong N, Cao X, Gao GF, Li L, Jiang C. 2015. The serum profile of hypercytokinemia factors identified in H7N9-infected patients can pre-dict fatal outcomes. Sci Rep 5:10942.https://doi.org/10.1038/srep10942. 11. Huang F, Guo J, Zou Z, Liu J, Cao B, Zhang S, Li H, Wang W, Sheng M, Liu S, Pan J, Bao C, Zeng M, Xiao H, Qian G, Hu X, Chen Y, Chen Y, Zhao Y, Liu Q, Zhou H, Zhu J, Gao H, Yang S, Liu X, Zheng S, Yang J, Diao H, Cao H, Wu Y, Zhao M, Tan S, Guo D, Zhao X, Ye Y, Wu W, Xu Y, Penninger JM, Li D, Gao GF, Jiang C, Li L. 2014. Angiotensin II plasma levels are linked to disease severity and predict fatal outcomes in H7N9-infected patients. Nat Commun 5:3595.https://doi.org/10.1038/ncomms4595.
12. Wang Z, Zhang A, Wan Y, Liu X, Qiu C, Xi X, Ren Y, Wang J, Dong Y, Bao M, Li L, Zhou M, Yuan S, Sun J, Zhu Z, Chen L, Li Q, Zhang Z, Zhang X, Lu S, Doherty PC, Kedzierska K, Xu J. 2014. Early hypercytokinemia is associated with interferon-induced transmembrane protein-3 dysfunc-tion and predictive of fatal H7N9 infecdysfunc-tion. Proc Natl Acad Sci U S A 111:769 –774.https://doi.org/10.1073/pnas.1321748111.
13. Zhang YH, Zhao Y, Li N, Peng YC, Giannoulatou E, Jin RH, Yan HP, Wu H, Liu JH, Liu N, Wang DY, Shu YL, Ho LP, Kellam P, McMichael A, Dong T. 2013. Interferon-induced transmembrane protein-3 genetic variant rs12252-C is associated with severe influenza in Chinese individuals. Nat Commun 4:1418.https://doi.org/10.1038/ncomms2433.
14. Diao H, Cui G, Wei Y, Chen J, Zuo J, Cao H, Chen Y, Yao H, Tian Z, Li L. 2014. Severe H7N9 infection is associated with decreased antigen-presenting capacity of CD14⫹cells. PLoS One 9:e92823.https://doi.org/ 10.1371/journal.pone.0092823.
15. Chen J, Cui G, Lu C, Ding Y, Gao H, Zhu Y, Wei Y, Wang L, Uede T, Li L, Diao H. 2016. Severe infection with avian influenza A virus is associated with delayed immune recovery in survivors. Medicine (Baltimore, MD) 95:e2606.https://doi.org/10.1097/MD.0000000000002606.
16. Wang Z, Wan Y, Qiu C, Quinones-Parra S, Zhu Z, Loh L, Tian D, Ren Y, Hu Y, Zhang X, Thomas PG, Inouye M, Doherty PC, Kedzierska K, Xu J. 2015. Recovery from severe H7N9 disease is associated with diverse response mechanisms dominated by CD8(⫹) T cells. Nat Commun 6:6833.https:// doi.org/10.1038/ncomms7833.
17. Lee LY, Ha do LA, Simmons C, de Jong MD, Chau NV, Schumacher R, Peng YC, McMichael AJ, Farrar JJ, Smith GL, Townsend AR, Askonas BA, Rowland-Jones S, Dong T. 2008. Memory T cells established by seasonal human influenza A infection cross-react with avian influenza A (H5N1) in healthy individuals. J Clin Invest 118:3478 –3490. https://doi.org/10 .1172/JCI32460.
18. McMichael AJ, Gotch FM, Noble GR, Beare PA. 1983. Cytotoxic T-cell immunity to influenza. N Engl J Med 309:13–17.https://doi.org/10.1056/ NEJM198307073090103.
19. Wilkinson TM, Li CK, Chui CS, Huang AK, Perkins M, Liebner JC, Lambkin-Williams R, Gilbert A, Oxford J, Nicholas B, Staples KJ, Dong T, Douek DC, McMichael AJ, Xu XN. 2012. Preexisting influenza-specific CD4⫹T cells correlate with disease protection against influenza challenge in humans. Nat Med 18:274 –280.https://doi.org/10.1038/nm.2612.
20. Sridhar S, Begom S, Bermingham A, Hoschler K, Adamson W, Carman W, Bean T, Barclay W, Deeks JJ, Lalvani A. 2013. Cellular immune correlates of protection against symptomatic pandemic influenza. Nat Med 19: 1305–1312.https://doi.org/10.1038/nm.3350.
21. Hayward AC, Wang L, Goonetilleke N, Fragaszy EB, Bermingham A, Copas A, Dukes O, Millett ER, Nazareth I, Nguyen-Van-Tam JS, Watson JM, Zambon M, Johnson AM, McMichael AJ. 2015. Natural T cell-mediated protection against seasonal and pandemic influenza. Results of the Flu Watch Cohort Study. Am J Respir Crit Care Med 191: 1422–1431.https://doi.org/10.1164/rccm.201411-1988OC.
22. Forrest BD, Pride MW, Dunning AJ, Capeding MR, Chotpitayasunondh T, Tam JS, Rappaport R, Eldridge JH, Gruber WC. 2008. Correlation of cellular immune responses with protection against culture-confirmed influenza virus in young children. Clin Vaccine Immunol 15:1042–1053.
https://doi.org/10.1128/CVI.00397-07.
23. McElhaney JE, Xie D, Hager WD, Barry MB, Wang Y, Kleppinger A, Ewen C, Kane KP, Bleackley RC. 2006. T cell responses are better correlates of vaccine protection in the elderly. J Immunol 176:6333– 6339.https://doi .org/10.4049/jimmunol.176.10.6333.
24. Bonduelle O, Carrat F, Luyt CE, Leport C, Mosnier A, Benhabiles N, Krivine A, Rozenberg F, Yahia N, Samri A, Rousset D, van der Werf S, Autran B, Combadiere B. 2014. Characterization of pandemic influenza immune
memory signature after vaccination or infection. J Clin Invest 124: 3129 –3136.https://doi.org/10.1172/JCI74565.
25. Purwar R, Campbell J, Murphy G, Richards WG, Clark RA, Kupper TS. 2011. Resident memory T cells (TRM) are abundant in human lung: diversity, function, and antigen specificity. PLoS One 6:e16245.https://doi.org/10 .1371/journal.pone.0016245.
26. Richter M, Ray SJ, Chapman TJ, Austin SJ, Rebhahn J, Mosmann TR, Gardner H, Kotelianski V, deFougerolles AR, Topham DJ. 2007. Collagen distribution and expression of collagen-binding alpha1beta1 (VLA-1) and alpha2beta1 (VLA-2) integrins on CD4 and CD8 T cells during influenza infection. J Immunol 178:4506 – 4516.https://doi.org/10.4049/ jimmunol.178.7.4506.
27. Ray SJ, Franki SN, Pierce RH, Dimitrova S, Koteliansky V, Sprague AG, Doherty PC, de Fougerolles AR, Topham DJ. 2004. The collagen binding alpha1beta1 integrin VLA-1 regulates CD8 T cell-mediated immune protection against heterologous influenza infection. Immunity 20: 167–179.https://doi.org/10.1016/S1074-7613(04)00021-4.
28. Hsu JP, Zhao X, Chen MI, Cook AR, Lee V, Lim WY, Tan L, Barr IG, Jiang L, Tan CL, Phoon MC, Cui L, Lin R, Leo YS, Chow VT. 2014. Rate of decline of antibody titers to pandemic influenza A (H1N1-2009) by hemagglu-tination inhibition and virus microneutralization assays in a cohort of seroconverting adults in Singapore. BMC Infect Dis 14:414.https://doi .org/10.1186/1471-2334-14-414.
29. Sridhar S, Begom S, Hoschler K, Bermingham A, Adamson W, Carman W, Riley S, Lalvani A. 2015. Longevity and determinants of protective hu-moral immunity after pandemic influenza infection. Am J Respir Crit Care Med 191:325–332.https://doi.org/10.1164/rccm.201410-1798OC. 30. Buchy P, Vong S, Chu S, Garcia JM, Hien TT, Hien VM, Channa M, Ha
do, Chau QNV, Simmons C, Farrar JJ, Peiris M, de Jong MD. 2010. Kinetics of neutralizing antibodies in patients naturally infected by H5N1 virus. PLoS One 5:e10864.https://doi.org/10.1371/journal.pone .0010864.
31. Ma MJ, Liu C, Wu MN, Zhao T, Wang GL, Yang Y, Gu HJ, Cui PW, Pang YY, Tan YY, Hang H, Lin B, Qin JC, Fang LQ, Cao WC, Cheng LL. 2018. Influenza A(H7N9) virus antibody responses in survivors 1 year after infection, China, 2017. Emerg Infect Dis 24:663– 672.https://doi.org/10 .3201/eid2404.171995.
32. Zhao Y, Zhang YH, Denney L, Young D, Powell TJ, Peng YC, Li N, Yan HP, Wang DY, Shu YL, Kendrick Y, McMichael AJ, Ho LP, Dong T. 2012. High levels of virus-specific CD4⫹T cells predict severe pandemic influenza A virus infection. Am J Respir Crit Care Med 186:1292–1297.https://doi .org/10.1164/rccm.201207-1245OC.
33. Isa A, Kasprowicz V, Norbeck O, Loughry A, Jeffery K, Broliden K, Klener-man P, Tolfvenstam T, Bowness P. 2005. Prolonged activation of virus-specific CD8⫹T cells after acute B19 infection. PLoS Med 2:e343.https://
doi.org/10.1371/journal.pmed.0020343.
34. Norbeck O, Isa A, Pohlmann C, Broliden K, Kasprowicz V, Bowness P, Klenerman P, Tolfvenstam T. 2005. Sustained CD8⫹ T-cell responses induced after acute parvovirus B19 infection in humans. J Virol 79: 12117–12121.https://doi.org/10.1128/JVI.79.18.12117-12121.2005. 35. Simmons R, Sharp C, Levine J, Bowness P, Simmonds P, Cox A,
Klener-man P. 2013. Evolution of CD8⫹T cell responses after acute PARV4 infection. J Virol 87:3087–3096.https://doi.org/10.1128/JVI.02793-12. 36. Klenerman P. 2018. The (gradual) rise of memory inflation. Immunol Rev
283:99 –112.https://doi.org/10.1111/imr.12653.
37. Zhang A, Wang Q, Wan Y, Zhang R, Shi Y, Zhang Z, Malik P, Xu J. 2015. Influenza (H7N9) leads to persistent encephalitic infection in an HIV-infected patient. Infect Dis Transl Med 1:9 –11.
38. Liu WJ, Tan S, Zhao M, Quan C, Bi Y, Wu Y, Zhang S, Zhang H, Xiao H, Qi J, Yan J, Liu W, Yu H, Shu Y, Wu G, Gao GF. 2016. Cross-immunity against avian influenza A(H7N9) virus in the healthy population is affected by antigenicity-dependent substitutions. J Infect Dis 214: 1937–1946.https://doi.org/10.1093/infdis/jiw471.
39. Quinones-Parra S, Grant E, Loh L, Nguyen TH, Campbell KA, Tong SY, Miller A, Doherty PC, Vijaykrishna D, Rossjohn J, Gras S, Kedzierska K. 2014. Preexisting CD8⫹T-cell immunity to the H7N9 influenza A virus varies across ethnicities. Proc Natl Acad Sci U S A 111:1049 –1054.
https://doi.org/10.1073/pnas.1322229111.
40. Hua S, Li X, Liu M, Cheng Y, Peng Y, Huang W, Tan M, Wei H, Guo J, Wang D, Wu A, Shu Y, Jiang T. 2015. Antigenic variation of the human influenza A (H3N2) virus during the 2014-2015 winter season. Sci China Life Sci 58:882– 888.https://doi.org/10.1007/s11427-015-4899-z.
41. Liu J, Wu B, Zhang S, Tan S, Sun Y, Chen Z, Qin Y, Sun M, Shi G, Wu Y, Sun M, Liu N, Ning K, Ma Y, Gao B, Yan J, Zhu F, Wang H, Gao GF. 2013.
Antigen-Specific Immune Memory among H7N9 Survivors Journal of Virology
on November 6, 2019 by guest
http://jvi.asm.org/
Conserved epitopes dominate cross-CD8⫹T-cell responses against in-fluenza A H1N1 virus among Asian populations. Eur J Immunol 43: 2055–2069.https://doi.org/10.1002/eji.201343417.
42. Obst R. 2015. The timing of T cell priming and cycling. Front Immunol 6:563.https://doi.org/10.3389/fimmu.2015.00563.
43. Best JA, Blair DA, Knell J, Yang E, Mayya V, Doedens A, Dustin ML,
Goldrath AW. 2013. Transcriptional insights into the CD8⫹ T cell re-sponse to infection and memory T cell formation. Nat Immunol 14: 404 – 412.https://doi.org/10.1038/ni.2536.
44. Gao GF. 2018. From ⬙A⬙IV to ⬙Z⬙IKV: attacks from emerging and re-emerging pathogens. Cell 172:1157–1159.https://doi.org/10.1016/j.cell .2018.02.025.
September 2018 Volume 92 Issue 17 e01024-18 jvi.asm.org 18